主に統計学、機械学習、データ分析関連の記事で、Qiitaへ投稿し始めて半年くらいになりました。ちょっと今までの記事をQiita APIを使いながら振り返ってみようと思います。(以下2015/8/10時点のデータから算出)
最初にデータを眺めて、その次にそれらの内容を生成したPythonコードと、PythonからQiita APIを使う方法の解説をします。
1.データを眺める
投稿記事のストック数順
上位5位で73%を占めていますね。人気記事は偏るのですね・・・。
最下位の「ピザで理解する分数の割り算の意味」とか個人的には結構気に入っているのですが、全然ストックされませんね ![]()
カテゴリ別に分類
大きく「機械学習」「統計学」「数学」「データ分析」「その他」のカテゴリで記事を書いています。
| 数学 |
|---|
| 【数学】固有値・固有ベクトルとは何かを可視化してみる |
| ピザで理解する分数の割り算の意味 |
| その他 |
|---|
| Pythonでグラフデータベース Neo4j入門 for ビギナー (Mac OSX向け) |
| Word Cloudで文章の単語出現頻度を可視化する。[Python] |
| 世界で最も影響力のある100人の技術系ツイッターユーザー情報をpythonで取得する。 |
| MacでPythonからアニメーションGIFを生成する環境設定 |
タグ別
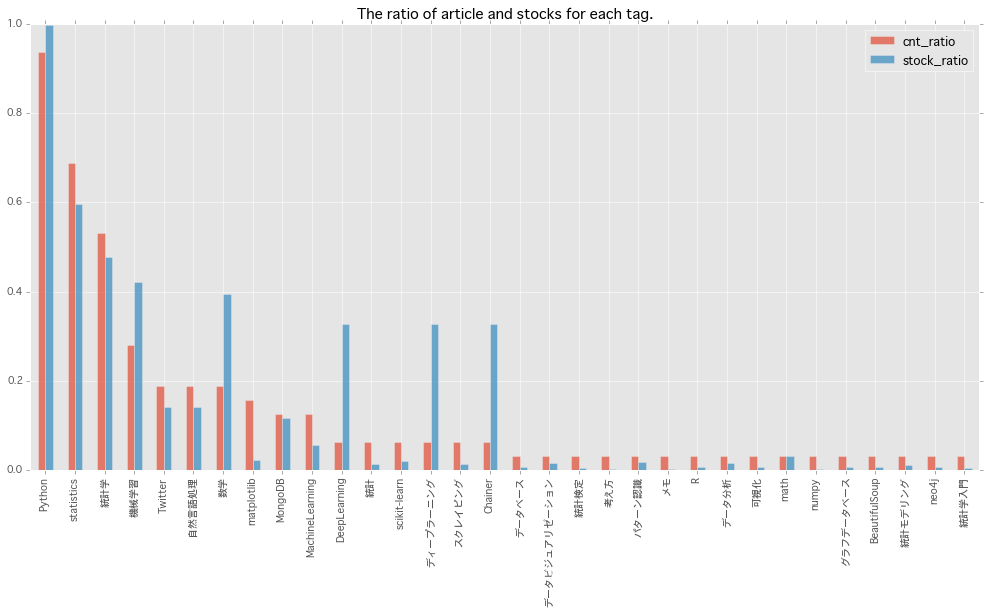
タグ別に見ていきます。基本的にPythonを使っているので、記事数のトップはPythonです。
ストック/記事 比で見ると、圧倒的に「ディープラーニング」「DeepLearning」「Chainer」が高いですね。昨今のディープラーニングの盛り上がりが見て取れます。
「数学」「機械学習」も、割とストック率が高そうです。
| タグ | 記事数 | ストック数 | ストック/記事 比 |
|---|---|---|---|
| Python | 30 | 2664 | 88.8 |
| statistics | 22 | 1589 | 72.2 |
| 統計学 | 17 | 1274 | 74.9 |
| 機械学習 | 9 | 1127 | 125.2 |
| 6 | 376 | 62.7 | |
| 自然言語処理 | 6 | 379 | 63.2 |
| 数学 | 6 | 1054 | 175.7 |
| matplotlib | 5 | 63 | 12.6 |
| MongoDB | 4 | 314 | 78.5 |
| MachineLearning | 4 | 148 | 37.0 |
| DeepLearning | 2 | 874 | 437.0 |
| 統計 | 2 | 35 | 17.5 |
| scikit-learn | 2 | 55 | 27.5 |
| ディープラーニング | 2 | 874 | 437.0 |
| スクレイピング | 2 | 37 | 18.5 |
| Chainer | 2 | 874 | 437.0 |
| データベース | 1 | 21 | 21.0 |
| データビジュアリゼーション | 1 | 45 | 45.0 |
| 統計検定 | 1 | 12 | 12.0 |
| 考え方 | 1 | 5 | 5.0 |
| パターン認識 | 1 | 50 | 50.0 |
| メモ | 1 | 5 | 5.0 |
| R | 1 | 16 | 16.0 |
| データ分析 | 1 | 40 | 40.0 |
| 可視化 | 1 | 20 | 20.0 |
| math | 1 | 82 | 82.0 |
| numpy | 1 | 8 | 8.0 |
| グラフデータベース | 1 | 21 | 21.0 |
| BeautifulSoup | 1 | 17 | 17.0 |
| 統計モデリング | 1 | 28 | 28.0 |
| neo4j | 1 | 21 | 21.0 |
| 統計学入門 | 1 | 11 | 11.0 |
グラフにしてみるとこんな感じです。
ストックユーザー
同じ方が結構ストックしてくれているのかなと想像していましたが、結構一見さんも多いようです。
下記の表は、よくストックしていただいている常連の方々です。ありがとうございます ![]()
| 順位 | ストック数 |
|---|---|
| 1 | 22 |
| 2 | 18 |
| 3 | 13 |
| 4 | 10 |
| 5 | 10 |
| 6 | 10 |
| 7 | 9 |
| 8 | 9 |
| 9 | 9 |
| 10 | 9 |
| 11 | 8 |
| 12 | 8 |
| 13 | 8 |
| 14 | 8 |
| 15 | 8 |
| 16 | 8 |
| 17 | 7 |
| 18 | 7 |
| 19 | 7 |
| 20 | 7 |
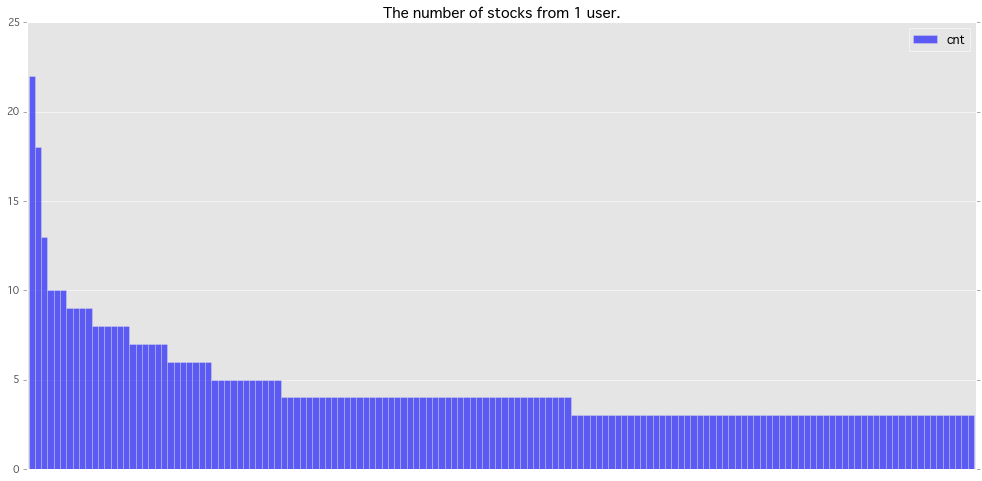
ストック数が多いユーザーさん上位150のグラフです。ユニークユーザー数は1771でした。
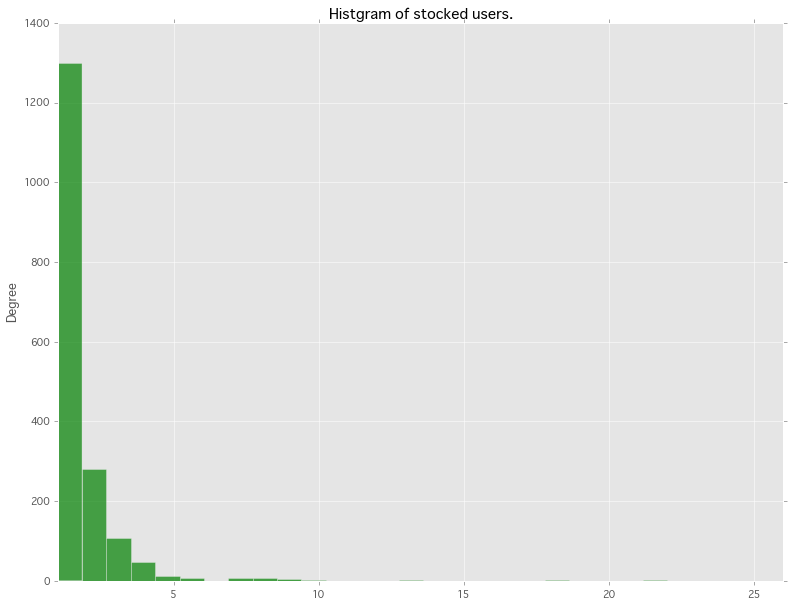
ストック数のヒストグラムです。想像以上に1〜5ストックに寄っています。リピート率が低い・・・ ![]()
今後はリピートしてもらえるような記事を書けるよう、精進します!
2.Pythonコードの解説
Qiita APIからデータを取得する
アクセストークンはQiitaの
[設定] → [アプリケーション] → [新しくトークンを発行する]
で発行できます。下記の'<アクセストークン>'に取得したトークンを設定してください。
%matplotlib inline
import requests
import json, sys
from collections import defaultdict
import numpy as np
import pandas as pd
import matplotlib.pyplot as plt
plt.style.use('ggplot')

key = '<アクセストークン>'
auth_str = 'Bearer %s'%(key)
headers = {'Authorization': auth_str}
cnt = 0
data_list = []
users = defaultdict(int)
ストックユーザーとストック数を取得するget_stockers関数を定義します。
# ------------------- 記事毎ストック数取得 -----------------------#
def get_stockers(_id):
    global headers
    url = 'https://qiita.com/api/v2/items/{}/stockers'.format(_id)
    cnt = 0
    _sum = 0
    while True:
        cnt += 1
        payload = {'page': cnt, 'per_page': 20}
        res = requests.get(url, params=payload, headers=headers)
        data = res.json()
        for d in data:
            users[d['id']] += 1
        num = len(data)
        if num == 0:
            break
        _sum += num

    return _sum
下記のループで自分の投稿した記事一式を取得し、それに紐づくストックユーザー情報を取得してリストに保持します。
# ------------------- 記事情報取得 -----------------------#
url = 'https://qiita.com/api/v2/authenticated_user/items'

while True:
    cnt += 1
    sys.stdout.write("{}, ".format(cnt))
    payload = {'page': cnt, 'per_page': 20}
    res = requests.get(url, params=payload, headers=headers)
    data = res.json()
    if len(data) == 0:
        break
    data_list.extend(data)

res = []
取得したデータから必要な情報を抜き出して整理します。また、プライベート記事(限定共有投稿)は除きます。
# ------------------- データの整形 -----------------------#
for i, d in enumerate(data_list):
    sys.stdout.write("{}, ".format(i))

    # プライベート記事は除く
    if d['private'] == True:
        continue

    article_info = {}
    for k in ['id', 'title', 'private', 'created_at', 'tags', 'url']:
        article_info[k] = d[k]

    article_info['stock'] = get_stockers(d['id'])
    res.append(article_info)
下記で記事一式とストック数、割合をそのままマークダウンのテーブルとして貼り付けられるような形で出力します。
sum_of_stocks = np.sum([r['stock'] for r in res]).astype(np.float32)

cum = 0
print "| ストック数 | 割合(%)|累積(%)| タイトル |"
print "|:----------:|:----------:|:----------:|:----------|"
for i in np.argsort([r['stock'] for r in res])[::-1]:
    r = res[i]
    ratio = r['stock']/sum_of_stocks*100
    cum += ratio
    print "|{0}|{1:.1f}|{2:.1f}|[{3}]({4})|".format(r['stock'], ratio, cum, r['title'].encode('utf-8'),r['url'])
タグ周りの集計をします。
# Tag集計
tag_cnt = defaultdict(int)
for r in res:
    for t in r['tags']:
        tag_cnt[t['name']] += 1

# タグ別ストック数
tag_stock_cnt = defaultdict(int)
for t in tag_cnt.keys():
    for r in res:
        for _t in r['tags']:
            if t == _t['name']:
                tag_stock_cnt[t] += r['stock']
tag_stock_dict = {}
for t, cnt in tag_stock_cnt.items():
    tag_stock_dict[t] = cnt

# DataFrameに入れられるよう加工
tag_list = []
ind_list = []
for k, t in tag_cnt.items():
    ind_list.append(k)
    tag_list.append((t , tag_stock_dict[k]))

# データフレームの生成
tag_list = np.array(tag_list)
df = pd.DataFrame(tag_list, index=ind_list, columns=['cnt', 'stocks'])

n = float(len(tag_cnt))
df['cnt_ratio'] = df['cnt']/n
df['stock_ratio'] = df['stocks']/sum_of_stocks

# タグ別ストック数とストック比の表示
df_tag = df.sort(columns='cnt', ascending=False)

print "| タグ | 記事数 | ストック数 | ストック/記事 比 |"
print "|:----------:|:----------:|:----------:|:----------:|"
for d in df_tag.iterrows():
    print "|[{0}](http://qiita.com/tags/{0})|{1}|{2}|{3:.1f}|".format(d[0].encode('utf-8'), int(d[1][0]), int(d[1][1]), d[1][1]/d[1][0])


# グラフ表示
df[['cnt_ratio','stock_ratio']].sort(columns='cnt_ratio', ascending=False).plot(kind="bar", figsize=(17, 8), alpha=0.7,
                                title="The ratio of article and stocks for each tag.")
次にユーザーに関数集計、表示を行います。
# User集計
id_list = []
cnt_list = []
for _id, cnt in users.items():
    id_list.append((_id, cnt))

df = pd.DataFrame(id_list, columns=["id","cnt"])

# 上位20名表示
print "| 順位 | ストック数 |"
print "|:----------:|:----------:|"
for i, d in enumerate(df.sort(columns="cnt", ascending=False)['cnt'][:20]):
    print "| {} | {} |".format(i+1, d)


# ストック数の多いユーザー順 棒グラフ
df.sort(columns="cnt", ascending=False)[:150].plot(kind="bar", figsize=(17, 8), alpha=0.6, xticks=[],
                                                   title="The number of stocks from 1 user.", width=1, color="blue")


# ストック数のヒストグラム
df['cnt'].plot(kind="hist", figsize=(13, 10), alpha=0.7, color="Green", bins=25, xlim=(1,26),
              title="Histgram of stocked users.")


