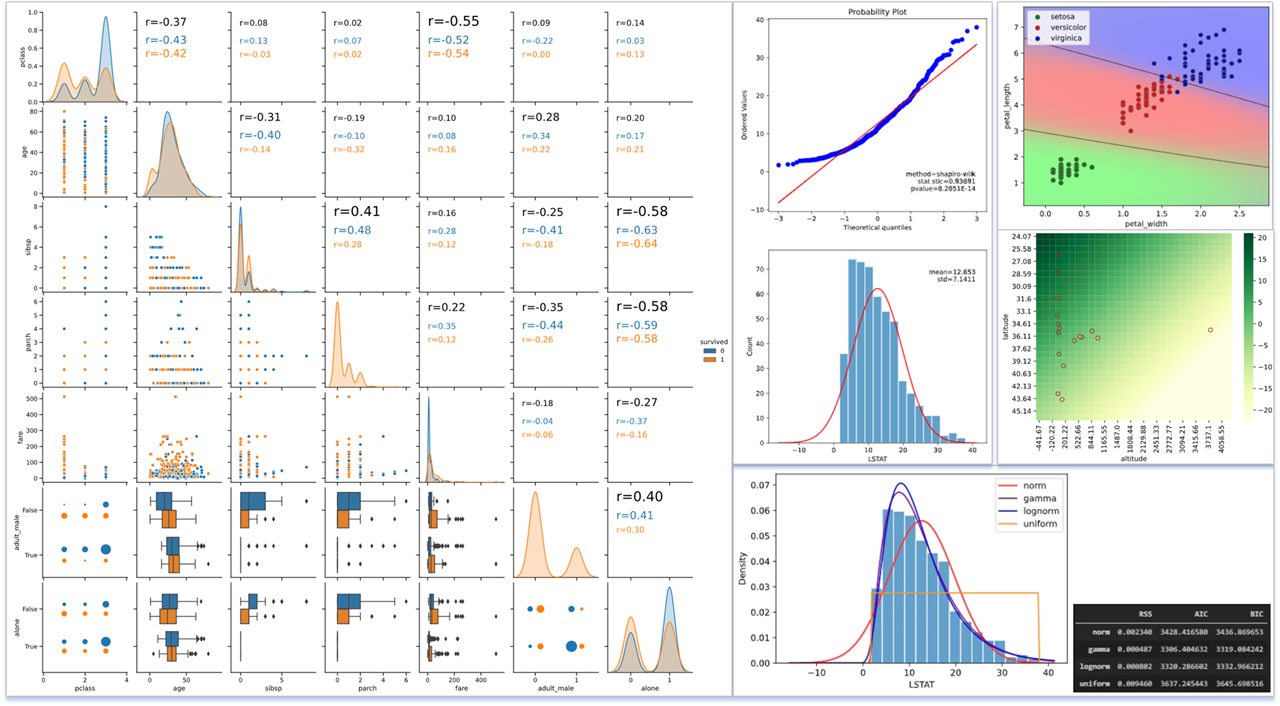
概要
データに基づき、自動でラベルを見分ける機械学習手法を**「分類」**と呼びます。
例えば、「大きさ」と「色」のデータから、「リンゴ」と「ミカン」を見分けるようなイメージです。
今回はPythonのグラフ描画ライブラリ「seaborn」をベースにして、
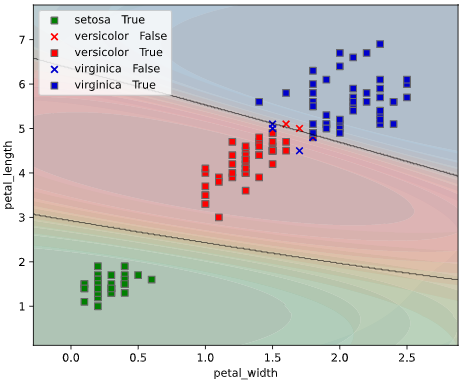
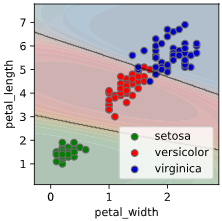
分類結果の解釈を強力にサポートするツールを作成しました!
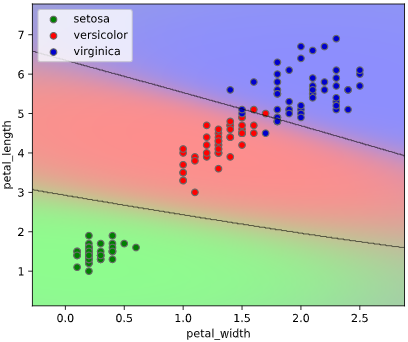
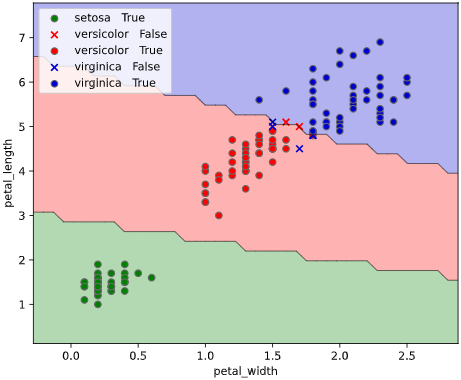
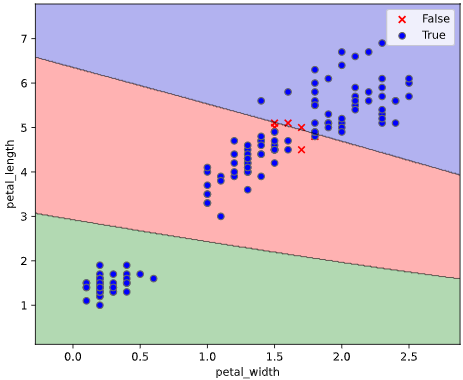
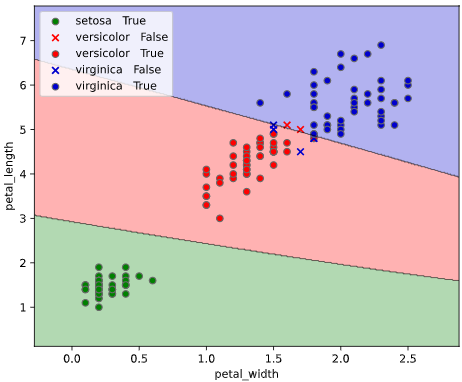
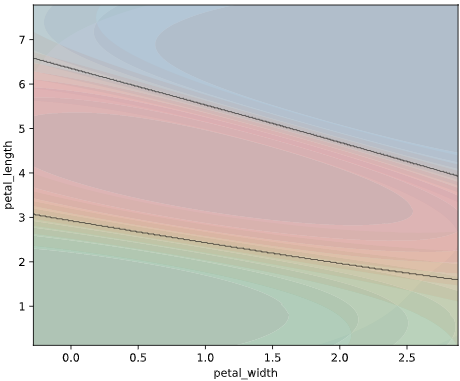
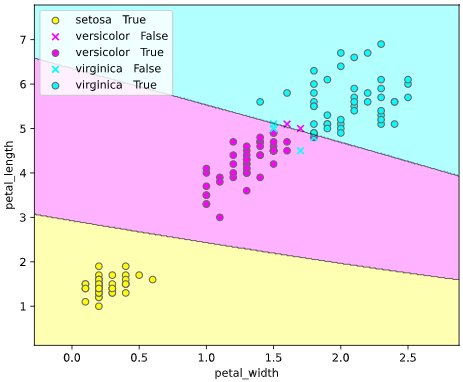
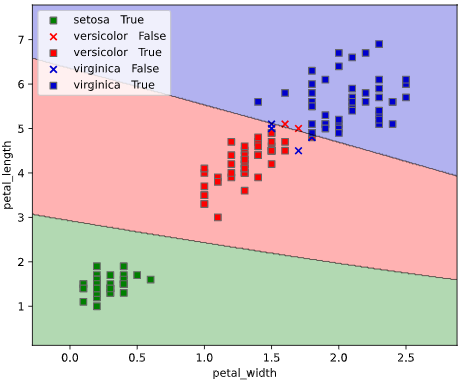
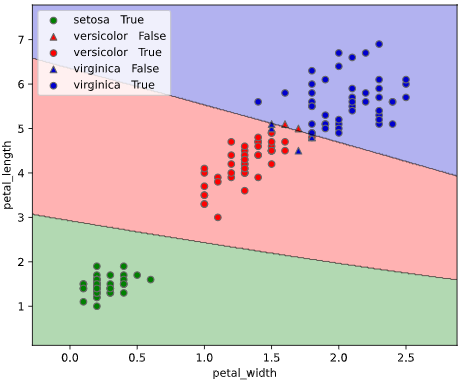
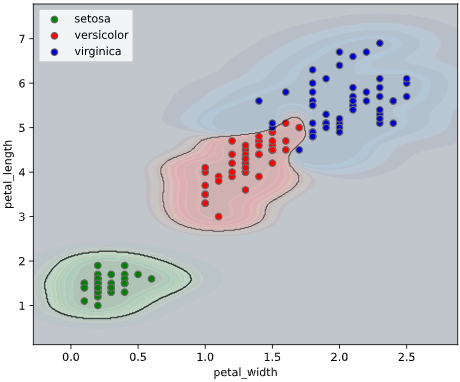
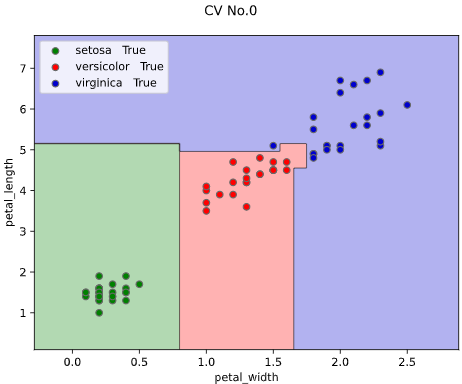
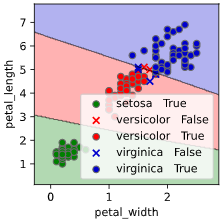
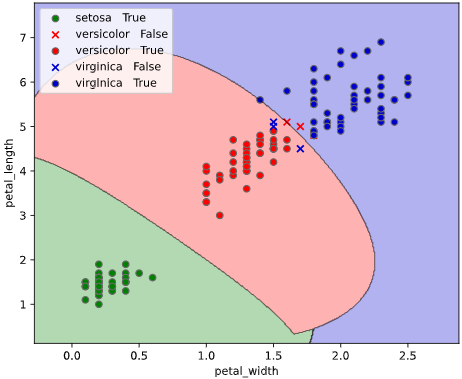
機能1. 決定境界の可視化
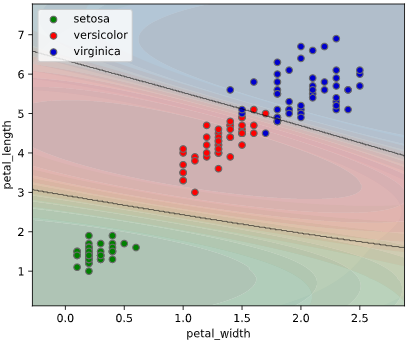
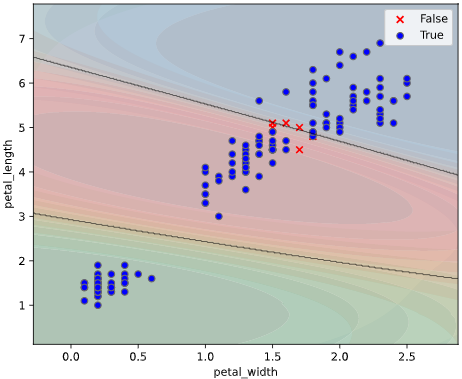
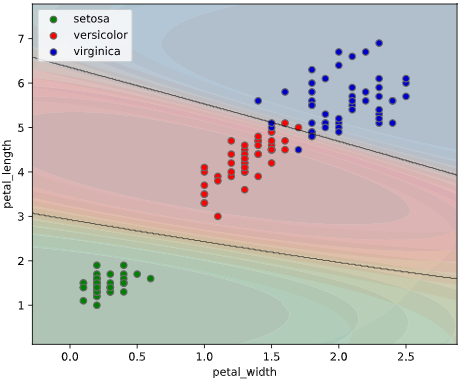
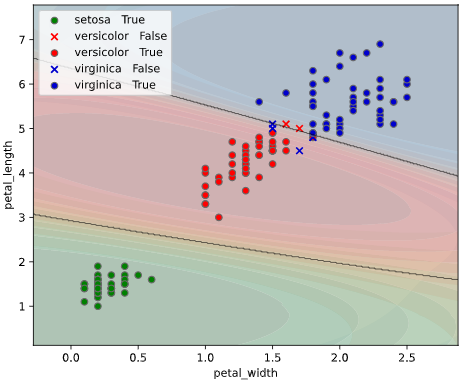
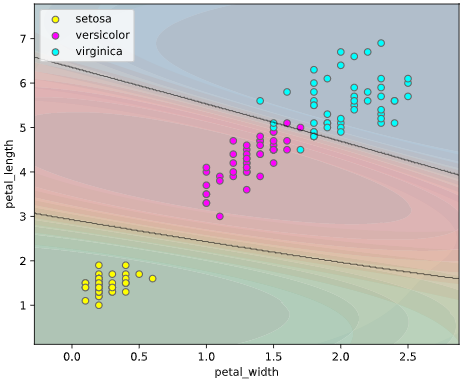
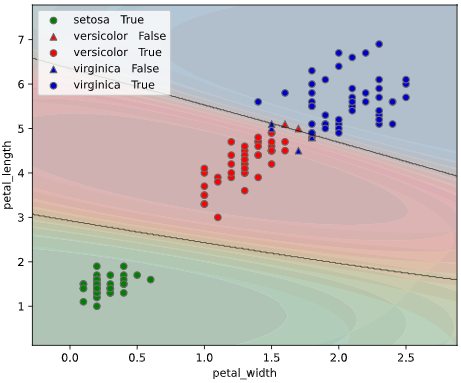
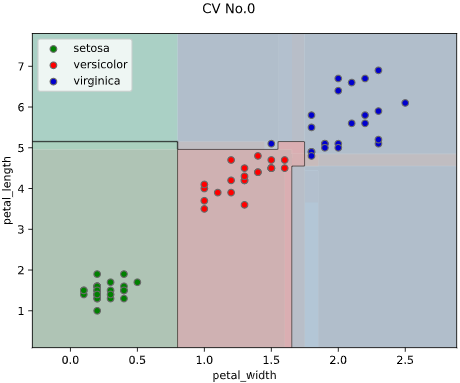
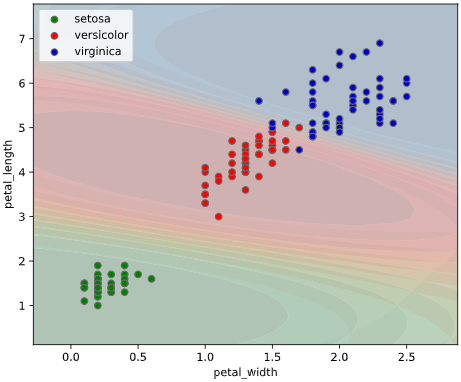
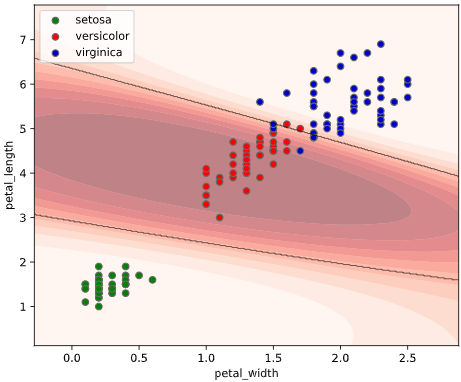
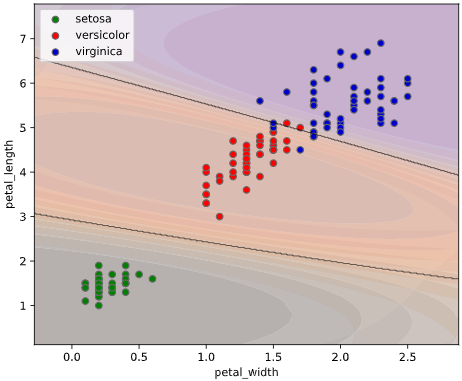
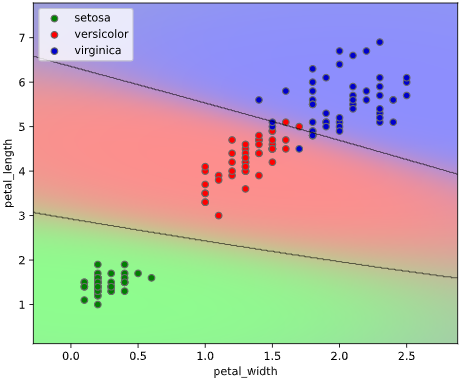
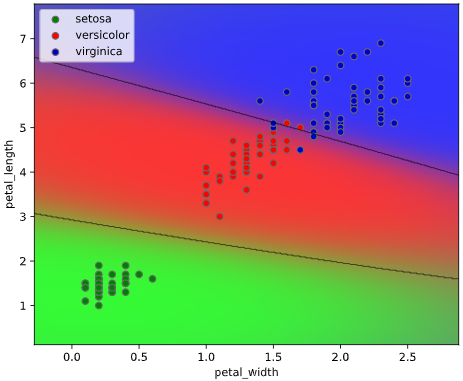
機能2. クラス確率の可視化
2021/7 修正:pipでインストールできるよう改良しました
下記コマンドでインストール可能となりました
$ pip install seaborn-analyzer
※関連ツールを1つの記事にまとめました!よければこちらもご覧ください
もしこのツールを良いと思われたら、GitHubにStar頂けるとありがたいです!
背景
分類は、データの基づき自動でラベル(「クラス」「目的変数」とも呼ぶ)を見分ける手法です

分類の手法として、画像や音声分野ではディープラーニングが主流となりつつありますが、
その他の分野では、解釈性の高さから特徴量を利用した機械学習が依然として多く使われています。
特徴量と可視化
**「特徴量」**とは、先ほどの果物データの例で挙げた「大きさ」「色」など、ものの特徴を表す数値データを表し、「説明変数」とも呼ばれます。
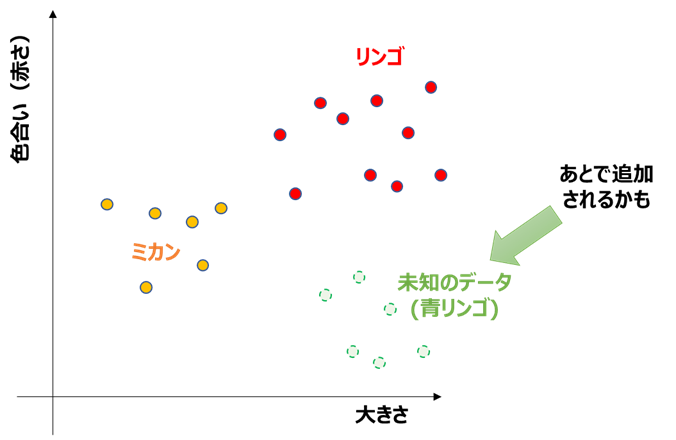
例えば、以下のように、「大きさ」「色(赤さ)」の特徴量に対し、リンゴとミカンを散布図(「特徴量空間」と呼ぶ)プロットすると、
・経験則との比較
→「リンゴの方がミカンより大きくて赤い」という経験と、特徴量空間上での位置関係が一致している
・未知のデータに対する判定予測
→リンゴとミカンの判定の境界(決定境界)特徴量空間上で可視化できれば、未知のデータ(例:青リンゴ)がどちらのクラスと判定されるか分かる
といった具合に、特徴量による可視化が結果解釈に貢献する事が分かります。
分析結果を他者に説明する際も、この解釈性の高さは助けとなるでしょう。
ユースケース
上記のように、特徴量による分類は解釈性の高さに魅力がありますが、
グラフでの描画ができないと、この解釈性の高さが半減してしまいます。
そのため本ツールでは
「描画できると嬉しいが実装するのが大変なグラフ」を、
簡単に描画できるようライブラリ化しました。
機械学習の定番であるiris(アヤメ)データセットで、ユースケースを見ていきます
ユースケース1:決定境界の可視化
上司「3種類のアヤメ"setosa", "versicolor", "virginica"を分類するモデルを作ってくれ」
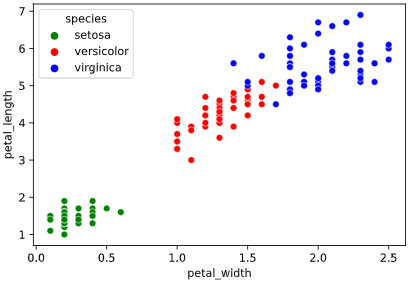
irisデータセットには、4種類の特徴量が含まれていますが、このうち2種類("petal_width", "petal_length")を使って可視化してみます
import seaborn as sns
iris = sns.load_dataset("iris")
sns.scatterplot(x='petal_width', y='petal_length', data=iris,
                hue='species', palette=['green', 'red', 'blue'])
ぼく「定番のサポートベクターマシン(SVM)を使って分類してみよう」
# %% サポートベクターマシン分類して性能評価指標算出
from sklearn.svm import SVC
from sklearn.metrics import accuracy_score, f1_score
X = iris[['petal_width', 'petal_length']].values  # 説明変数
y = iris['species'].values  # 目的変数(3種類のアヤメ種類)
clf = SVC()  # SVM分類用インスタンス
clf.fit(X, y)  # 学習
y_pred = clf.predict(X)  # 推論
print(f'Accuracy={accuracy_score(y, y_pred)}')  # 正解率を表示
print(f'F1={f1_score(y, y_pred, average="macro")}')  # F1-Macroを表示
> Accuracy=0.9533333333333334
> F1=0.9532912954992826
ぼく「SVMで分類したところ、性能を表す正解率が0.95、F1-Scoreは0.95と良好です」
上司「数値だけじゃ分かりにくいなあー!グラフで見やすくしてくれ!」
ぼく「どんなグラフにすればいいですか?」
上司「それを考えるのがキミの仕事だろう」
ぼく「ぴえん🥺」
ユースケース1の解決策
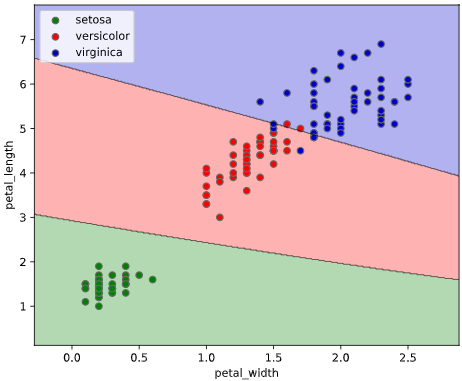
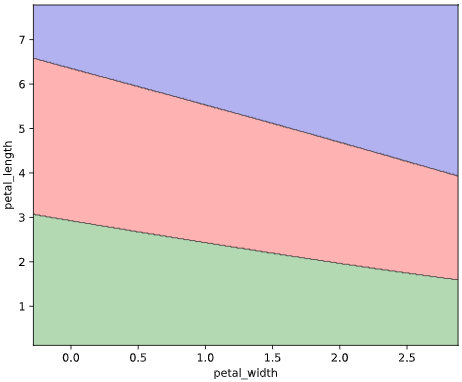
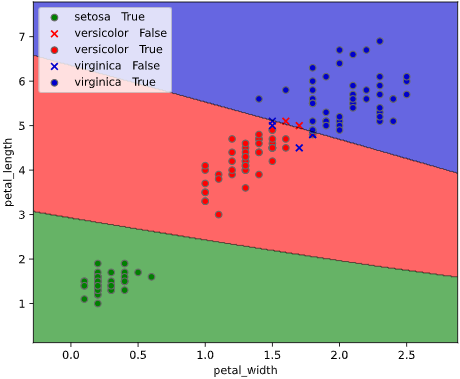
このようなとき、クラス判定の境目である決定境界をグラフ表示できると、上司も納得の可視化が実現できます。
決定境界の描画には、mlxtendというライブラリが便利です
from mlxtend.plotting import plot_decision_regions
import numpy as np
# 目的変数の配列を2次元に変換
y = y.reshape(len(y), 1)
# 目的変数をstr型→int型に変換
label_names = list(dict.fromkeys(y[:, 0]))
label_dict = dict(zip(label_names, range(len(label_names))))
y_int=np.vectorize(lambda x: label_dict[x])(y)
# 学習
clf.fit(X, y_int)
# mlxtendで決定境界可視化
plot_decision_regions(X, y_int[:, 0], clf=clf,
                      colors='green,red,blue')
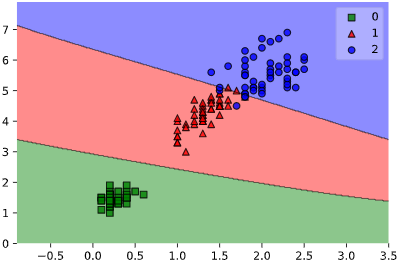
しかしこのmlxtend、目的変数(ラベルなので通常はstr型)をint型に変換しなければならず、入力データ形式(元々はPandasのDataFrameが多い)も2次元のndarrayしか受け付けないため、前処理に手間が掛かります
本ツールによる可視化方法
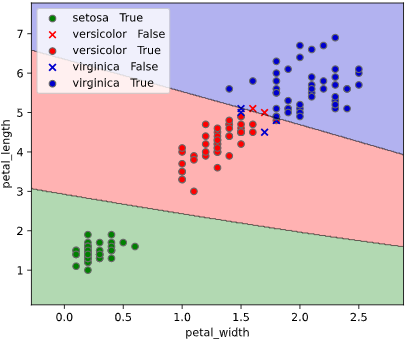
入力データ形式をPandasのDataFrame、目的変数がstr型(int型もOK)と、
オーソドックスな形式で簡単に決定境界を描画できる、
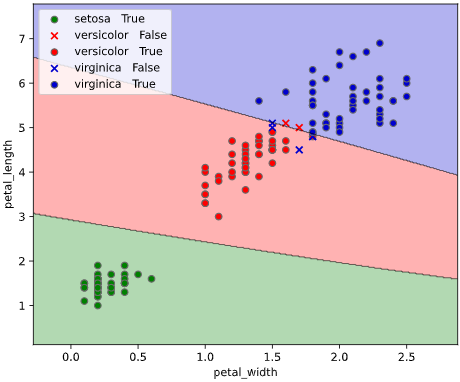
classplot.class_separator_plot()
というメソッドを作成しました。
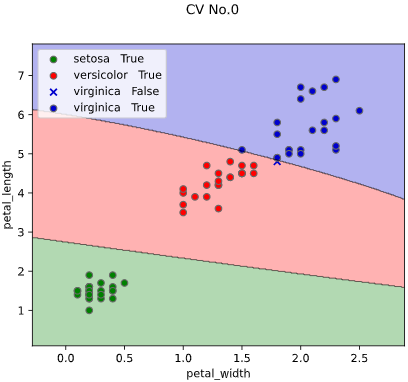
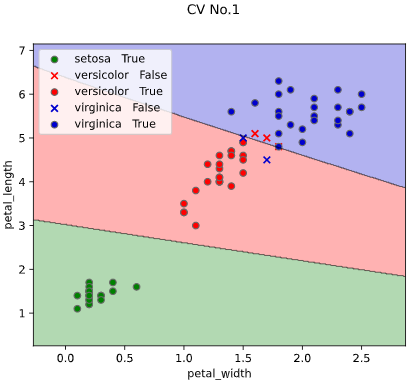
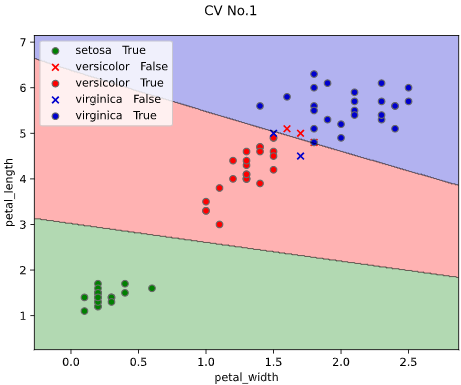
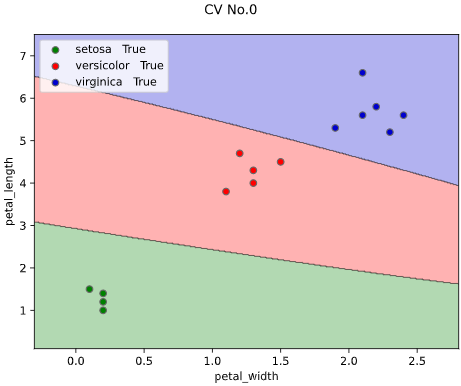
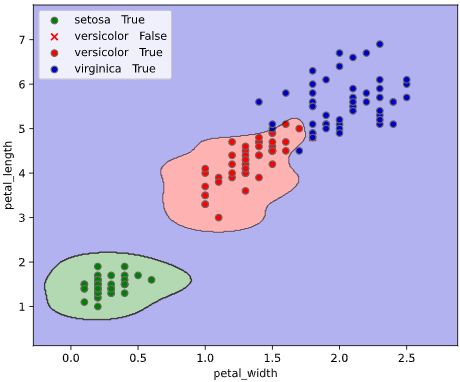
他の改善点として、正解ラベル(True)と不正解ラベル(False)の判別や、軸ラベル描画機能も追加しています。
from seaborn_analyzer import classplot
clf= SVC()
classplot.class_separator_plot(clf, ['petal_width', 'petal_length'], 'species', iris)
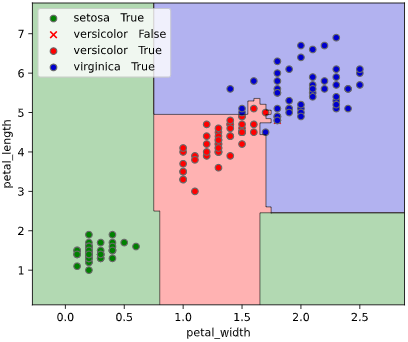
SVM以外でも、Scikit-learn APIに対応した分類モデルであれば適用可能です
from sklearn.ensemble import RandomForestClassifier
clf= RandomForestClassifier()
classplot.class_separator_plot(clf, ['petal_width', 'petal_length'], 'species', iris)
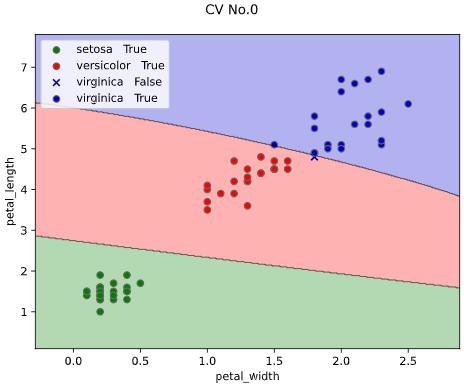
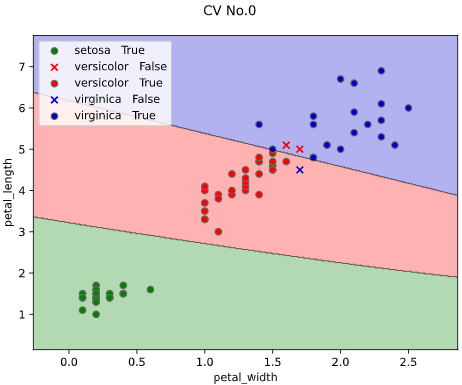
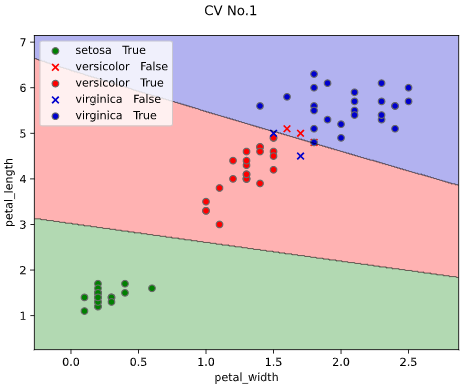
また、評価データと学習データを分けて評価したい方向けに、
クロスバリデーションでの描画にも対応しています。
※クロスバリデーションの指定法は後述します
classplot.class_separator_plot(clf, ['petal_width', 'petal_length'], 'species', iris,
                               cv=2, display_cv_indices = [0, 1])
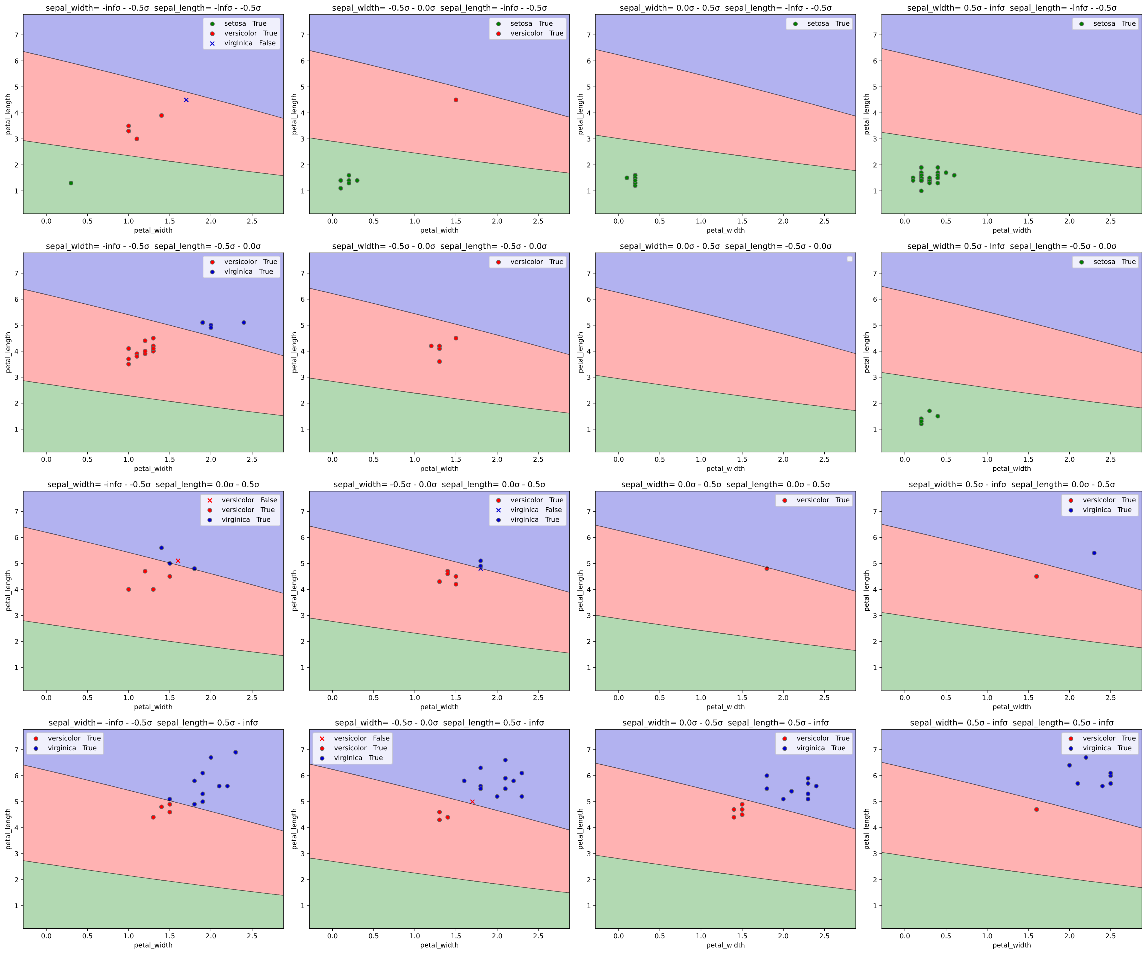
3次元特徴量の場合、3個目を一定間隔で分割し、分割された区間の中央値を使用した予測値で決定境界を、分割された区間内のデータで散布図をプロットします

4次元特徴量の場合も、縦横に分割してプロット可能です。プロットに時間が掛かるのでご注意ください
(chart_scale引数を2以上にすれば、解像度を落としてプロット時間を早くできます)
ユースケース2:クラス確率の可視化
ぼく「アヤメ分類の決定境界を可視化したグラフがこちらです」
上司「こういう1か0かの極端なグラフだと、判定の信頼性が分からんな。どの種類のアヤメである確率が何パーセント、みたいな可視化はできないの?」
ぼく「(この人理想が高いな‥)難しいかと思います」
上司「やる前からできないと言うのは熱意が足りないんじゃないかい?」
ぼく「ぴえん🥺」
上記のように**どのクラスに属する確率(以下「クラス確率」と呼びます)**が何パーセント、という情報が得られば、
分類の確信度として利用する事で、より定量的な判断ができます。
ユースケース2の解決策
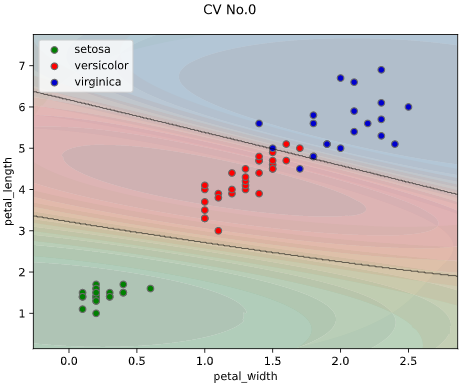
幸いなことに、Scikit-Learnの分類モデルには、クラス確率を計算するpredict_proba()というメソッドが実装されています。
predict_probaメソッドで求められる確率は、ロジスティク関数を使用した擬似的なもののようですが、今まで使用した限り、目安としてして使用するには十分な性能があると感じています。
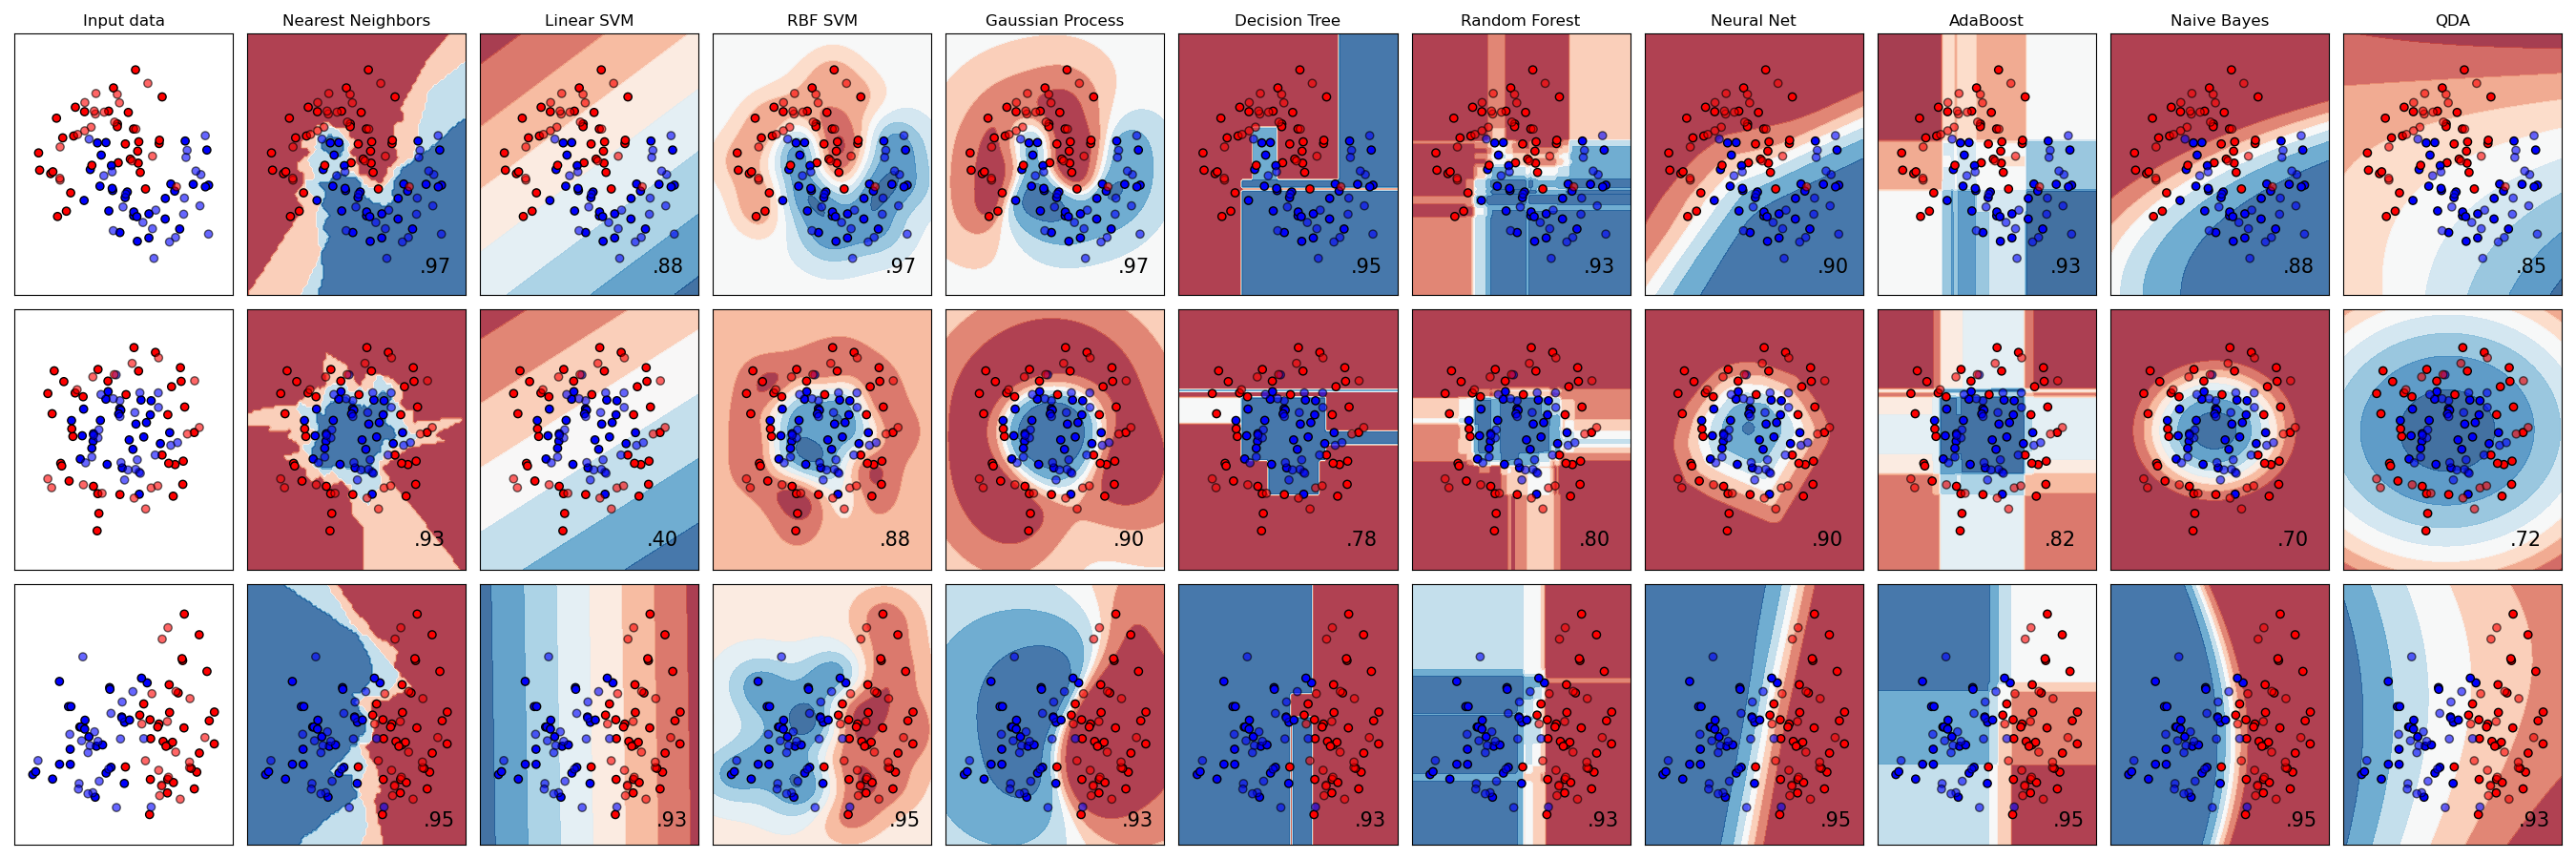
Scikit-Learn公式にも、Classifier Comparisonという可視化のサンプルコードが記載されていますが、2クラスのみの対応です。
本ツールによる可視化方法
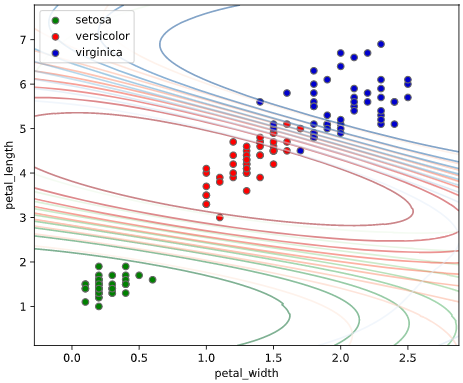
predict_proba()で算出したクラス確率を可視化するため、
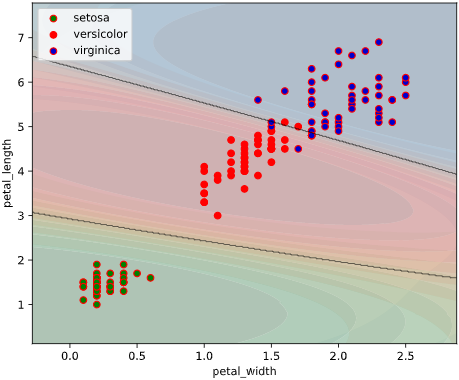
classplot.class_proba_plot()
というメソッドを作成しました。
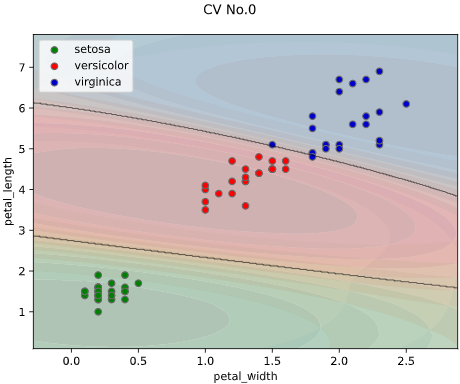
等高線表示(塗りつぶし選択可)、あるいはRGB画像表示の3種類の方法でグラフを描画できます
(RGB画像表示はこちらを参考にさせて頂きました)
clf = SVC(probability=True)  # SVMでpredict_probaを有効にするため、引数`probability`をTrueに
classplot.class_proba_plot(clf, ['petal_width', 'petal_length'], 'species', iris,
                           proba_type='contourf')
clf = SVC(probability=True)  # SVMでpredict_probaを有効にするため、引数`probability`をTrueに
classplot.class_proba_plot(clf, ['petal_width', 'petal_length'], 'species', iris,
                           proba_type='contour')
clf = SVC(probability=True)  # SVMでpredict_probaを有効にするため、引数`probability`をTrueに
classplot.class_proba_plot(clf, ['petal_width', 'petal_length'], 'species', iris,
                           proba_type='imshow')
| 等高線表示 | RGB画像表示 | |
|---|---|---|
| メリット | 4クラス以上でも使用可 | 表示が連続的で見やすい |
| デメリット | 等高線が重なって見辛いこともある | 3クラス以下でしか使用できない |
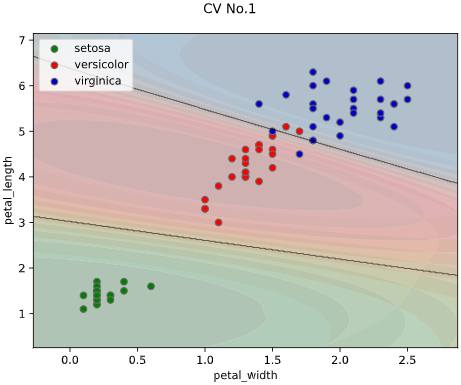
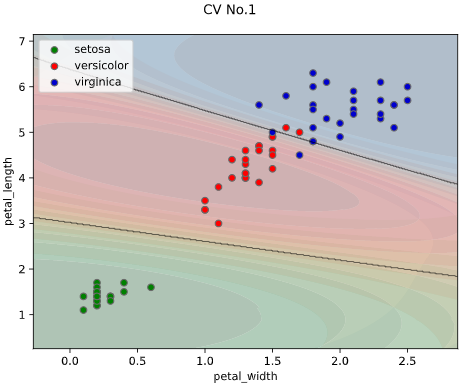
class_separator_plotと同様に、クロスバリデーションや3~4次元でのプロットにも対応しています。
使用に必要なもの
・Python本体 (動作確認時は3.9.4を使用)
・Matplotlibで表示可能な環境 (Jupyter等)
・下記ライブラリ (参考として動作確認時のライブラリバージョンも記載)
seaborn (0.11.1)
numpy (1.20.1)
pandas (1.2.2)
matplotlib (3.3.4)
scipy (1.6.0)
scikit-learn (0.24.1)
インストール方法
下記コマンドでインストール可能です
$ pip install seaborn-analyzer
※アンダースコアのpip install seaborn_analyzerでもインストール可能です。
インポート時はアンダースコアのimport seaborn_analyzerやfrom seaborn_analyzer
となるのでご注意ください
コード
モジュールcustom_scatter_plot.py内のクラスclassplotに、必要な処理をまとめました。
seabornのscatterplotぽいAPIで使用できるようにするため、クラスメソッドを利用しています。
各メソッドの解説
実行可能なメソッドは下記2個となります
| メソッド名 | 機能 |
|---|---|
| class_separator_plot | ユースケース1で紹介した、決定境界プロット |
| class_proba_plot | ユースケース2で紹介した、クラス確率プロット |
使用方法
class_separator_plotメソッド(決定境界)
実行元スクリプトと同フォルダにcustom_scatter_plot.pyを置き、下記のように実行します
# 参考としてirisデータを読み込んでいます
import seaborn as sns
iris = sns.load_dataset("iris")
# 分類モデルとしてサポートベクターマシンを使用
from sklearn.svm import SVC
clf = SVC()
# ここから実行部分(引数clf, x, y, dataの指定はMUST)
from seaborn_analyzer import classplot
classplot.class_separator_plot(clf, x=['petal_width', 'petal_length'], y='species', data=iris)
class_proba_plotメソッド(クラス確率)
実行元スクリプトと同フォルダにcustom_scatter_plot.pyを置き、下記のように実行します
# 参考としてirisデータを読み込んでいます
import seaborn as sns
iris = sns.load_dataset("iris")
# 分類モデルとしてサポートベクターマシンを使用(引数probability=True指定が必要)
from sklearn.svm import SVC
clf = SVC(probability=True)
# ここから実行部分(引数clf, x, y, dataの指定はMUST)
from seaborn_analyzer import classplot
classplot.class_proba_plot(clf, x=['petal_width', 'petal_length'], y='species', data=iris)
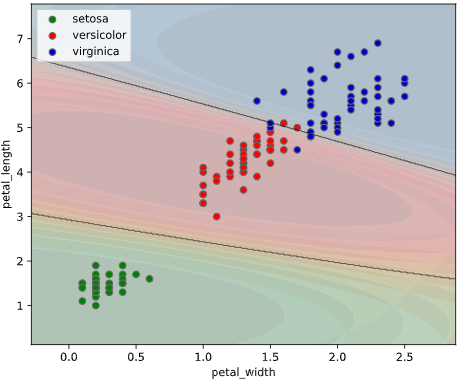
なお、SVM(SVC)のような一部のアルゴリズムでは、predict_probaの計算を有効にするために、引数probablity=Trueを指定する必要があることにご注意ください。
(predict_probaは乱数を利用しているので、毎回結果が変わるのが嫌な方はrandom_seed引数も指定してください)
引数の解説
メソッドごとに引数を解説します
オプション引数を指定しないとき
class_separator_plotメソッド(決定境界図)
下記の値が自動入力されます(clf, x, y, dataは入力必須)
(clf, x, y, data, x_chart = None,
pair_sigmarange = 1.5, pair_sigmainterval = 0.5, chart_extendsigma = 0.5, chart_scale = 1,
plot_scatter = 'class_error', rounddigit_x3 = 2,
scatter_colors = None, true_marker = 'o', false_marker = 'x',
cv=None, cv_seed=42, cv_group=None, display_cv_indices = 0,
clf_params=None, fit_params=None, subplot_kws=None, contourf_kws=None, scatter_kws=None)
・表示例
irisデータセット+サポートベクターマシンでの実行例
from seaborn_analyzer import classplot
clf = SVC()
classplot.class_separator_plot(clf, x=['petal_width', 'petal_length'], y='species', data=iris)
class_proba_plotメソッド(クラス確率図)
下記の値が自動入力されます(clf, x, y, dataは入力必須)
(clf, x, y, data, x_chart = None,
pair_sigmarange = 1.5, pair_sigmainterval = 0.5, chart_extendsigma = 0.5, chart_scale = 1,
plot_border = True, plot_scatter = 'class', rounddigit_x3 = 2,
proba_class = None, proba_cmap_dict = None, proba_type = 'contourf',
scatter_colors = None, true_marker = 'o', false_marker = 'x',
cv=None, cv_seed=42, cv_group=None, display_cv_indices = 0,
clf_params=None, fit_params=None, subplot_kws=None, contourf_kws=None, imshow_kws=None, scatter_kws=None)
・表示例
irisデータセット+サポートベクターマシンでの実行例
from seaborn_analyzer import classplot
clf = SVC()
classplot.class_proba_plot(clf, x=['petal_width', 'petal_length'], y='species', data=iris)
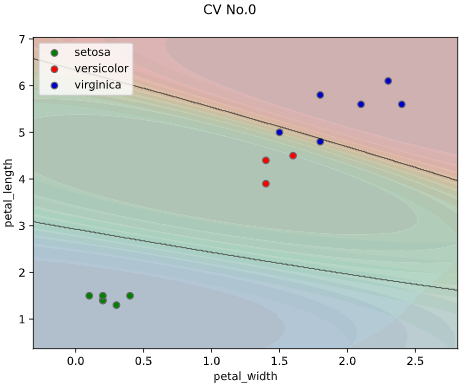
実行すると下図のようなグラフ(等高線表示でのクラス確率図)が表示されます

class_separator_plotメソッド、class_proba_plotメソッド共通引数
| 引数名 | 必須引数orオプション | 型 | デフォルト値 | 内容 |
|---|---|---|---|---|
| clf | 必須 | Scikit-learn API | - | 表示対象の分類モデル |
| x | 必須 | List[str] | - | 説明変数に指定するカラム名 |
| y | 必須 | str | - | 目的変数に指定するカラム名 |
| data | 必須 | pd.DataFrame | - | 入力するデータ (Pandasのデータフレーム) |
| x_chart | オプション | List[str] | None | 説明変数のうちグラフ表示対象のカラム名 |
| pair_sigmarange | オプション | float | 1.5 | グラフ非使用変数の分割範囲 |
| pair_sigmainterval | オプション | float | 0.5 | グラフ非使用変数の1枚あたり表示範囲 |
| chart_extendsigma | オプション | float | 0.5 | グラフ縦軸横軸の表示拡張範囲 |
| chart_scale | オプション | int | 1 | グラフの描画倍率 |
| plot_scatter | オプション | str | 'true' | 散布図の描画種類 |
| rounddigit_x3 | オプション | int | 2 | グラフ非使用軸の小数丸め桁数 |
| scatter_colors | オプション | List[str] | None | クラスごとのプロット色のリスト |
| true_marker | オプション | str | None | 正解クラスの散布図プロット形状 |
| false_marker | オプション | str | None | 不正解クラスの散布図プロット形状 |
| cv | オプション | int or sklearn.model_selection.* | None | クロスバリデーション分割法 |
| cv_seed | オプション | int | 42 | クロスバリデーションの乱数シード |
| cv_group | オプション | str | None | GroupKFold,LeaveOneGroupOut等のグルーピング対象カラム名 |
| display_cv_indices | オプション | int | 0 | 表示対象のクロスバリデーション番号 |
| clf_params | オプション | dict | None | 分類モデルに渡すパラメータ |
| fit_params | オプション | dict | None | 学習時のパラメータ |
| subplot_kws | オプション | dict | None | matplotlib.pyplot.subplotsに渡す引数 |
| contourf_kws | オプション | dict | None | グラフ表示用のmatplotlib.pyplot.contourf()に渡す引数 |
| scatter_kws | オプション | dict | None | 散布図用のmatplotlib.pyplot.scatter()に渡す引数 |
| オプション引数の詳細は後述します |
x_chart
3説明変数以上のときのみ有効なのでご注意ください
説明変数のうち、グラフの横軸と縦軸のカラム名を指定します。
指定しなかった説明変数を使い、
「pair_sigmarange引数 × 標準偏差」の範囲内で、
「pair_sigmainterval引数 × 標準偏差」ごとに一定間隔で図を分割します。
※Noneを指定すると、引数xで指定した説明変数の前から2個を自動指定します。
classplot.class_separator_plot(clf, x=['petal_width', 'petal_length', 'sepal_width'],
                               y='species', data=iris,
                               x_chart=['petal_width', 'petal_length'],
                               pair_sigmarange = 1.0, pair_sigmainterval = 0.5)
classplot.class_proba_plot(clf, x=['petal_width', 'petal_length', 'sepal_width'],
                           y='species', data=iris,
                           x_chart=['petal_width', 'petal_length'],
                           pair_sigmarange = 1.0, pair_sigmainterval = 0.5)
コツとしては、グラフ"内"で決定境界・クラス確率の変化が追いやすいよう、
目的変数に対する影響度が大きい説明変数を指定することです。
(影響度の大きさは、後述の「特徴量重要度」などで算出可能)
影響度の小さい説明変数を指定すると、グラフ"間"で決定境界やクラス確率が変化してしまい、
1枚のグラフ内で変化が追いにくくなってしまいます。
pair_sigmarange
3説明変数以上のときのみ有効なのでご注意ください
グラフ非使用変数(x_chartで未指定の説明変数)での図の分割範囲を指定します。
「pair_sigmarange引数 × 標準偏差」の範囲内で、
「pair_sigmainterval引数 × 標準偏差」ごとに一定間隔で図を分割します。
classplot.class_separator_plot(clf, x=['petal_width', 'petal_length', 'sepal_width'],
                               y='species', data=iris,
                               x_chart=['petal_width', 'petal_length'],
                               pair_sigmarange = 0.5, pair_sigmainterval = 0.5)
classplot.class_proba_plot(clf, x=['petal_width', 'petal_length', 'sepal_width'],
                           y='species', data=iris,
                           x_chart=['petal_width', 'petal_length'],
                           pair_sigmarange = 0.5, pair_sigmainterval = 0.5)
なお、表示される決定境界図あるいはクラス確率図におけるグラフ非使用変数の値は、
・pair_sigmarange範囲内の図:pair_sigmaintervalの中央値
・pair_sigmarange範囲外の図(最初の図):-pair_sigmarange - pair_sigmainterval/2
・pair_sigmarange範囲外の図(最後の図):pair_sigmarange + pair_sigmainterval/2
を使用します
pair_sigmainterval
3説明変数以上のときのみ有効なのでご注意ください
グラフ非使用変数(x_chartで未指定の説明変数)での図の分割範囲を指定します。
「pair_sigmarange引数 × 標準偏差」の範囲内で、
「pair_sigmainterval引数 × 標準偏差」ごとに一定間隔で図を分割します。
classplot.class_separator_plot(clf, x=['petal_width', 'petal_length', 'sepal_width'],
                               y='species', data=iris,
                               x_chart=['petal_width', 'petal_length'],
                               pair_sigmarange = 0.5, pair_sigmainterval = 0.25)
classplot.class_proba_plot(clf, x=['petal_width', 'petal_length', 'sepal_width'],
                           y='species', data=iris,
                           x_chart=['petal_width', 'petal_length'],
                           pair_sigmarange = 0.5, pair_sigmainterval = 0.25)
chart_extendsigma
グラフ縦軸横軸の表示拡張範囲を指定します。
散布図データの最大最小値に対し、「chart_extendsigma × 標準偏差」だけ縦軸横軸範囲を拡張します
classplot.class_separator_plot(clf, x=['petal_width', 'petal_length'],
                               y='species', data=iris,
                               chart_extendsigma=3.0)
classplot.class_proba_plot(clf, x=['petal_width', 'petal_length'],
                           y='species', data=iris,
                           chart_extendsigma=3.0)
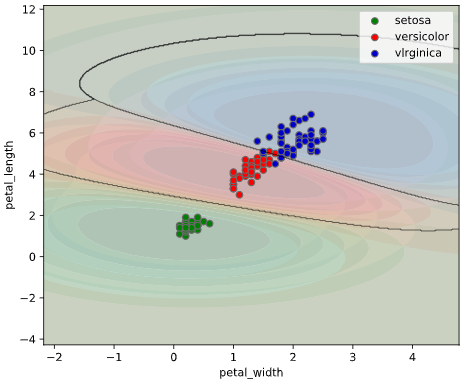
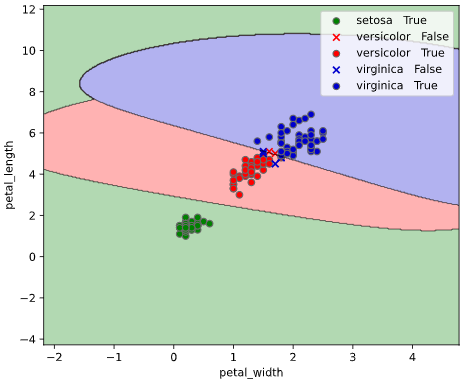
機械学習アルゴリズムは、データがない部分の境界が思わぬ形状をしている事も多いので、
特徴量空間上を範囲を広げて見る際に便利な引数です。
chart_scale
グラフの解像度倍率を指定します。
大きくなるほどグラフ表示が粗くなりますが、描画速度が速くなります
1を指定すると、グラフ全体をドット数(デフォルトでは432x288)で分割してデータ点作成し、
2を指定するとドット数の半分、3を指定すると1/3といった具合で解像度が粗くなります。
classplot.class_separator_plot(clf, x=['petal_width', 'petal_length'],
                               y='species', data=iris,
                               chart_scale=10)
classplot.class_proba_plot(clf, x=['petal_width', 'petal_length'],
                           y='species', data=iris,
                           chart_scale=20)
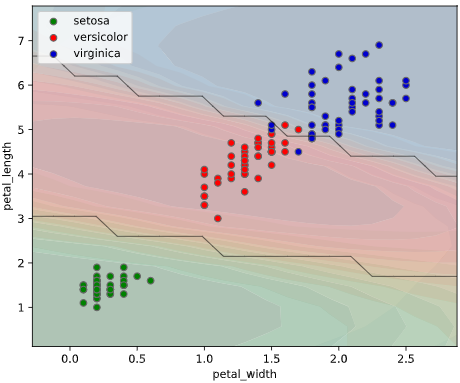
4を超えるとかなりジグザグな描画となってしまうため、3以下に抑えた方がよいかと思います。
plot_scatter
散布図の色分け・形状分け方法を選択します。下表から選択できます
| plot_scatterの指定値 | 散布図の色分け・形状分け方法 |
|---|---|
| 'error' | 正誤で形状分け |
| 'class' | クラスで色分け |
| 'class_error' | 正誤で形状分け&クラスで色分け |
| None | 散布図表示なし |
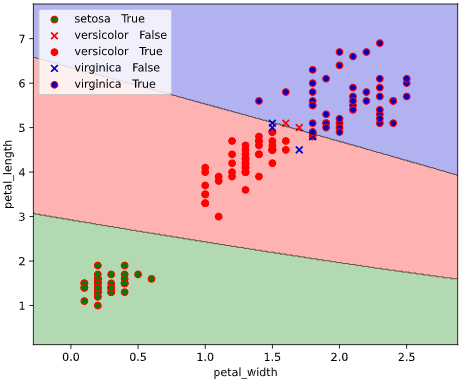
plot_scatter='error'のとき
正誤(予測クラス=実際のクラスのときTrue、そうでないときFalse)で散布図を色&形状分けします
classplot.class_separator_plot(clf, x=['petal_width', 'petal_length'],
                               y='species', data=iris,
                               plot_scatter='error')
classplot.class_proba_plot(clf, x=['petal_width', 'petal_length'],
                           y='species', data=iris,
                           plot_scatter='error')
plot_scatter='class'のとき
実際のクラスで散布図を色分けします(class_proba_plotのデフォルト設定)
classplot.class_separator_plot(clf, x=['petal_width', 'petal_length'],
                               y='species', data=iris,
                               plot_scatter='class')
classplot.class_proba_plot(clf, x=['petal_width', 'petal_length'],
                           y='species', data=iris,
                           plot_scatter='class')
plot_scatter='class_error'のとき
正誤で形状分け、実際のクラスで色分けします(class_separator_plotのデフォルト設定)
classplot.class_separator_plot(clf, x=['petal_width', 'petal_length'],
                               y='species', data=iris,
                               plot_scatter='class')
classplot.class_proba_plot(clf, x=['petal_width', 'petal_length'],
                           y='species', data=iris,
                           plot_scatter='class')
plot_scatter=Noneのとき
散布図をプロットしません
classplot.class_separator_plot(clf, x=['petal_width', 'petal_length'],
                               y='species', data=iris,
                               plot_scatter=None)
classplot.class_proba_plot(clf, x=['petal_width', 'petal_length'],
                           y='species', data=iris,
                           plot_scatter=None)
rounddigit_x3
3説明変数以上のときのみ有効なのでご注意ください
グラフ非表示変数の小数丸め桁数の小数丸め桁数を指定します
(各グラフの上に表示される非表示変数の範囲表示の桁数です)
classplot.class_separator_plot(clf, x=['petal_width', 'petal_length', 'sepal_width'],
                               y='species', data=iris,
                               x_chart=['petal_width', 'petal_length'],
                               pair_sigmarange=0.5, pair_sigmainterval=0.5,
                               rounddigit_x3=4)
classplot.class_proba_plot(clf, x=['petal_width', 'petal_length', 'sepal_width'],
                           y='species', data=iris,
                           x_chart=['petal_width', 'petal_length'],
                           pair_sigmarange=0.5, pair_sigmainterval=0.5)
scatter_colors
クラスごとの散布図プロット色をリストで指定します。
class_separator_plotメソッドでは、決定境界の塗りつぶし色もこの指定に準拠します。
class_proba_plotメソッドでのクラス確率塗りつぶし色指定は、別途proba_cmap_dict引数で指定する必要があるので注意してください。
また、クラスの数とリストの要素数が一致する必要があります。
指定できる色の名称はmatplotlibに準拠します
デフォルトでは、緑('green') → 赤('red') → 青('blue') → 茶('brown')‥の順で指定されています。
classplot.class_separator_plot(clf, x=['petal_width', 'petal_length'],
                               y='species', data=iris,
                               scatter_colors=['yellow', 'magenta', 'cyan'])
classplot.class_proba_plot(clf, x=['petal_width', 'petal_length'],
                           y='species', data=iris,
                           scatter_colors=['yellow', 'magenta', 'cyan'])
true_marker
plot_scatter引数に"error"または"class_error"を指定しているとき、
本引数で正解データ(予測ラベル=実際のラベル)の散布図描画形状を指定します。
指定できるマーカーの名称はmatplotlibに準拠します
classplot.class_separator_plot(clf, x=['petal_width', 'petal_length'],
                               y='species', data=iris,
                               true_marker='s')
classplot.class_proba_plot(clf, x=['petal_width', 'petal_length'],
                           y='species', data=iris,
                           plot_scatter='class_error',
                           true_marker='s')
false_marker
plot_scatter引数に"error"または"class_error"を指定しているとき、
本引数で不正解データ(予測ラベル≠実際のラベル)の散布図描画形状を指定します。
指定できるマーカーの名称はmatplotlibに準拠します
classplot.class_separator_plot(clf, x=['petal_width', 'petal_length'],
                               y='species', data=iris,
                               false_marker='^')
classplot.class_proba_plot(clf, x=['petal_width', 'petal_length'],
                           y='species', data=iris,
                           plot_scatter='class_error',
                           false_marker='^')
cv
クロスバリデーション分割法を指定します。
数値を指定すれば、指定した数に応じて通常のK-Foldで分割します。
デフォルトではクロスバリデーションの最初のセクション(CV_Number=0)の結果のみがプロットされます。
classplot.class_separator_plot(clf, x=['petal_width', 'petal_length'],
                               y='species', data=iris,
                               cv=2)
classplot.class_proba_plot(clf, x=['petal_width', 'petal_length'],
                           y='species', data=iris,
                           cv=2)
全てのセクションの結果をプロットしたい場合、引数display_cv_indicesでCV_Numberをリスト指定します
classplot.class_separator_plot(clf, x=['petal_width', 'petal_length'],
                               y='species', data=iris,
                               cv=2, display_cv_indices = [0, 1])
classplot.class_proba_plot(clf, x=['petal_width', 'petal_length'],
                           y='species', data=iris,
                           cv=2, display_cv_indices = [0, 1])
Scikit-LearnのAPIに対応していれば、ShuffleSplit、GroupKFoldなどの特殊な分割法にも対応しています。
from sklearn.model_selection import ShuffleSplit
classplot.class_separator_plot(clf, x=['petal_width', 'petal_length'],
                               y='species', data=iris,
                               cv=ShuffleSplit(n_splits=2, test_size=0.1))
from sklearn.model_selection import ShuffleSplit
classplot.class_proba_plot(clf, x=['petal_width', 'petal_length'],
                           y='species', data=iris,
                           cv=ShuffleSplit(n_splits=2, test_size=0.1))
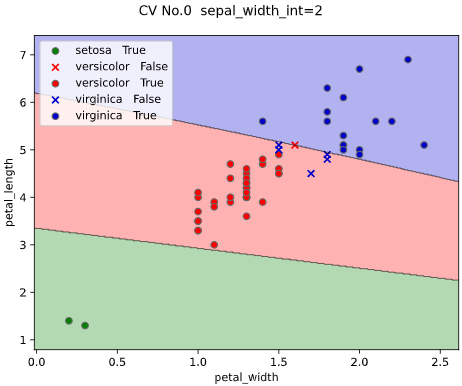
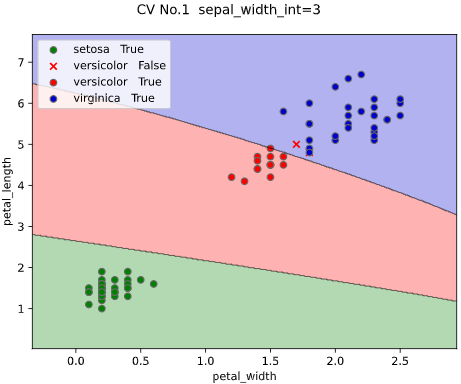
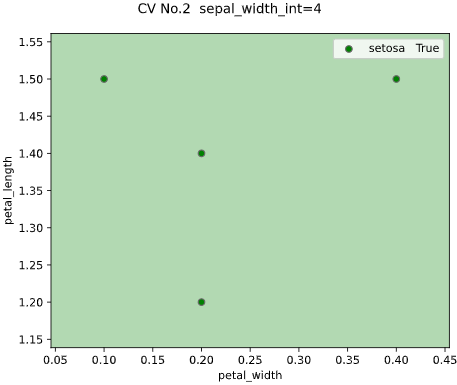
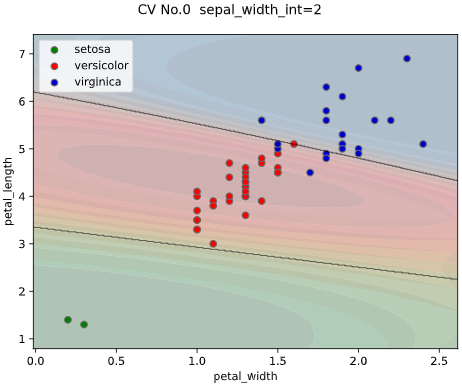
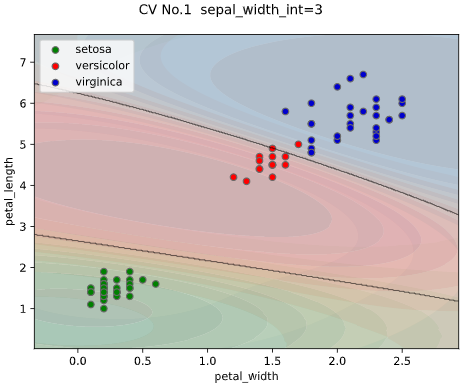
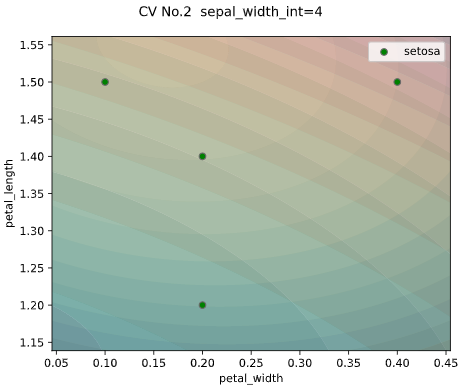
GroupKFold、LeaveOneGroupOutなどのグルーピング系の分割法では、引数cv_groupで指定したグループを分割に使用します。
from sklearn.model_selection import LeaveOneGroupOut
# グルーピング用にsepal_widthを整数に丸める
iris['sepal_width_int'] = iris['sepal_width'].apply(lambda x: int(x))
classplot.class_separator_plot(clf, x=['petal_width', 'petal_length'],
                               y='species', data=iris,
                               cv=LeaveOneGroupOut(), cv_group='sepal_width_int',
                               display_cv_indices=[0, 1, 2])
from sklearn.model_selection import LeaveOneGroupOut
# グルーピング用にsepal_widthを整数に丸める
iris['sepal_width_int'] = iris['sepal_width'].apply(lambda x: int(x))
classplot.class_proba_plot(clf, x=['petal_width', 'petal_length'],
                           y='species', data=iris,
                           cv=ShuffleSplit(n_splits=2, test_size=0.1))
cv_seed
引数cvで数値指定した際の、クロスバリデーション指定時の乱数シードを指定します
(デフォルトでは乱数シード42を使用しています)
classplot.class_separator_plot(clf, x=['petal_width', 'petal_length'],
                               y='species', data=iris,
                               cv=2, cv_seed=43)
classplot.class_proba_plot(clf, x=['petal_width', 'petal_length'],
                           y='species', data=iris,
                           cv=2, cv_seed=43)
display_cv_indices
クロスバリデーション分割時に、表示するクロスバリデーション番号を指定します。
classplot.class_separator_plot(clf, x=['petal_width', 'petal_length'],
                               y='species', data=iris,
                               cv=2, display_cv_indices=1)
classplot.class_proba_plot(clf, x=['petal_width', 'petal_length'],
                           y='species', data=iris,
                           cv=2, display_cv_indices=1)
前述のように、リスト指定で複数のクロスバリデーション番号でのグラフを同時表示させることも可能です
clf_params
分類モデルに渡すパラメータをdict指定します。
理想的には、チューニング後のパラメータを渡すのが望ましいです。
(未指定ならば、scikit-learnのデフォルトパラメータを使用します)
下の例では、SVMのパラメータCおよびgammaを大きくして過学習寄りに調整しています。
(SVMのパラメータはこちらの記事参照)
classplot.class_separator_plot(clf, x=['petal_width', 'petal_length'],
                               y='species', data=iris,
                               clf_params={'C': 10,
                                           'gamma': 10})
classplot.class_proba_plot(clf, x=['petal_width', 'petal_length'],
                           y='species', data=iris,
                           clf_params={'C': 10,
                                       'gamma': 10})
fit_params
学習時のfitメソッドに渡すパラメータをdict指定します。
XGBoostやLightGBMにおけるearly_stoppling_round, verboseパラメータなどを想定しています。
from xgboost import XGBClassifier
clf = XGBClassifier()
classplot.class_separator_plot(clf, x=['petal_width', 'petal_length'],
                               y='species', data=iris,
                               cv=2,
                               fit_params={'early_stopping_rounds': 20,
                                           'eval_set': [(iris[['petal_width', 'petal_length']].values, iris['species'].values)],
                                           'verbose': 1})
from xgboost import XGBClassifier
clf = XGBClassifier()
classplot.class_proba_plot(clf, x=['petal_width', 'petal_length'],
                           y='species', data=iris,
                           cv=2,
                           fit_params={'early_stopping_rounds': 20,
                                       'eval_set': [(iris[['petal_width', 'petal_length']].values, iris['species'].values)],
                                       'verbose': 1})
subplot_kws
画像作成用メソッドmatplotlib.pyplot.subplotsに渡す引数をdict指定できます。
渡せる引数は、こちらやこちらをご参照ください
下の例のように、画像のサイズ('figsize'、デフォルトは画像1枚あたり6×5インチ)を変えたいときなどに便利です
classplot.class_separator_plot(clf, x=['petal_width', 'petal_length'],
                               y='species', data=iris,
                               subplot_kws={'figsize': (3, 3)})
classplot.class_proba_plot(clf, x=['petal_width', 'petal_length'],
                           y='species', data=iris,
                           subplot_kws={'figsize': (3, 3)})
contourf_kws
決定境界およびクラス確率図(等高線)描画用メソッドmatplotlib.pyplot.contourfに渡す引数をdict指定できます。
クラス確率図(RGB画像)は、別のメソッドmatplotlib.pyplot.imshowを利用しているので、対応する引数imshow_kwsに引数を渡してください。
※色指定用の引数scatter_colors&proba_cmap_dictと重複するので、色指定colors,cmapは渡さないでください
※範囲拡張用の引数chart_extendsigmaと重複するので、範囲指定extendは渡さないでください
渡せる引数は、こちらをご参照ください
(proba_type='contour'のときは、matplotlib.pyplot.contourメソッドなのでこちらご参照ください
classplot.class_separator_plot(clf, x=['petal_width', 'petal_length'],
                               y='species', data=iris,
                               contourf_kws={'alpha': 0.6})
classplot.class_proba_plot(clf, x=['petal_width', 'petal_length'],
                           y='species', data=iris,
                           contourf_kws={'alpha': 0.9})
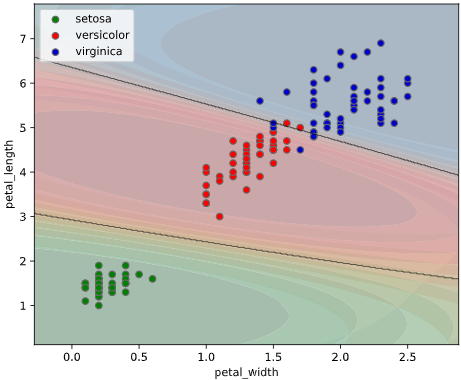
※等高線表示のalphaは各色の濃さを揃えるために補正(補正後alpha = alpha)を掛けているため、alphaを大きくしてもあまり見かけは変化しません。
scatter_kws
散布図描画用メソッドmatplotlib.pyplot.scatter()に渡す引数をdict指定できます。
渡せる引数は、こちらをご参照ください
※色指定用の引数scatter_colorsと重複するので、色指定colors,cmapは渡さないでください
※形状指定用の引数true_marker&false_markerと重複するので、plot_scatter="error"または"class_error"のとき、形状指定markerは渡さないでください。
classplot.class_separator_plot(clf, x=['petal_width', 'petal_length'],
                               y='species', data=iris,
                               scatter_kws={'edgecolors': 'red'})
classplot.class_proba_plot(clf, x=['petal_width', 'petal_length'],
                           y='species', data=iris,
                           scatter_kws={'edgecolors': 'red'})
class_proba_plotメソッド固有の引数
| 引数名 | 必須引数orオプション | 型 | デフォルト値 | 内容 |
|---|---|---|---|---|
| plot_border | オプション | bool | True | 決定境界線の描画有無 |
| proba_class | オプション | str or List[str] | None | 確率表示対象のクラス名 |
| proba_cmap_dict | オプション | Dict[str, str] | None | クラス確率図のカラーマップ(dict指定) |
| proba_type | オプション | str | 'contourf' | クラス確率図の描画種類 (等高線'contourf','contour' or RGB画像'imshow') |
| imshow_kws | オプション | Dict | None | RGB画像描画時のmatplotlib.pyplot.imshow()に渡す引数 |
plot_border
決定境界線の描画有無を指定します
classplot.class_proba_plot(clf, x=['petal_width', 'petal_length'],
                           y='species', data=iris,
                           plot_border=True)
classplot.class_proba_plot(clf, x=['petal_width', 'petal_length'],
                           y='species', data=iris,
                           plot_border=False)
proba_class
確率表示対象のクラス名を指定します。
デフォルトでは全てのクラスを表示対象としているので、一部のクラス確率のみ表示したい場合に使用します。
classplot.class_proba_plot(clf, x=['petal_width', 'petal_length'],
                           y='species', data=iris,
                           proba_class='versicolor')
classplot.class_proba_plot(clf, x=['petal_width', 'petal_length'],
                           y='species', data=iris,
                           proba_class=['setosa', 'virginica'])
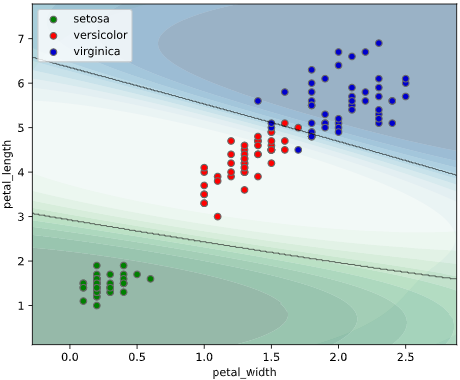
クラス数が増えると等高線が重なって見辛くなるので、この引数で表示クラスを絞ると、見やすくなるかと思います。
proba_cmap_dict
クラス確率図のカラーマップを指定します。
クラス名をキー、カラーマップを値としたDict形式で指定する必要があります。
指定できるカラーマップ名は、こちらをご参照ください
デフォルトでは、緑('Greens') → 赤('Reds') → 青('Blues') → 茶('YlOrBr')‥の順で指定(散布図のデフォルト色に合わせる)されています。
classplot.class_proba_plot(clf, x=['petal_width', 'petal_length'],
                           y='species', data=iris,
                           proba_cmap_dict={'setosa':'Greys',
                                            'versicolor':'Oranges',
                                            'virginica':'Purples'})
proba_type
クラス確率図の描画種類を指定します。
'imshow'を指定するとRGB画像で、
'contourf'を指定すると塗りつぶしありの等高線
'contour'を指定すると塗りつぶしなしの等高線
で表示されます。
classplot.class_proba_plot(clf, x=['petal_width', 'petal_length'],
                           y='species', data=iris,
                           proba_type='imshow')
classplot.class_proba_plot(clf, x=['petal_width', 'petal_length'],
                           y='species', data=iris,
                           proba_type='contourf')
classplot.class_proba_plot(clf, x=['petal_width', 'petal_length'],
                           y='species', data=iris,
                           plot_border=False,
                           proba_type='contour')
imshow_kws
RGB画像描画用メソッドmatplotlib.pyplot.imshow()に渡す引数をdict指定できます。
proba_type='imshow'のときのみ有効な引数です。
渡せる引数は、こちらをご参照ください
※色指定はGBR固定なので、、色指定cmapは渡さないでください
※範囲拡張用の引数chart_extendsigmaと重複するので、範囲指定extendは渡さないでください
classplot.class_proba_plot(clf, x=['petal_width', 'petal_length'],
                           y='species', data=iris,
                           proba_type='imshow',
                           imshow_kws={'alpha':0.8})
補足:パイプライン処理への対応
標準化等の前処理と組み合わせたモデルを構築したいとき、Scikit-Learnではパイプライン処理がよく使われますが、本ツールの入力にもパイプライン処理が適用できます。
本記事の例ではSVMによる分類の例を使用していますが、SVMは距離に基づくアルゴリズムのため、本来は標準化を前処理に加えた方が良いです。実装例を下記します
from sklearn.svm import SVC
from sklearn.pipeline import Pipeline
from sklearn.preprocessing import StandardScaler

pipe = Pipeline([("scaler", StandardScaler()), ("svc", SVC())])  # 標準化+SVMパイプライン
classplot.class_separator_plot(pipe, x=['petal_width', 'petal_length'],
                               y='species', data=iris)
余談:その他の便利な分類可視化テクニック
他のライブラリで簡単に実装できるため本ツールでは触れていませんが、分類の可視化には、以下のようなテクニックもよく使われています。
特徴量重要度(Feature Importance)
Random ForestやXGBoost、LightGBMなどの決定木系の分類アルゴリズムには、
目的変数の予測に対する、各説明変数の寄与度を定量的にランク付けした、
**「特徴量重要度 (feature importance)」**と呼ばれる指標が存在します。
from xgboost import XGBClassifier
import matplotlib.pyplot as plt
# モデルの学習
clf = XGBClassifier()
features = ['petal_width', 'petal_length', 'sepal_width', 'sepal_length']
X = iris[features].values
y = iris['species'].values
clf.fit(X, y)
# 特徴量重要度の取得と可視化
importances = list(clf.feature_importances_)
plt.barh(features, importances)
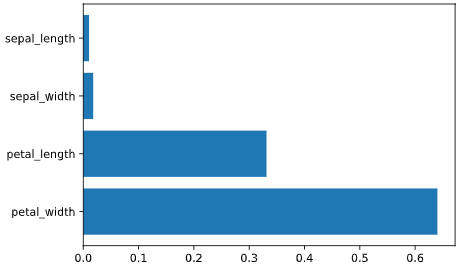
上図のように、petal_width, petal_lengthの寄与度が高い事が分かります。
この指標は**「どの変数が予測に寄与したか」**という、分類結果を解釈する上で重要な知見を与えてくれます。
本ツールにおいても、x_chart引数の指定対象特徴量の検討に役立てられるかと思います。
主成分分析(PCA)
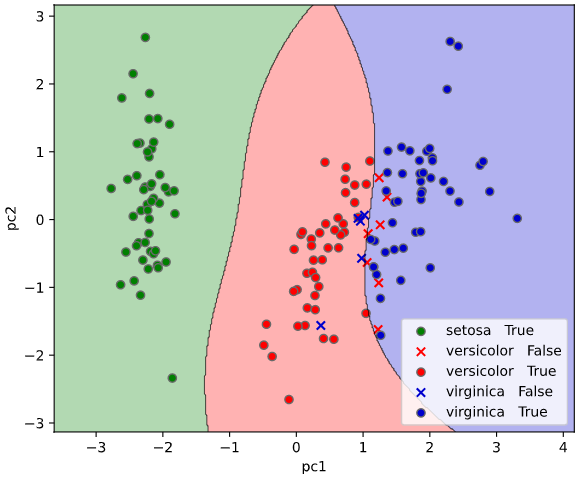
結果解釈というより前処理に近い手法となりますが、データの中から変化量の大きい成分(主成分ベクトル)のみを抜き出し、説明変数の次元数を削減するアルゴリズムを、「主成分分析」と呼びます。
例えば、4次元のデータをグラフで可視化しやすい2次元に圧縮することで、データの解釈性を向上させることができます。
上記以外にも、
・次元の呪い防止による汎化性向上
・次元削減による学習処理時間短縮
等のメリットがあります。
一方で、
・主成分以外の近傍関係が消失し、分類性能が落ちる恐れがある(情報欠損をなるべく防ぐよう圧縮してはいます)
・特徴量自体の解釈性が落ちてしまう(元々の特徴量が「大きさ」「色」など解釈性が高く作られているのに対し、PCA後は「大きさ×0.8+色×0.6」というように混ぜこぜの特徴量となります)
等のデメリットもあります
from sklearn.svm import SVC
from sklearn.preprocessing import StandardScaler
from sklearn.decomposition import PCA
import pandas as pd
from seaborn_analyzer import classplot
features = ['petal_width', 'petal_length', 'sepal_width', 'sepal_length']
X = iris[features].values
y = iris['species'].values
# 前処理として標準化
ss = StandardScaler()
ss.fit(X)  # 標準化パラメータの学習
X_ss = ss.transform(X)  # 学習結果に基づき標準化
# 主成分分析で4→2次元に圧縮
pca = PCA(n_components=2)
pca.fit(X_ss)  # 主成分分析の学習
X_pca = pca.transform(X_ss)  # 学習結果に基づき次元圧縮
iris['pc1'] = pd.Series(X_pca[:, 0])  # 第1主成分をirisに格納
iris['pc2'] = pd.Series(X_pca[:, 1])  # 第2主成分をirisに格納
clf = SVC()
classplot.class_separator_plot(clf, x=['pc1', 'pc2'],
                               y='species', data=iris)
主成分分析は距離に基づいたアルゴリズムのため、前処理として標準化が必要な場合が多いです。
標準化に際して標準偏差で割るかどうかに関しては諸説あるので、こちらやこちらが参考になるかと思います(今回のirisデータセットは単位系がcmで揃っているので割らなくとも良さそうですが、基本的には上記実装例のようにScikit-LearnのStandardScalerクラスで標準偏差で割ってしまうのが無難みたいです)
t-SNE
t-SNEとは、点同士の距離の長短を保持しながら次元を圧縮する手法の一つで、
文章解析や画像分類の可視化でよく使われています。
PCA(多次元正規分布が前提)やMDS等他の次元削減手法と比べ、非線形な構造に強い事が利点との事です。
詳細はこちらやこちらの記事でまとめられております。
import seaborn as sns
from sklearn.preprocessing import StandardScaler
from sklearn.manifold import TSNE
import pandas as pd
features = ['petal_width', 'petal_length', 'sepal_width', 'sepal_length']
X = iris[features].values
y = iris['species'].values
# 前処理として標準化
ss = StandardScaler()
ss.fit(X)  # 標準化パラメータの学習
X_ss = ss.transform(X)  # 学習結果に基づき標準化
# t-SNEで4→2次元に圧縮
tsne = TSNE(n_components=2,  # 圧縮後の次元数
            n_iter=1000,  # 学習繰り返し回数
            random_state=42)  # 乱数シード
points = tsne.fit_transform(X_ss)  # t-SNEの学習と次元圧縮
iris['1st'] = pd.Series(points[:, 0])  # 第1軸をirisに格納
iris['2nd'] = pd.Series(points[:, 1])  # 第2軸をirisに格納
sns.scatterplot(x='1st', y='2nd', hue='species', data=iris)
実装にはこちらを参考にさせて頂きました
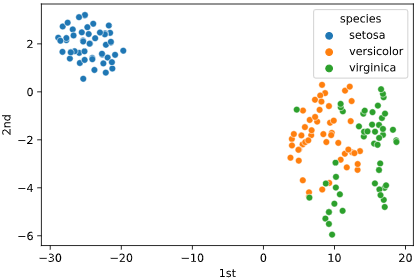
試しに標準化しない場合もプロットしましたが、こちらの方がクラスの分離性が良さそうです
import seaborn as sns
from sklearn.preprocessing import StandardScaler
from sklearn.manifold import TSNE
import pandas as pd
features = ['petal_width', 'petal_length', 'sepal_width', 'sepal_length']
# t-SNEで4→2次元に圧縮
tsne = TSNE(n_components=2,  # 圧縮後の次元数
            n_iter=1000,  # 学習繰り返し回数
            random_state=42)  # 乱数シード
points = tsne.fit_transform(iris[features])  # t-SNEの学習と次元圧縮
iris['1st'] = pd.Series(points[:, 0])  # 第1軸をirisに格納
iris['2nd'] = pd.Series(points[:, 1])  # 第2軸をirisに格納
sns.scatterplot(x='1st', y='2nd', hue='species', data=iris)
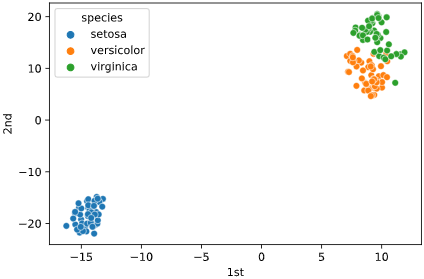
こちらの記事では標準化した方が分離性が上がるようですし、irisデータセットでも乱数シードによって標準化した方が分離性が高く見える場合があるので、標準化の要否はデータによりそうです。
なお、t-SNEは可視化に特化した手法であるため、可視化以外の目的での活用は挙動が読めず、あまり薦められないそうです。t-SNEした後にSVMで分類、という使い方は良くないかもしれません。
PCAやt-SNE以外の次元削減のアルゴリズムには、MDSなどの圧縮法や、特徴量選択して不要な変数を捨てる方法等があります。後者は性能は落ちますが(汎化性能は上がることも)、元の特徴量そのものの解釈性を維持できるので、本記事のコンセプトには合致するかと思います。
関連記事
本記事は、データの可視化をテーマとしたシリーズものです。よければ下記の記事もどうぞ
