機械学習で特徴量をどう選択していくべきかを考え、学ぶことが多かったので記事に書いていきます。特徴量選択をすることで、役に立つかわからないけど特徴量を増やして、後で役に立たなかった特徴量を捨てることができます。
勉強範囲や深さがたいしたことなく、基本的にScikit-learn ユーザガイド 1.13. Feature selectionに従って勉強・実践した内容です。
KaggleのTitanicチャレンジをやりながら学習したため、分類関連を重点的に記述しています。回帰は使っていないので、軽い説明程度です。
特徴量選択の種類
特徴量選択の種類に以下の3つがあります。どれかだけを実施する択一的なものではなく、組み合わせて実施してもいいものかと考えています。
| 種類 | 内容 | 計算量 | Scikit-Learnの手法例 |
|---|---|---|---|
| Filter Method | 統計的手法で個々の特徴量を評価 | 少 |
SelectKBest関数でANOVAのスコア使用 |
| Wrapper Method | 機械学習モデルで最適な特徴量組み合わせを探索 | 多 | Forward Feature Selection でRandomForestClassifierを使う |
| Embedded Method | 機械学習モデルで簡易的に特徴量を評価 | 中 | RandomForestClassifierのFeature importance |
手法
1. Filter Method
Filter Methodは統計的な手法(分散やχ二乗検定など)で特徴量の評価・選択をします。他の手法に比べると計算量が少なく、最初に足切りで実施するものだと考えています(経験浅いのであまり根拠なし)。
1.1. 低分散変数の削除
分散が低ければ、説明変数としての意味ないと考え特徴から削除する方法です。VarianceThreshold関数を使います。
今回の例では分散0としており、まったく変動していない特徴を対象とします。ベルヌーイ分布の分散であるp(1 − p) を使うのもありかと思います。
分散0はPandasのget_dummies関数でオプションdummy_naを使った時に出てしまいました。欠損値がある特徴があったため、get_dummies関数を使ったのですが、欠損値がない特徴量もNaNの列ができてしまい、すべて値が0で分散が0の列ができてしまいました。その列をVarianceThreshold関数で消しました。
import pandas as pd
from sklearn.feature_selection import VarianceThreshold

X = pd.DataFrame({'A': [0, 0, 0, 0, 0, 0],
                  'B': [0, 1, 0, 1, 1, 1],
                  'C': [1, 0, 0, 1, 0, 1]})

# デフォルトはしきい値が0、変えたければthresholdに値を渡す
# sel = VarianceThreshold(threshold=(.8 * (1 - .8))) #ベルヌーイ分布の分散期待値を使った例
sel = VarianceThreshold()
sel.fit_transform(X)

X_new = pd.DataFrame(sel.fit_transform(X), columns=X.columns.values[sel.get_support()])
print('Before Feature Selection:', X.shape)
print('After Feature Selection:', X_new.shape)

result = pd.DataFrame(sel.get_support(), index=X.columns.values, columns=['False: dropped'])
result['variance'] = sel.variances_
print(result)
実行すると以下が出力されます。
Before Feature Selection: (6, 3)
After Feature Selection: (6, 2)
   False: dropped  variance
A           False  0.000000
B            True  0.222222
C            True  0.250000
1.2. 単変量特徴量選択(Univariate feature selection)
単変量特徴量選択は、単一の説明変数と目的変数を統計テストに基づいて評価します(単一の説明変数を順次評価していき、全説明変数を評価)。
1.2.1. 評価基準
まずは評価基準から説明します。Scikit-Learnでは回帰と分類で以下のScoring Functionがあります。
|Scoring Function|回帰/分類|内容|
|:-:|:-:|:-:|:-:|
|f_regression|回帰|F検定のはず(未調査)|
|mutual_info_regression|回帰|相互情報量のはず(未調査)|
|chi2|分類|χ二乗検定|
|f_classif|分類|ANOVA|
|mutual_info_classif|分類|相互情報量|
分類系に関してはもう少し詳しく。
| Scoring Function | 内容 | パラメトリック | 返り値(Score) | 返り値(P-value) |
|---|---|---|---|---|
| chi2 | χ二乗検定 | ノンパラメトリック | χ二乗統計量 | P値 |
| f_classif | ANOVA | パラメトリック | F値 | P値 |
| mutual_info_classif | 相互情報量 | ノンパラメトリック | 相互情報量 | なし |
パラメトリックとノンパラメトリックの違いは以下のサイトがわかりやすいです。今回はf_classifのみがパラメトリックで、特徴量および目的変数が正規分布に従う前提です。
では、特徴量と目的変数に応じて何使えばいいんだよ、って話ですが、記事「Introduction to Feature Selection methods with an example」では、特徴量(Feature)と目的変数(Response)に応じて、下記の推奨を示してくれています。私は正しくこの内容を理解できておらず、「相互情報量はどうマッピングされるんだ?」状態です。

※LDAはLinear Discriminant Analysisで、線形判別法。「はじパタ」で学んだやつですね。
3つの評価基準を試す前提となるデータ作成のコードを載せておきます。
import pandas as pd
from sklearn.feature_selection import SelectKBest, f_classif, mutual_info_classif, chi2

X = pd.DataFrame({'Sex': ['Male', 'Male', 'Male', 'Female', 'Female', 'Female'],
                  'Age': [30, 30, 20, 30, 30, 20],
                  'Survived': [0, 0, 1, 1, 1, 1]})  # 0: Dead, 1: Survived

X_new = pd.get_dummies(X[['Sex', 'Age']])
print(pd.concat([X_new, X['Survived']], axis=1))
こんなデータになっています。'Survived'が目的変数で、他が説明変数。'Age'は結果に大きく影響しない特徴量として作っています。
   Age  Sex_Female  Sex_Male  Survived
0   30           0         1         0
1   30           0         1         0
2   20           0         1         1
3   30           1         0         1
4   30           1         0         1
5   20           1         0         1
1.2.1.1. chi2: χ二乗検定
以下がχ二乗検定の前提です。
- 期待度数が大きい
表全体の少なくとも80%が5以上で,期待度が1を下回るものがゼロである - データがお互いに独立である(特徴量間が独立という意味ではなく、1特徴量内のデータが独立)
- 特徴量と目的変数は正の値(0以上)である必要あり(Scikit-Learnで試すと目的変数は負の値でもできました。分類問題なので、目的変数が負の値であってもあまり関係ないのでしょうか?)
※期待度数は「独立性の検定―最もポピュラーなカイ二乗検定」に書かれている例がわかりやすいです。
以下のサイトが参考になります。
後述するSelectKBest関数を使って実装しました。
selector = SelectKBest(chi2, k=2)
X_new2 = pd.DataFrame(selector.fit_transform(X_new, X['Survived']), columns=X_new.columns.values[selector.get_support()])
result = pd.DataFrame(selector.get_support(), index=X_new.columns.values, columns=['False: dropped'])
result['score'] = selector.scores_
result['pvalue'] = selector.pvalues_

print(result)
Ageのscore(χ二乗統計量)が低く不要と判断(drop)されているのがわかります。
※P値は特徴量が目的変数と独立しているという帰無仮説で、一番P値が高かったAgeに関し、目的変数と関係ないと判断している。
            False: dropped  score    pvalue
Age                  False   1.25  0.263552
Sex_Female            True   1.50  0.220671
Sex_Male              True   1.50  0.220671
1.2.1.2. f_classif: ANOVA
以下が前提です。「正規分布」という前提は少し厳しいですが、その分だけ独立性をしっかり検定できます。少なくてもすべての特徴量が正規分布ということはないでしょうから、一部の特徴量に限定するのでしょう。
- それぞれの特徴量は独立である
- それぞれの特徴量の母集団の分布は正規分布である
- それぞれの特徴量の母集団の分布の分散はすべて等しい
以前記事にした「【R入門】R言語の基本:一元配置分散分析(対応あり)」や「【R入門】R言語の基本:二元配置分散分析」と同じ原理っぽい(未確認)。
以下のサイトが参考になります。
後述するSelectKBest関数を使って実装しました。
selector = SelectKBest(f_classif, k=2)
X_new2 = pd.DataFrame(selector.fit_transform(X_new, X['Survived']), columns=X_new.columns.values[selector.get_support()])
result = pd.DataFrame(selector.get_support(), index=X_new.columns.values, columns=['False: dropped'])
result['score'] = selector.scores_
result['pvalue'] = selector.pvalues_

print(result)
Ageのscore(F値)が低く不要と判断(drop)されているのがわかります。Ageが正規分布からは大きくはずれているのでχ二乗検定と比べてP値が多くなっているのがわかります。
※P値は特徴量が目的変数と独立しているという帰無仮説で、一番P値が高かったAgeに関して帰無仮説を棄却し、独立していない(目的変数と関係ない)と判断している。
※上記のように書きましたが、P値が高いのに帰無仮説を棄却するというのは矛盾していました[2022/1/11 追記]。
            False: dropped     score    pvalue
Age                  False  1.333333  0.312500
Sex_Female            True  4.000000  0.116117
Sex_Male              True  4.000000  0.116117
1.2.1.3. mutual_info_classif: 相互情報量
各特徴量は正規分布である必要がなく、非線形な相関関係も検出することができます。ただし、パラメトリックな手法と比べてサンプル数サイズを必要とします。
以下のサイトが参考になります。
後述するSelectKBest関数を使って実装しました。
selector = SelectKBest(mutual_info_classif, k=2)
X_new2 = pd.DataFrame(selector.fit_transform(X_new, X['Survived']), columns=X_new.columns.values[selector.get_support()])
result = pd.DataFrame(selector.get_support(), index=X_new.columns.values, columns=['False: dropped'])
result['score'] = selector.scores_
result['pvalue'] = selector.pvalues_

print(result)
Ageのscore(相互情報量)が低く不要と判断(drop)されているのがわかります。
            False: dropped     score
Age                  False  0.000000
Sex_Female            True  0.130556
Sex_Male              True  0.338889
1.2.2. 評価方法
1.2.2.1. SelectKBest
SelectKBest関数はスコア降順でK個の特徴量を保持し、K番目移行の特徴量を削除します。「1.2.1. 評価基準」で使っていたやつです。
1.2.2.1.1. SelectKBestでf_classifを使った例(結果のグラフ出力あり)
評価基準f_classifを使って結果をグラフ表示していみます。
print('Before Feature Selection:', X_new.shape)
selector = SelectKBest(f_classif, k=2)

# DataFrameにしておいた方が、後々使いやすい
X_new2 = pd.DataFrame(selector.fit_transform(X_new, X['Survived']), columns=X_new.columns.values[selector.get_support()])

print('After Feature Selection:', X_new2.shape)
result = pd.DataFrame(selector.get_support(), index=X_new.columns.values, columns=['False: dropped'])

pd.options.display.float_format = None
result['score'] = selector.scores_
result['pvalue'] = selector.pvalues_

fig, axes = plt.subplots(nrows=1, ncols=3, figsize=(20, 6))
fig.subplots_adjust(wspace=0.3, hspace=0.2)

result.sort_values('score', ascending=True, inplace=True)
result['score'].plot.barh(ax=axes[0], stacked=True, y=[0, 1])
result['pvalue'].plot.barh(ax=axes[1], color='green')
axes[0].invert_xaxis()
axes[0].set_yticklabels([])
axes[0].set_ylabel('')
axes[0].grid(axis='x', linestyle='dotted')
axes[0].set_title('Score')
axes[1].set_ylabel('')
axes[1].grid(axis='x', linestyle='dotted')
axes[1].set_title('pvalue')
axes[2].axis('tight')
axes[2].axis('off')
axes[2].table(cellText=result.round(2).values,  # roundしないと表が小さすぎる
              colLabels=result.columns,
              rowLabels=result.index, loc='center')
plt.show()
1.2.2.1.2. SelectKBestでmutual_info_classifを使った例(結果のグラフ出力あり)
評価基準mutual_info_classifを使って結果をグラフ表示していみます。
print('Before Feature Selection:', X_new.shape)
selector = SelectKBest(mutual_info_classif, k=2)

# DataFrameにしておいた方が、後々使いやすい
X_new2 = pd.DataFrame(selector.fit_transform(X_new, X['Survived']), columns=X_new.columns.values[selector.get_support()])

print('After Feature Selection:', X_new2.shape)
result = pd.DataFrame(selector.get_support(), index=X_new.columns.values, columns=['False: dropped'])

pd.options.display.float_format = None
result['score'] = selector.scores_

fig, axes = plt.subplots(nrows=1, ncols=2, figsize=(16, 4))
fig.subplots_adjust(wspace=0.3, hspace=0.2)

result.sort_values('score', ascending=True, inplace=True)
result['score'].plot.barh(ax=axes[0], stacked=True, y=[0, 1])
axes[1].axis('tight')
axes[1].axis('off')
axes[1].table(cellText=result.round(3).values,  # roundしないと表が小さすぎる
              colLabels=result.columns,
              rowLabels=result.index, loc='center')
plt.show()
1.2.2.2. SelectPercentile
SelectPercentile関数は、ユーザーが指定した最もスコアの割合の高い特徴量を削除します。SelectKBestが数で残す特徴量を指定したのに対し、こちらは割合で指定します。
1.2.2.3. SelectFpr
SelectFpr関数はFPRテスト(False Positive Rate test: 偽陽性率テスト)を使って特徴量選択をします。誤りの総数でコントロールするようです。
1.2.2.4. SelectFdr
SelectFdr関数はFalse Discovery Rate(偽発見率)を使って特徴量選択をします。Benjamini and Hochberg法というものらしいですが、調べていません。
1.2.2.5. SelectFwe
SelectFwe関数はFamily-wise error rateを使って特徴量選択をします。ファミリーワイズエラー率というものらしいですが、調べていません。
1.2.2.6. GenericUnivariateSelect
GenericUnivariateSelect関数を使用すると、実行時にパラメータで実行方法をSelectKBestなど指定できます。GridSearchCV関数とPipelineの組み合わせで威力を発揮するものなのでしょう。
1.2.3. その他評価方法
他にも以下の方法があるようです。
- ピアソンの相関係数(相関係数は線形の相関しか対応できないので注意)
- Univariate ROC_AUC / RMSE
リンク先のような新しい方法もあるようです。
2. Wrapper Method
Wrapper Methodは、機械学習モデルを使用して特徴量の組み合わせを評価します。機械学習と組み合わせることで最適な特徴量との組み合わせを探し出します。
|手法|内容|計算量|
|:--|:--|:-:|:-:|
|SFS(Sequential Feature Selection)|全/1特徴量でモデル作成し精度が改善するまで1特徴量づつ追加/削減|中|
|RFE(Recursive Feature Elimination)|全特徴量でモデル作成し、最低重要度の特徴量を1つ削減を繰り返し|少|
|EFS(Exhaustive Feature Selector)|全特徴量組み合わせを探索|多|
ここでは、KaggleのTitanicチャレンジのデータを使って行きます。まずは共通的な前処理。
import pandas as pd
import matplotlib.pyplot as plt

from sklearn.feature_selection import SequentialFeatureSelector, VarianceThreshold, RFE, RFECV
from mlxtend.feature_selection import ExhaustiveFeatureSelector as EFS
from sklearn.ensemble import RandomForestClassifier

train_data = pd.read_csv("./train.csv")
train = pd.get_dummies(train_data[['Pclass', 'Sex', 'Age', 'SibSp', 'Parch', 'Fare', 'Embarked']], dummy_na=True)
train.fillna(train.mean(), inplace=True) # 欠損値埋め

# Sex_nan を削除(分散0なので)
sel = VarianceThreshold()
X = pd.DataFrame(sel.fit_transform(train), columns=train.columns.values[sel.get_support()])
X.info()

# ランダムフォレストを使う
rf = RandomForestClassifier()
X.info()は以下の出力です。891レコードあります。
RangeIndex: 891 entries, 0 to 890
Data columns (total 11 columns):
 #   Column        Non-Null Count  Dtype
---  ------        --------------  -----
 0   Pclass        891 non-null    float64
 1   Age           891 non-null    float64
 2   SibSp         891 non-null    float64
 3   Parch         891 non-null    float64
 4   Fare          891 non-null    float64
 5   Sex_female    891 non-null    float64
 6   Sex_male      891 non-null    float64
 7   Embarked_C    891 non-null    float64
 8   Embarked_Q    891 non-null    float64
 9   Embarked_S    891 non-null    float64
 10  Embarked_nan  891 non-null    float64
2.1. SFS(Sequential Feature Selection): 逐次特徴選択
全特徴量または、1つの特徴量でモデルを生成し逐次的に特徴量を追加/削減します。その際に、RFE(Recursive Feature Elimination)と違ってモデルの交差検証スコア(F1スコアなど)を評価基準に追加/削減します。Scikit-Learnでは0.24から実装された新し目の関数なので注意ください。
この記事ではscikit-learnを使っていますが、mlxtendを使うともう少しオプション(Sequential Forward Floating SelectionとSequential Backward Floating Selection)があります。
2.1.1. Forward Selection
以下のステップで特徴量を選択します。
- 1つの特徴量で訓練しモデルを生成(3つの特徴量があれば3回生成)
- 最高性能を出したモデルの特徴量を残す
- 前ステップで残した特徴量に1つ特徴量を追加して訓練しモデルを生成(2つの特徴量が残っていれば2回生成)
- 2と3のステップを残す特徴量の数に達するまで繰り返し
Pythonで以下の実装をします。
%%time
selector = SequentialFeatureSelector(rf, n_features_to_select=10, cv=5) #Backwardと共通関数で、Defaultがfoward

X_new = pd.DataFrame(selector.fit_transform(X, train_data['Survived']),
                     columns=X.columns.values[selector.get_support()])
result = pd.DataFrame(selector.get_support(), index=X.columns.values, columns=['False: dropped'])
print(result)
特徴Ebmarked_Sがdrop対象とされているのがわかります。たかだか891レコードに対して2分半かかっています。
              False: dropped
Pclass                  True
Age                     True
SibSp                   True
Parch                   True
Fare                    True
Sex_female              True
Sex_male                True
Embarked_C              True
Embarked_Q              True
Embarked_S             False
Embarked_nan            True
CPU times: user 2min 22s, sys: 1.37 s, total: 2min 24s
Wall time: 2min 27s
mlextendのSequential Feature Selectorだと増やした後に減らすステップを含む**Sequential Forward Floating Selection(SFFS)**という手法もあります。
2.1.2. Backward Selection
以下のステップで特徴量を選択します。
- 全特徴量で訓練しモデルを生成
- 1つ特徴量を減らして訓練しモデルを生成(3つの特徴量があれば3回生成)
- 最高性能を出したモデルの特徴量を残す(1つ特徴量を削減)
- 2と3のステップを残す特徴量の数に達するまで繰り返し
Pythonで以下の実装をします。実装方法はFoward Selectionとあまり変わらないです。
%%time
selector = SequentialFeatureSelector(rf, n_features_to_select=10, direction='backward', cv=5)

X_new = pd.DataFrame(selector.fit_transform(X, train_data['Survived']),
                     columns=X.columns.values[selector.get_support()])
result = pd.DataFrame(selector.get_support(), index=X.columns.values, columns=['False: dropped'])
print(result)
結果出力です。Forwardの時とdrop対象の特徴量が異なっているのが興味深いです。11特徴量あったものに対して10選ぶので、Forward時より実行時間が30秒と短くなっています(Forward時は2分30秒)。
              False: dropped
Pclass                  True
Age                     True
SibSp                   True
Parch                   True
Fare                    True
Sex_female              True
Sex_male                True
Embarked_C              True
Embarked_Q              True
Embarked_S              True
Embarked_nan           False
CPU times: user 29.6 s, sys: 671 ms, total: 30.2 s
Wall time: 32.5 s
mlextendのSequential Feature Selectorだと増やした後に減らすステップを含む**Sequential Backward Floating Selection(SBFS)**という手法もあります。
2.2. RFE(Recursive Feature Elimination): 再帰的特徴量削減
SFS(Sequential Feature Selection)のBackward Selectionと似ています。Backward Selectionはモデルの交差検証スコア(F1スコアなど)を評価基準にしたのに対して、RFE(Recursive Feature Elimination)ではFeature Importance/Coefで評価して削減対象を決めます。そのため、どの特徴量を削減するか判断するために1回の訓練だけで足り、実行時間を短縮できます。
2.2.1. RFE(クロスバリデーションなし)
以下のステップで特徴量を削減します。
- 全特徴量で訓練しモデルを生成
- 最低のFeature Importnace/ Coef の特徴量を1つ減らして訓練しモデルを生成
- 2のステップを残す特徴量の数に達するまで繰り返し
Pythonで以下の実装をします。SFS(Sequential Feature Selection)と異なり、ランキングを持つので出力してみます。
%%time
selector = RFE(rf, n_features_to_select=8)

X_new = pd.DataFrame(selector.fit_transform(X, train_data['Survived']),
                     columns=X.columns.values[selector.get_support()])
result = pd.DataFrame(selector.get_support(), index=X.columns.values, columns=['False: dropped'])
result['ranking'] = selector.ranking_
print(result)
出力でdropした特徴量のランクがわかります。また、実行時間は2秒と非常に速いです。
              False: dropped  ranking
Pclass                  True        1
Age                     True        1
SibSp                   True        1
Parch                   True        1
Fare                    True        1
Sex_female              True        1
Sex_male                True        1
Embarked_C             False        2
Embarked_Q             False        3
Embarked_S              True        1
Embarked_nan           False        4
CPU times: user 1.73 s, sys: 31.4 ms, total: 1.76 s
Wall time: 1.83 s
2.2.2. RFECV(クロスバリデーションあり)
RFE(Recursive Feature Elimination)では、何個の特徴量を残すかn_features_to_selectで明示しました。何個残すべきかをクロスバリデーションで決められるRFECVもあります。
Pythonで以下の実装をします。RFEと異なるのは、min_features_to_selectに最低限残す特徴量の数と、cvにクロスバリデーションの数を指定する点です。選ぶ特徴量は、Feature Importance/Coefで評価して、何個の特徴量を残すかは、モデルの交差検証スコア(F1スコアなど)を評価基準とするのだと思います(詳細未確認)。
%%time
in_features_to_select = 3
selector = RFECV(rf, min_features_to_select=in_features_to_select, cv=5)

X_new = pd.DataFrame(selector.fit_transform(X, train_data['Survived']),
                     columns=X.columns.values[selector.get_support()])
result = pd.DataFrame(selector.get_support(), index=X.columns.values, columns=['False: dropped'])
result['ranking'] = selector.ranking_
print(result)
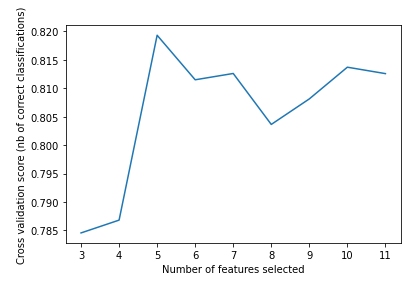
5つの特徴量を残すのが最高性能だったようです。クロスバリデーションをしているので当然実行時間は長くなり30秒かかりました。
              False: dropped  ranking
Pclass                  True        1
Age                     True        1
SibSp                  False        2
Parch                  False        3
Fare                    True        1
Sex_female              True        1
Sex_male                True        1
Embarked_C             False        5
Embarked_Q             False        6
Embarked_S             False        4
Embarked_nan           False        7
CPU times: user 30.2 s, sys: 493 ms, total: 30.7 s
Wall time: 31.8 s
特徴量の数とスコアをグラフ表示してみます。
# Plot number of features VS. cross-validation scores
plt.figure()
plt.xlabel("Number of features selected")
plt.ylabel("Cross validation score (nb of correct classifications)")
plt.plot(range(in_features_to_select,
               len(selector.grid_scores_) + in_features_to_select),
         selector.grid_scores_)
plt.show()
2.3. EFS(Exhaustive Feature Selector)
全組み合わせを試して最も性能が高くなった組み合わせを選択します。計算量が非常に多いです。例えば3つの特徴量を考えれば、全部で7(${}_3 C_3 + {}_3 C_2 +{}_3 C_1 =1+3+3 $)通りをモデル生成する必要があり、特徴量が多い場合には処理時間が非常に長くなります。
Scikit-Learnには該当の関数がないので、mlxtendの関数を使います。min_featuresで最低限残す特徴量の数を、max_featuresで最大の特徴量の数を指定します。間隔を増やすとすごく時間がかかるので、狭めるように注意しましょう。
%%time
efs1 = EFS(rf, min_features=9, max_features=10)
efs1 = efs1.fit(X, train_data['Survived'])

print('Best accuracy score: %.2f' % efs1.best_score_)
print('Best subset:', efs1.best_feature_names_)
2分30秒かかり、9つの特徴量が選択されました。
Best accuracy score: 0.82
Best subset: ('Pclass', 'Age', 'SibSp', 'Parch', 'Fare', 'Sex_female', 'Sex_male', 'Embarked_C', 'Embarked_S')
CPU times: user 2min 14s, sys: 1.45 s, total: 2min 16s
Wall time: 2min 20s
細かい結果を見てみます。
df = pd.DataFrame.from_dict(efs1.get_metric_dict()).T
df.sort_values('avg_score', inplace=True, ascending=False)

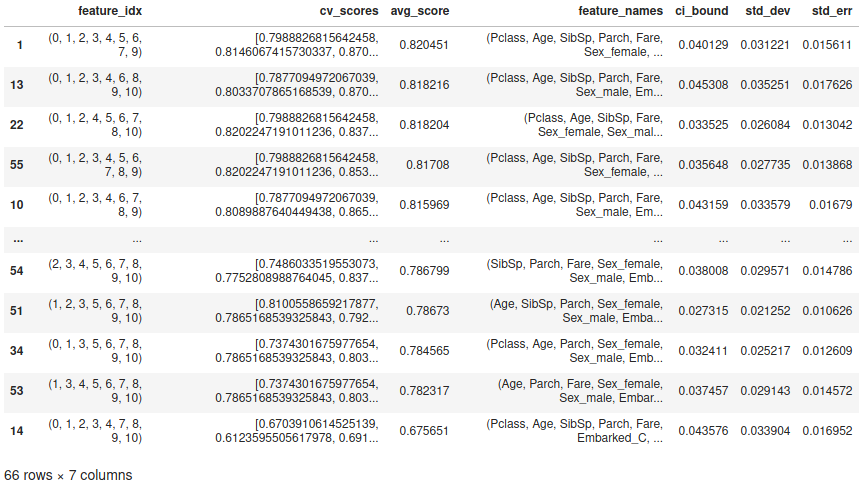
df
66($ _{11} C_9 $ + $_{11} C_{10}$)通りの探索がされたことがわかります。

上位10件をグラフ出力してみます。
_, ax = plt.subplots(nrows=1, ncols=1)

df.set_index('feature_names', inplace=True) # 一番わかりやすい特徴名をindexに設定(グラフ出力用)
df.head(10).sort_values('avg_score', ascending=True)['avg_score'].plot.barh(ax=ax, grid=True)
ax.set_xlim(df.head(10)['avg_score'].min() * 0.95, df.head(10)['avg_score'].max() * 1.05)
plt.show()
3. Embedded Method
Embedded Methodは機械学習のモデルで出力されるcoef_やfeature_importances_を基準に特徴量選択をします。この基準に対するしきい値をどうすべきかがよくわかっていません。 Wrapper Methodと違い、1回の訓練で学習するため処理時間が短いです。Wrapper MethodのRFEと似ています(RFEは基準をcoef_やfeature_importances_としていますが、1つずつ特徴量を減らしながら最適な特徴量組み合わせを見つけますがEmbedded Methodはしきい値で役に立つ特徴量を探します)。
SelectFromModel関数を使います。
Pythonコードの前提処理は「2. Wrapper Method」と同じです。
3.1. L1正則化線形モデル系
(L2正則化はだめなのか、など調べていませんが)L1正則化線形モデルを使って特徴量選択をします。
線形SVCを使います。
from sklearn.svm import LinearSVC
svc = LinearSVC(C=0.01, penalty="l1", dual=False)
今回は使っていませんが、パラメータthresholdで選択する特徴量のしきい値を設定します。設定しないとモデルに依存した値(中央地など)が自動で使われます。
%%time
selector = SelectFromModel(svc)

X_new = pd.DataFrame(selector.fit_transform(X, train_data['Survived']),
                     columns=X.columns.values[selector.get_support()])
result = pd.DataFrame(selector.get_support(), index=X.columns.values, columns=['False: dropped'])
result['coef'] = selector.estimator_.coef_[0]  # Linearモデル用
print(result)
50msと一瞬で終わります。出力結果です。
              False: dropped      coef
Pclass                  True -0.167835
Age                     True -0.006467
SibSp                   True -0.047170
Parch                  False  0.000000
Fare                    True  0.002751
Sex_female              True  0.784280
Sex_male               False  0.000000
Embarked_C             False  0.000000
Embarked_Q             False  0.000000
Embarked_S             False  0.000000
Embarked_nan           False  0.000000
CPU times: user 25.4 ms, sys: 3.89 ms, total: 29.3 ms
Wall time: 45.8 ms
3.2. 決定木系
決定木系でもコードは大して変わりません。評価基準としてfeature_importances_を使っているくらいでしょうか。
%%time
selector = SelectFromModel(rf) # 中央値以上の特徴量を選択

X_new = pd.DataFrame(selector.fit_transform(X, train_data['Survived']),
                     columns=X.columns.values[selector.get_support()])
result = pd.DataFrame(selector.get_support(), index=X.columns.values, columns=['False: dropped'])
result['featureImportances'] = selector.estimator_.feature_importances_  # Random Forest用
print(result)
出力結果です。
              False: dropped  featureImportances
Pclass                  True            0.092032
Age                     True            0.258608
SibSp                  False            0.047554
Parch                  False            0.036978
Fare                    True            0.248851
Sex_female              True            0.150085
Sex_male                True            0.131446
Embarked_C             False            0.012114
Embarked_Q             False            0.008002
Embarked_S             False            0.014282
Embarked_nan           False            0.000046
CPU times: user 830 ms, sys: 29.3 ms, total: 859 ms
Wall time: 1.01 s
4. Tips(パイプライン化)
ユーザガイド「1.13.6. Feature selection as part of a pipeline」に特徴量選択は、機械学習の前処理なのでパイプライン化しましょう、と書いてありました。
こんな感じでしょう。
from sklearn.pipeline import Pipeline

pipeline = Pipeline([('feature_selection', SelectFromModel(svc)),
                    ('classifier', rf)])
pipeline.fit(X, train_data['Survived'])
参考リンク
以下のリンクを参考にしました。


