前回
筑波大学の機械学習講座:課題のPythonスクリプト部分を作りながらsklearnを勉強する (10)
https://github.com/legacyworld/sklearn-basic
課題5.4 ROC曲線の作成と正則化パラメータのチューニング
Youtubeでの解説:第6回(1) 58分30秒あたり
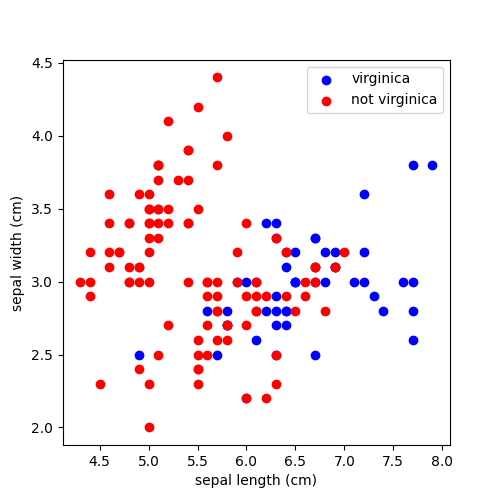
sklearnのiris(あやめ)データを利用するが、単純化のために以下の条件としている。
- sepal width(がく片幅),sepal length(がく片長)のみ利用する
- petal width/length(花弁幅・長)は使用しない
- virginicaかそうでないか、のみ考慮する
- 本当はsetosa,versicolor,virginicaの3種類
ソースコードはこちら
import numpy as np
import matplotlib.pyplot as plt
from sklearn import svm,metrics
from sklearn.model_selection import train_test_split
from sklearn.datasets import load_iris
iris = load_iris()
# sepal width(がく片幅),sepal length(がく片長)のみを使用する
features = [0,1]
# virginicaかそうでないかだけ考慮する
target = 2
X = iris.data[:,features]
y = iris.target
# y = 2ではない(virginicaではない)場合は-1
y[np.where(np.not_equal(y,target))] = -1
y[np.where(np.equal(y,target))] = 1
# データのみ描画
plt.figure(0,figsize=(5,5))
plt.scatter(X[:, 0][np.where(y==1)], X[:, 1][np.where(y==1)], color='b',label=iris.target_names[target])
plt.scatter(X[:, 0][np.where(y==-1)], X[:, 1][np.where(y==-1)], color='r',label=f"not {iris.target_names[target]}")
plt.xlabel(iris.feature_names[features[0]])
plt.ylabel(iris.feature_names[features[1]])
plt.legend()
plt.savefig("5.4_irisdata.png")
# SVM (C=0.01)
clf = svm.SVC(kernel='linear', C=0.01)
clf.fit(X, y)

# ROC曲線
fpr,tpr,th = metrics.roc_curve(y,clf.decision_function(X))
plt.clf()
plt.plot(fpr,tpr)
plt.xlabel("False Positive Rate")
plt.ylabel("True Positive Rate")
plt.title("ROC")
plt.savefig("5.4_ROC_curve.png")
# False Positive Rateが0.2付近でのTrue Positive Rate
index = np.where(fpr>=0.2)[0].tolist()[0]
print(f"FPR = {fpr[index-1]} TPR = {tpr[index-1]}")
print(f"FPR = {fpr[index]} TPR = {tpr[index]}")

# 切片を変えながら描画
for i in range(0,110,10):
    dec = clf.decision_function(X)
    # 切片を最大値から最小値まで動かす
    intercept = np.max(dec) - i/100*(np.max(dec)-np.min(dec))
    # TPRとFPR
    TP = np.where((np.signbit(dec-intercept)==False) & (np.signbit(y)==False))
    FP = np.where((np.signbit(dec-intercept)==False) & (np.signbit(y)==True))
    FPR = len(FP[0])/len(y)
    TPR = len(TP[0])/len(y)
    # 予測を間違ったもののindex
    index = np.where(np.signbit(dec-intercept)!=np.signbit(y))
    x_miss = X[index]
    y_miss = y[index]
    #描画
    plt.clf()
    plt.figure(0,figsize=(5,5))
    plt.scatter(X[:, 0][np.where(y==1)], X[:, 1][np.where(y==1)], color='b',label=iris.target_names[target])
    plt.scatter(X[:, 0][np.where(y==-1)], X[:, 1][np.where(y==-1)], color='r',label=f"not {iris.target_names[target]}")
    plt.xlabel(iris.feature_names[features[0]])
    plt.ylabel(iris.feature_names[features[1]])
    plt.title(f"Decision boundary Moved {i}% {-intercept:.3f}\nFPR = {FPR:.3f} TPR = {TPR:.3f}")
    # 決定境界の描画
    xlim = plt.xlim()
    ylim = plt.ylim()
    # 30x30の格子を作る
    xx = np.linspace(xlim[0], xlim[1], 30)
    yy = np.linspace(ylim[0], ylim[1], 30)
    YY, XX = np.meshgrid(yy, xx)
    xy = np.vstack([XX.ravel(), YY.ravel()]).T
    # 各格子での分類
    Z = clf.decision_function(xy).reshape(XX.shape)-intercept
    # 等高線を使って決定境界を描画 level=0がそれにあたる
    plt.contour(XX,YY,Z,levels=[0])
    plt.scatter(x_miss[:,0][np.where(y_miss==1)],x_miss[:,1][np.where(y_miss==1)],color='b',s=100,linewidth=1, facecolors='none', edgecolors='k')
    plt.scatter(x_miss[:,0][np.where(y_miss==-1)],x_miss[:,1][np.where(y_miss==-1)],color='b',s=100,linewidth=1, facecolors='none', edgecolors='k')
    plt.legend()
    plt.savefig(f"5.4_decision_boundary_{i}.png")

# Cを0.01から1,000まで変えた時のAUCスコア
c_values = [0.01,0.02,0.05,0.1,0.2,0.5,1,2,5,10,100,1000]
aucs = []
# TRAIN/VALICATION/TEST用に3分割
X_tr_val,X_test,y_tr_val,y_test = train_test_split(X,y,test_size=0.2,random_state=1)
X_tr,X_val,y_tr,y_val = train_test_split(X_tr_val,y_tr_val,test_size=0.2,random_state=1)
print(len(X_tr_val),len(X_test),len(X_tr),len(X_val))
for c_value in c_values:
    clf = svm.SVC(kernel='linear',C=c_value).fit(X_tr,y_tr)
    dec = clf.decision_function(X_val)
    auc = metrics.roc_auc_score(y_val,dec)
    aucs.append(auc)

# 最も良かったCで再計算
best_c_index = np.argmax(aucs)
best_clf = svm.SVC(kernel='linear', C=c_values[best_c_index]).fit(X_tr_val,y_tr_val)
test_predict = best_clf.predict(X_test)
print(f"Best value of parameter C c_values[best_c_index]")

plt.clf()
plt.plot(c_values,aucs,label="AUC Scores")
plt.plot(c_values[best_c_index],aucs[best_c_index],marker ='o',markersize=10,label="Best Score")
plt.legend()
plt.xscale("log")
plt.savefig("5.4_AUC.png")
ROC曲線
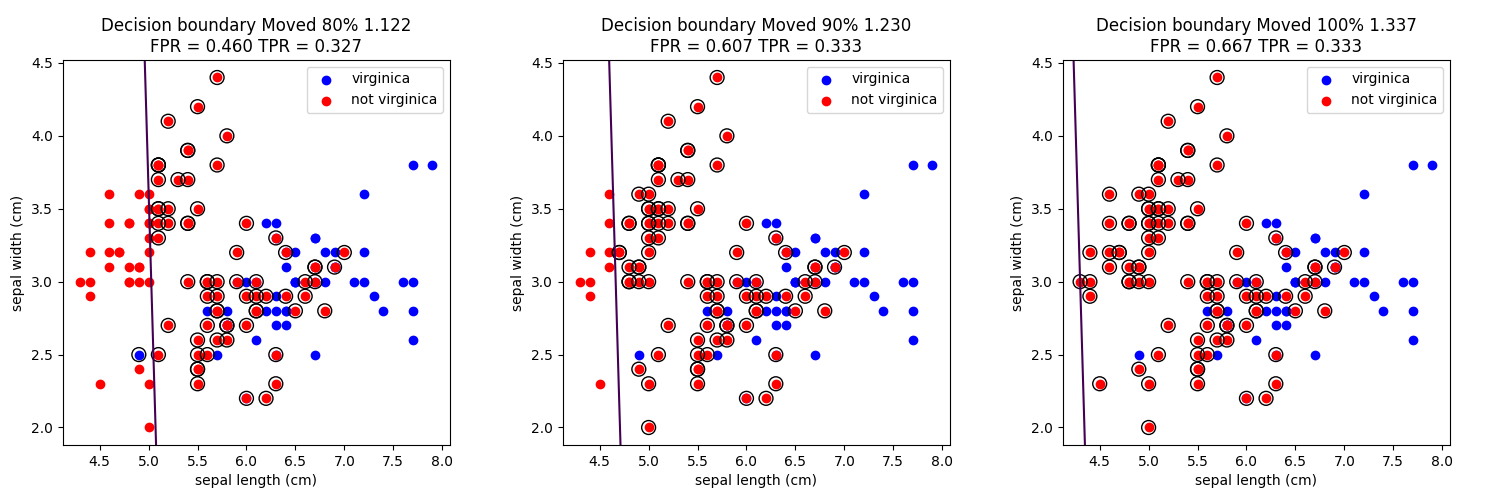
講義では切片(閾値)を動かしながら行っていたが、このプログラムでは切片を10%動かすごとに描画している。
なぜこんなことをしているかの説明はここが非常に詳しい。
https://qiita.com/TsutomuNakamura/items/ef963381e5d2768791d4
切片を動かしたときの予測とその間違い(〇で囲ってあるもの)を以下に示す。


閾値を高くすれば精度は高くなる。つまりvirginicaじゃないものをvirginicaにすることはないが、virginicaをvirginicaではないとしてしまう場合が増える。
逆に閾値を低くすれば、virginicaを正しくvirginicaと判定できるが、virginicaじゃないものもvirginicaになってしまう。
前者が犯罪者の判定(一部の犯罪者を見逃してもいいが、冤罪はダメ)
後者が癌検診の判定(癌じゃない良性腫瘍も癌だと判定して患者を余分にびびらせてしまうが、ダメージはビビるだけなので問題なし)
さて課題にあるこの問題
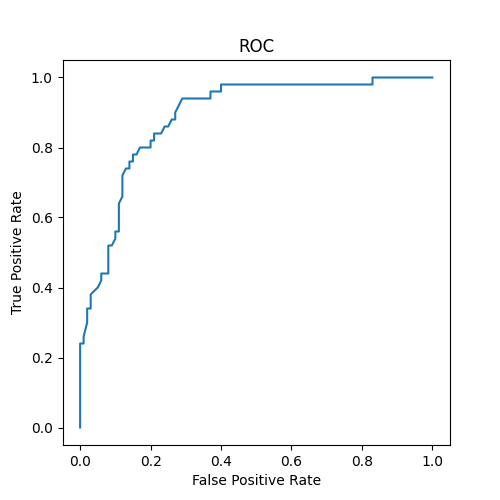
「virginica でないにも関わらず、virginica と予測してしまう確率を0.2 以下に抑えた時に、virginicaのデータをvirginica と正しく予測する確率は最大でどの程度か」
要するにFalse Positve Rate <= 0.2の時にTrue Positive Rateの最大値は?と言い換えることが出来る。
プログラム内部でこのような出力をしている
FPR = 0.18 TPR = 0.8
FPR = 0.2 TPR = 0.8
FPRが0.2近辺ではだいたいTPRは0.8なので、正しく予測する確率は80%となる
AUC
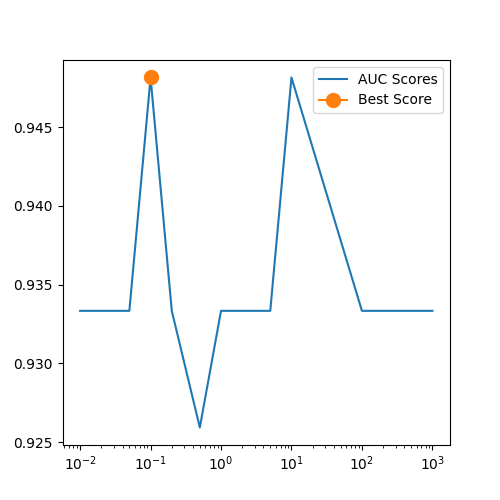
正則化パラメータを動かしてAUCをプロットするのが最後の問題。
まず準備としてデータを3つに分けている。
- X_tr_val,y_tr_val:120個
- 一番良いCが決まった後に再度SVCするためのデータ
- X_test,y_test:30個
- 最後のaccuracy_score算出のためのデータ
- X_tr,y_tr:96個
- 最適なCを求めるための訓練データ
- X_val,y_val:24個
- AUC Scoreを出すためのデータ
predict_probaとdecision_function
講義ではAUCの部分でpredict_probaを利用しているが、predict_probaは時々間違えるという記事をちらほら見かけたのでdecision_functionを利用している。
https://qiita.com/rawHam/items/3bcb6a68a533f2b82a85
過去の投稿
筑波大学の機械学習講座:課題のPythonスクリプト部分を作りながらsklearnを勉強する (1)
筑波大学の機械学習講座:課題のPythonスクリプト部分を作りながらsklearnを勉強する (2)
筑波大学の機械学習講座:課題のPythonスクリプト部分を作りながらsklearnを勉強する (3)
筑波大学の機械学習講座:課題のPythonスクリプト部分を作りながらsklearnを勉強する (4)
筑波大学の機械学習講座:課題のPythonスクリプト部分を作りながらsklearnを勉強する (5)
筑波大学の機械学習講座:課題のPythonスクリプト部分を作りながらsklearnを勉強する (6)
筑波大学の機械学習講座:課題のPythonスクリプト部分を作りながらsklearnを勉強する (7) 最急降下法を自作
筑波大学の機械学習講座:課題のPythonスクリプト部分を作りながらsklearnを勉強する (8) 確率的最急降下法を自作
筑波大学の機械学習講座:課題のPythonスクリプト部分を作りながらsklearnを勉強する (9)
https://github.com/legacyworld/sklearn-basic
https://ocw.tsukuba.ac.jp/course/systeminformation/machine_learning/


