筑波大学:機械学習講座
https://ocw.tsukuba.ac.jp/course/systeminformation/machine_learning/
こちらの講座は実際に筑波大学の学生向けに行われたものが公開されているので非常にわかりやすい。
この講座の課題でちょくちょくPythonを使って解析する問題があるのだが、この講座はプログラム部分は範囲外のため特に説明も無いしプログラムそのものも提供されない。
動画内でソースコードはちらっと見えるがそのままでは自分で動かせないのですっきりしない。
なので自分で同じ結果を出すプログラムを作ってみることにした。
筆者のレベル
PythonとかPandasは知ってるけど、scikit-learnって何よ?っていうレベルから始めている。
ただ大学時代に最小二乗法等は使用していたため、数学的な前提は問題ない(行列の計算部分は忘れていたが)
環境
いつでもどこでも使えるようにDockerの上で動かしている。matplotをそのまま表示できないので、pngに落としている。
こちらのgithubから落とせば環境は整う。
https://github.com/legacyworld/sklearn-basic
.devcontainer以下はVS codeでRemote Developmentする場合に必要なものである。
課題 1.4 wineデータの回帰
課題の1.4が最初のプログラムである。
解説は第2回(1)重回帰の49分頃からである。43分あたりからも解説しているが、プログラム内でスケーリングを行っていないため結果は正しくない。
import pandas as pd
import numpy as np
import matplotlib.pyplot as plt
from sklearn import linear_model
from sklearn.metrics import mean_squared_error
from sklearn import preprocessing

# scikit-learnよりワインのデータをインポートする
df= pd.read_csv('winequality-red.csv',sep=';')
# 目標値であるqualityが入っているので落としたdataframeを作る
df1 = df.drop(columns='quality')
y = df['quality'].values.reshape(-1,1)
scaler = preprocessing.StandardScaler)
# 単回帰 列ごとに行う
for column in df1:
    x = df[column]
    fig = plt.figure()
    plt.xlabel(column)
    plt.ylabel('quality')
    plt.scatter(x,y)
    # matrixへ変換
    X = x.values.reshape(-1,1)
    # スケーリング
    X_fit = scaler.fit_transform(X)
    model = linear_model.LinearRegression()
    model.fit(X_fit,y)
    plt.plot(x,model.predict(X_fit))
    mse = mean_squared_error(model.predict(X_fit),y)
    print(f"quality = {model.coef_[0][0]} * {column} + {model.intercept_[0]}")
    print(f"MSE: {mse}")
    filename = f"{column}.png"
    fig.savefig(filename)

# 重回帰
X = df1.values
X_fit = scaler.fit_transform(X)
model = linear_model.LinearRegression()
model.fit(X_fit,y)
print(model.coef_,model.intercept_)
sklearnを使ったら必ず詰まるであろうところが、マトリックスにするところ。
必ずこのエラーを見ることになると思う。
ValueError: Expected 2D array, got 1D array instead:
array=[7.4 7.8 7.8 ... 6.3 5.9 6. ].
Reshape your data either using array.reshape(-1, 1) if your data has a single feature or array.reshape(1, -1) if it contains a single sample.
何が問題なのか見てみる。
X = x.values.reshape(-1,1)
print(f"変換前は{x.values}")
print(f"変換後は{X}")
とすると以下のような出力となる。
変換前は[ 9.4  9.8  9.8 ... 11.  10.2 11. ]
変換後は[[ 9.4]
 [ 9.8]
 [ 9.8]
 ...
 [11. ]
 [10.2]
 [11. ]]
2次元配列に変わってます。
後は実際に計算を行って結果を出している。
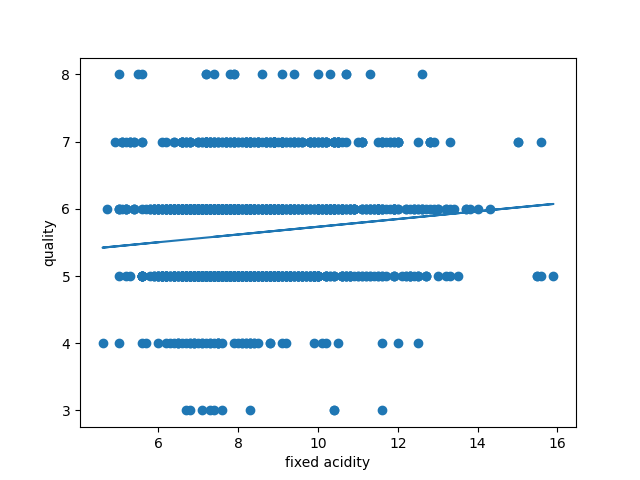
グラフは特徴量の名前でPNGで保存している(fixed acidity.png等)
最後の重回帰の部分は自分の勉強のために追加している。
以下が実行結果
[root@316e28b88f45 workspace]# python test.py
quality = 0.10014898994431619 * fixed acidity + 5.6360225140712945
MSE: 0.6417307196439609
quality = -0.3153038874367112 * volatile acidity + 5.6360225140712945
MSE: 0.5523439983981253
quality = 0.18275435128971876 * citric acid + 5.6360225140712945
MSE: 0.6183613869155018
quality = 0.0110857825729839 * residual sugar + 5.6360225140712945
MSE: 0.6516376452555722
quality = -0.10406844138289646 * chlorides + 5.6360225140712945
MSE: 0.6409302993389623
quality = -0.04089548993375638 * free sulfur dioxide + 5.6360225140712945
MSE: 0.6500880987339057
quality = -0.14943458718129748 * total sulfur dioxide + 5.6360225140712945
MSE: 0.6294298439847829
quality = -0.14121524469500035 * density + 5.636022514071298
MSE: 0.6318187944965589
quality = -0.046607526450713255 * pH + 5.6360225140712945
MSE: 0.6495882783089737
quality = 0.20295710475205553 * sulphates + 5.6360225140712945
MSE: 0.6105689534614908
quality = 0.3844171096080022 * alcohol + 5.6360225140712945
MSE: 0.503984025671457
[[ 0.04349735 -0.19396667 -0.03555254  0.02301871 -0.08818339  0.04560596
  -0.10735582 -0.03373717 -0.06384247  0.1552765   0.29424288]] [5.63602251]
どのデータを使っても切片は同じ。特徴量(=x)が無い場合の推定値になるので、qualityの単純平均になる。
この結果から
- もっともよい予測を与えるモデル = MSEが最も小さいモデル = alcohol
- Qualityの予測に最も正の影響が強い = alcohol (0.384)
- アルコール度数が高ければよいとは限らないだろうけど・・
- Qualityの予測に最も負の影響が強い = volatile acidity (-0.315)
- volatile acidityは揮発酸というものでワインに悪影響を与える
- http://www.worldfinewines.com/winefaults2.html
少しだけワインの勉強にもなる課題でした。