はじめに
TensorFlow2 + Keras を利用した画像分類(Google Colaboratory 環境)についての勉強メモ(第4弾)です。題材は、ド定番である手書き数字画像(MNIST)の分類です。
- TensorFlow2 + Keras による画像分類に挑戦 シリーズ
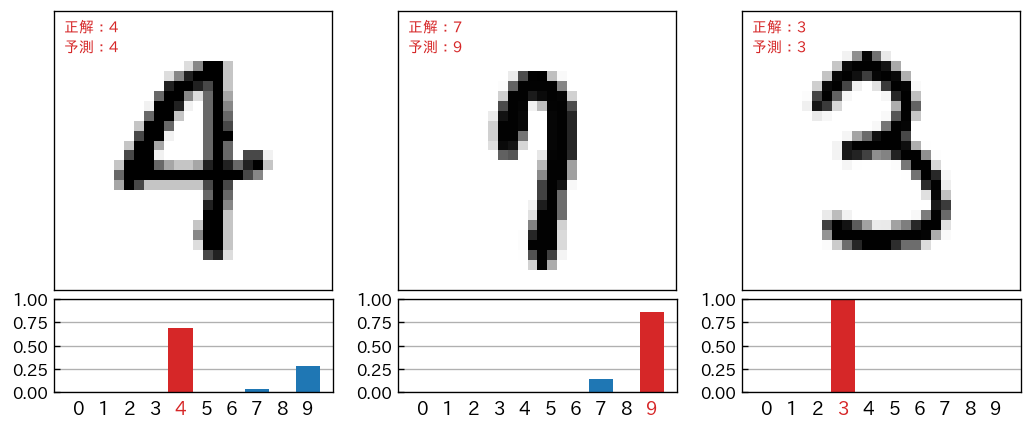
前回は、取得したMNISTデータ(手書き文字データ)を matplotlib を使って画像化しました。今回は、学習済みモデルを使っての「予測」にトライします。また、次のような予測に関するレポート画像の生成も行ないます。
おさらい
第1回 で示した「とりあえず動かす」ためのサンプルコードは、以下のようなものでした。
import tensorflow as tf

# (1) 手書き数字画像のデータセット(MNIST)をダウンロード、変数に格納
mnist = tf.keras.datasets.mnist
(x_train, y_train), (x_test, y_test) = mnist.load_data()

# (2) データの正規化(前処理)
x_train, x_test = x_train / 255.0, x_test / 255.0

# (3) NNモデルの構築
model = tf.keras.models.Sequential([
  tf.keras.layers.Flatten(input_shape=(28, 28)),
  tf.keras.layers.Dense(128, activation='relu'),
  tf.keras.layers.Dropout(0.2),
  tf.keras.layers.Dense(10, activation='softmax')
])

# (4) モデルのコンパイル(学習方法に関する設定も含む)
model.compile(optimizer='adam',loss='sparse_categorical_crossentropy',metrics=['accuracy'])

# (5) モデルの学習(トレーニング用の入力データ&正解データを使用)
model.fit(x_train, y_train, epochs=5)

# (6) モデルの評価(テスト用の入力データ&正解データを使用)
model.evaluate(x_test,  y_test, verbose=2)
このプロセスの (6) model.evaluate(...) では、テスト用の入力データ x_test に対する「学習済みモデルを使った予測(分類)」が行なわれて、その予測結果について正解データ y_test による答え合わせがされて loss: 0.0766 - accuracy: 0.9762 といったモデル性能を評価した結果が出力されました。
ただ、この model.evaluate(...) では、具体的に「どんな入力データに対して、どんな予測(分類)が下されたのか?」が確認できません。それを確認するためには、次で紹介する predict_classes(...) あるいは predict(...) を使用します。
予測(分類)の実行と結果取得
任意の手書き文字データに対して、学習済みモデルを使って予測を行なった結果を得るためには predict_classes(...) を使用します。
例として、テスト用入力データの先頭から5枚分 x_test[:5] について、予測と、その結果を取得してみたいと思います。また、正解データ y_test と比較して答え合わせもします。
# x_test の予測(分類)
s = model.predict_classes( x_test[:5] )
print(s) # 実行結果 -> [7 2 1 0 4]

# y_test と比較して答え合わせ
a = y_test[:5]
print(a)    # 実行結果 -> [7 2 1 0 4]
print(a==s) # 実行結果 -> [True  True  True  True  True]
predict_classes(...) の引数に、numpy.ndarray 型で入力データの配列を与えると、予測結果が numpy.ndarray 型で与えられます。
なお、単体データ(1枚の画像)だけを予測(分類)するときには、次のようにします。
import numpy as np

target = x_test[0] # 単体の入力データを用意

s = model.predict_classes( np.array([target]) )
# s = model.predict_classes( target.reshape([1,28,28]) ) # こちらでもOK

print(s[0]) # 実行結果 -> 7
予測(分類)の詳細
predict_classes(...) の戻値は、予測(分類)結果を与えてくれましたが、その詳細も知りたい場合があります。つまり、上記の例でいえば「7」という結論を得る一歩前の段階の情報、例えば**「1」と考えられる可能性はゼロだったのか**、あるいは**「1」と考えられる可能性も結構高かったが僅差で「7」という結論になったのか?**という情報です。
この情報を得るためには、predict(...) を使います。戻値は、0~9 のどのカテゴリに分類できるかの「確信の度合い」のような情報になります(NNモデルの出力層の値)。値は 0.0 ~ 1.0 の範囲をとり、1.0 に近いほど、当該カテゴリに分類できる確信度合いが強いと判断します。
具体的に見てみたほうが分かりやすいと思います。先の例で確認したように x_test[0] は「7」と予測(分類)されましたが、それは、次のような出力層の出力値から判断されています。
import numpy as np
target = x_test[0]
s = model.predict( np.array([target]) )

print(s[0]) # 実行結果 -> [2.8493771e-08 2.6985079e-08 8.6063519e-06 3.0076344e-04 1.7041087e-10
            #              1.2664158e-07 1.4036484e-13 9.9965346e-01 4.4914569e-07 3.6610269e-05]

# 小数第2位までの表示に整形
s =  [ f'{s:.2f}' for s in s[0]]
print(s)    # 実行結果 -> ['0.00', '0.00', '0.00', '0.00', '0.00', '0.00', '0.00', '1.00', '0.00', '0.00']
最後の print(s) の出力ですが、0番目から数えると、7番目が 1.00 になっています。つまり、NNモデルは強い確信をもって「7」という予測分類を行なっていることが分かります。
ただ、この例では、あまり面白くないので・・・、やや微妙な手書き文字を使ってみます。x_test[1003] は、画像化すると次のようなデータです(y_test[1003] により確認できますが、これは「5」が正解になります)。
この x_test[1003] について、predict(...) の戻値を取得して確認すると次のようになります。
import numpy as np
target = x_test[1003]
s = model.predict( np.array([target]) )
s =  [ f'{s:.2f}' for s in s[0]] # 整形
print(s)
# 実行結果 -> ['0.00', '0.00', '0.00', '0.27', '0.00', '0.73', '0.00', '0.00', '0.01', '0.00']
NNモデルは、強い確信をもっての「5」ではなく、もしかすると「3」かもしれないという可能性をもって結論をだしていることが分かります。
なお、次のように、predict(...) の argmax() は、predict_classes(...) に一致します。 argmax() は、配列のなかで最も大きな値を持つ要素のインデックス番号を返します。
import numpy as np
target = x_test[1003]
s = model.predict( np.array([target]) )
p = model.predict_classes( np.array([target]) )
print( s.argmax() == p[0] )  # 実行結果 -> True
入力データと予測結果のレポート画像
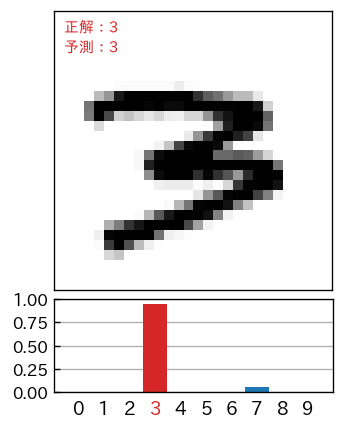
入力データ(つまり手書き数字イメージ)と、学習済みモデルの予測出力グラフをあわせた次のようなレポートを matplotlib を利用して作成していきます。
!pip install japanize-matplotlib
import japanize_matplotlib
import numpy as np
import matplotlib.pyplot as plt
import matplotlib.patheffects as pe
import matplotlib.transforms as ts

idn = 1601 # 対象のテスト用データのインデックス(0~9999)

s_test = model.predict(x_test) # 学習済みモデルを使って予測

fig, ax = plt.subplots(nrows=2,figsize=(3,4.2), dpi=120,
                       gridspec_kw={'height_ratios': [3, 1]})

plt.subplots_adjust(hspace=0.05) # 上下のグラフの間隔

# 上側に手書き数字のイメージを表示
ax[0].imshow(x_test[idn],interpolation='nearest',vmin=0.,vmax=1.,cmap='Greys')
ax[0].tick_params(axis='both', which='both', left=False,
                  labelleft=False, bottom=False, labelbottom=False)

# 正解値と予測値を左上に表示
t = ax[0].text(0.5, 0.5, f'正解:{y_test[idn]}',
               verticalalignment='top', fontsize=9, color='tab:red')
t.set_path_effects([pe.Stroke(linewidth=2, foreground='white'), pe.Normal()])
t = ax[0].text(0.5, 2.5, f'予測:{s_test[idn].argmax()}',
               verticalalignment='top', fontsize=9, color='tab:red')
t.set_path_effects([pe.Stroke(linewidth=2, foreground='white'), pe.Normal()])

# 下側にNN予測出力を表示
b = ax[1].bar(np.arange(0,10),s_test[idn],width=0.95)
b[s_test[idn].argmax()].set_facecolor('tab:red') # 最大項目を赤色に

# X軸設定
ax[1].tick_params(axis='x',bottom=False)
ax[1].set_xticks(np.arange(0,10))
t = ax[1].set_xticklabels(np.arange(0,10),fontsize=11)
t[s_test[idn].argmax()].set_color('tab:red') # 最大項目を赤色に

offset = ts.ScaledTranslation(0, 0.03, plt.gcf().dpi_scale_trans)
for label in ax[1].xaxis.get_majorticklabels() :
    label.set_transform(label.get_transform() + offset)

# Y軸設定
ax[1].tick_params(axis='y',direction='in')
ax[1].set_ylim(0,1)
ax[1].set_yticks(np.linspace(0,1,5))
ax[1].set_axisbelow(True)
ax[1].grid(axis='y')
次回
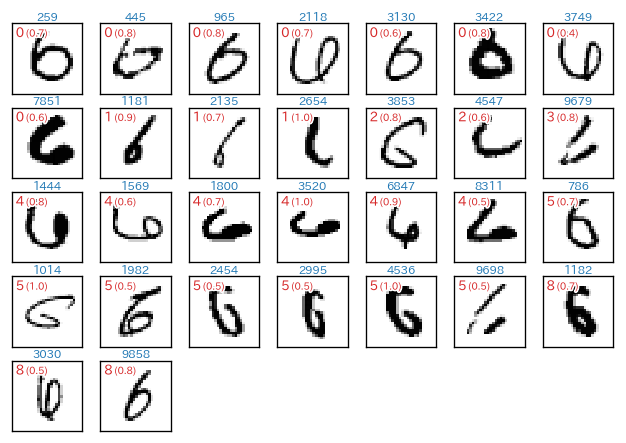
- 次回は、以下に示すように、予測(分類)に失敗しているのはどのような手書き数字なのか、そこではどのような分類間違いしているのか(「7」と「1」は間違えやすい?)といったことを見ていきたいと思います。matplotlib が活躍します。


