Qiitaを分析したくなったので、pandasの勉強がてら、色々調べてみた。1
TL;DR
- 500Contributionあれば上位1%の発信力
- バズらせたいなら、月曜日に投稿すべし
- Contributionの獲得難易度は、ピーク時の5倍以上
- エンジニアスカウターっていうQiita戦闘力計測サイト作ったよ
ユーザ分析
DataFrame
用意したDataFrameはこんなやつ。
| user_name | contribution | articles_count | hatena_count | |
|---|---|---|---|---|
| 0 | tmknom | 6273 | 11 | 2809 |
| 1 | Qiita | 8155 | 5 | 915 |
QiitaでのContribution数と記事数だけでなく、はてブ数も加味している。
ユーザ数
用意したDataFrameの行数を出力して、全ユーザ数、投稿したことのあるユーザ数、Contributionしたことのあるユーザ数、はてなブックマークでブックマークされたことのあるユーザ数を算出してみる。
df.index.size # 全ユーザ
df.query( 'articles_count > 0' ).index.size # 投稿ユーザ
df.query( 'contribution > 0' ).index.size # Contributionユーザ
df.query( 'hatena_count > 0' ).index.size # はてブられユーザ
| ユーザ数 | 比率 | |
|---|---|---|
| 全ユーザ | 208,705 | 100.0% |
| 投稿ユーザ | 31,904 | 15.3% |
| Contributionユーザ | 30,432 | 14.6% |
| はてブられユーザ | 20,603 | 9.9% |
投稿しているのは15%ということで、Qiitaに記事を書いてるだけで、ちょっとレアである。
基本統計量
pandasでは、describeメソッド一個で基本統計量が出せる。ここでは、ソフトウェアのための統計学にならい、99パーセンタイルなども算出してみた。
p = [0.25, 0.5, 0.75, 0.9, 0.95, 0.99, 0.999]
df.describe(percentiles=p)
| Contribution数 | 投稿数 | はてブ数 | |
|---|---|---|---|
| count | 208705.000000 | 208705.000000 | 208705.000000 |
| mean | 24.335612 | 1.372521 | 6.626387 |
| std | 290.758000 | 14.951549 | 105.475602 |
| min | 0.000000 | 0.000000 | 0.000000 |
| 25% | 0.000000 | 0.000000 | 0.000000 |
| 50% | 0.000000 | 0.000000 | 0.000000 |
| 75% | 0.000000 | 0.000000 | 0.000000 |
| 90% | 9.000000 | 2.000000 | 0.000000 |
| 95% | 50.000000 | 6.000000 | 7.000000 |
| 99% | 500.960000 | 28.000000 | 113.000000 |
| 99.9% | 3148.400000 | 99.000000 | 1138.072000 |
| max | 37316.000000 | 5550.000000 | 18320.000000 |
この結果をふまえると、9Contributionで上位10% に食い込むことができる。さらに、500Contributionあれば上位1% に入れる。1つ記事がバズると手に届くレベルだ。
そんなわけで、500Contribution以上あるユーザは、「自分、ITエンジニアの中で、上位1%の発信力がありますけど」とか言いながら、給与交渉したり、転職したりすればいいんじゃないだろうか。(適当
分布
pandasのqueryメソッドを使うと、簡単に任意の条件のデータを抽出できる。
df.query( 'contribution >= 1' ).index.size
Contribution数、はてブ数、記事数でそれぞれ分布を出してみたので、圧倒的ふーん感をお楽しみ頂きたい。
Contribution数分布
| Contribution数 | ユーザ数 | 比率 |
|---|---|---|
| 1 以上 | 30,432 | 14.6% |
| 10 以上 | 20,266 | 9.7% |
| 100 以上 | 7,087 | 3.4% |
| 500 以上 | 2,092 | 1.0% |
| 1,000 以上 | 984 | 0.5% |
| 5,000 以上 | 96 | 0.05% |
| 10,000 以上 | 32 | 0.02% |
はてブ数分布
| はてブ数 | ユーザ数 | 比率 |
|---|---|---|
| 1 以上 | 20,603 | 9.9% |
| 10 以上 | 9,071 | 4.3% |
| 100 以上 | 2,291 | 1.1% |
| 500 以上 | 553 | 0.3% |
| 1,000 以上 | 251 | 0.1% |
| 5,000 以上 | 14 | 0.007% |
記事数分布
| 記事数 | ユーザ数 | 比率 |
|---|---|---|
| 1 以上 | 31,904 | 15.3% |
| 10 以上 | 7,386 | 3.5% |
| 50 以上 | 805 | 0.4% |
| 100 以上 | 207 | 0.1% |
| 500 以上 | 5 | 0.002% |
投稿ユーザ基本統計量
今度は趣向を変えて、記事投稿をしていないユーザを除外した場合についても見てみよう。
p = [0.25, 0.5, 0.75, 0.9, 0.95, 0.99, 0.999]
df.query( 'articles_count > 0' ).describe(percentiles=p)
| Contribution数 | 投稿数 | はてブ数 | |
|---|---|---|---|
| count | 31904.000000 | 31904.000000 | 31904.000000 |
| mean | 158.854720 | 8.978561 | 43.334253 |
| std | 728.804397 | 37.337983 | 266.809524 |
| min | 0.000000 | 1.000000 | 0.000000 |
| 25% | 4.000000 | 1.000000 | 0.000000 |
| 50% | 19.000000 | 3.000000 | 2.000000 |
| 75% | 81.000000 | 9.000000 | 12.000000 |
| 90% | 316.000000 | 20.000000 | 62.000000 |
| 95% | 650.000000 | 33.000000 | 159.000000 |
| 99% | 2389.910000 | 80.000000 | 810.850000 |
| 99.9% | 9913.409000 | 232.097000 | 3331.864000 |
| max | 37316.000000 | 5550.000000 | 18320.000000 |
記事を投稿している人だけに絞ると、一人あたりの記事数は平均9だった。中央値に至っては3記事ということで、そもそも発信している人数も少ないのだが、一人あたりの発信している数も少ない。もちろんQiitaじゃなくて、個人のブログなどに書いてる人もいるだろうが、正直、自分の感覚値よりはるかに少ない印象である。
ユーザランキング
Qiita戦闘力 = Contribution数 + はてブ数
はてブのデータがあるので、Contributionとの合計を「Qiita戦闘力」という定義にして、100人分のランキングを出してみた。
| 順位 | ユーザ名 | Qiita戦闘力 | Contribution数 | はてブ数 | 記事数 |
|---|---|---|---|---|---|
| 1 | @hirokidaichi | 55,636 | 37,316 | 18,320 | 37 |
| 2 | @jnchito | 46,927 | 36,374 | 10,553 | 202 |
| 3 | @icoxfog417 | 41,388 | 29,877 | 11,511 | 149 |
| 4 | @suin | 32,753 | 23,844 | 8,909 | 729 |
| 5 | @mizchi | 31,457 | 19,556 | 11,901 | 234 |
| 6 | @shu223 | 26,321 | 20,659 | 5,662 | 186 |
| 7 | @yuku_t | 25,689 | 17,947 | 7,742 | 197 |
| 8 | @KeithYokoma | 23,416 | 18,696 | 4,720 | 142 |
| 9 | @opengl-8080 | 23,206 | 17,868 | 5,338 | 248 |
| 10 | @mpyw | 22,694 | 18,128 | 4,566 | 267 |
| 11 | @awakia | 20,582 | 16,232 | 4,350 | 153 |
| 12 | @kazunori279 | 20,207 | 11,965 | 8,242 | 43 |
| 13 | @cognitom | 19,235 | 14,072 | 5,163 | 96 |
| 14 | @mono0926 | 18,630 | 15,099 | 3,531 | 94 |
| 15 | @kenju | 18,596 | 17,503 | 1,093 | 120 |
| 16 | @haminiku | 17,829 | 13,377 | 4,452 | 72 |
| 17 | @muran001 | 17,407 | 13,479 | 3,928 | 34 |
| 18 | @koher | 17,342 | 12,759 | 4,583 | 64 |
| 19 | @appwatcher | 17,283 | 11,886 | 5,397 | 60 |
| 20 | @b4b4r07 | 17,233 | 13,666 | 3,567 | 57 |
| 21 | @zaru | 16,649 | 12,413 | 4,236 | 116 |
| 22 | @rana_kualu | 16,590 | 11,271 | 5,319 | 214 |
| 23 | @kawasima | 16,256 | 10,513 | 5,743 | 81 |
| 24 | @shibukawa | 15,743 | 9,441 | 6,302 | 102 |
| 25 | @yimajo | 15,451 | 11,256 | 4,195 | 149 |
| 26 | @edo_m18 | 15,243 | 13,063 | 2,180 | 372 |
| 27 | @susieyy | 14,604 | 11,769 | 2,835 | 50 |
| 28 | @kenmatsu4 | 14,570 | 10,685 | 3,885 | 66 |
| 29 | @joker1007 | 14,375 | 9,760 | 4,615 | 105 |
| 30 | @tadsan | 13,531 | 9,665 | 3,866 | 175 |
| 31 | @uasi | 13,499 | 10,066 | 3,433 | 117 |
| 32 | @hshimo | 13,084 | 10,518 | 2,566 | 307 |
| 33 | @ynakayama | 12,757 | 10,243 | 2,514 | 190 |
| 34 | @t_nakayama0714 | 12,491 | 8,537 | 3,954 | 36 |
| 35 | @takeharu | 12,090 | 10,383 | 1,707 | 18 |
| 36 | @zembutsu | 11,891 | 8,119 | 3,772 | 87 |
| 37 | @kawaz | 11,778 | 8,522 | 3,256 | 146 |
| 38 | @hkusu | 11,657 | 10,001 | 1,656 | 210 |
| 39 | @sion_cojp | 11,633 | 8,505 | 3,128 | 41 |
| 40 | @usagimaru | 11,308 | 9,063 | 2,245 | 176 |
| 41 | @tukiyo3 | 11,304 | 9,602 | 1,702 | 1,570 |
| 42 | @Quramy | 11,175 | 8,635 | 2,540 | 90 |
| 43 | @vvakame | 11,166 | 7,990 | 3,176 | 51 |
| 44 | @kidach1 | 11,155 | 9,904 | 1,251 | 85 |
| 45 | @tatesuke | 10,903 | 7,147 | 3,756 | 40 |
| 46 | @tonkotsuboy_com | 10,838 | 8,818 | 2,020 | 114 |
| 47 | @Hironsan | 10,693 | 8,501 | 2,192 | 48 |
| 48 | @syui | 10,513 | 7,630 | 2,883 | 215 |
| 49 | @Jxck_ | 10,471 | 7,150 | 3,321 | 62 |
| 50 | @gogotanaka | 10,255 | 6,815 | 3,440 | 57 |
| 51 | @okappy | 10,207 | 8,257 | 1,950 | 29 |
| 52 | @y_hokkey | 10,103 | 7,676 | 2,427 | 60 |
| 53 | @tag1216 | 10,040 | 7,730 | 2,310 | 104 |
| 54 | @jacksuzuki | 9,933 | 7,189 | 2,744 | 5 |
| 55 | @amay077 | 9,655 | 7,122 | 2,533 | 263 |
| 56 | @kaiinui | 9,507 | 7,356 | 2,151 | 47 |
| 57 | @yuya_presto | 9,492 | 7,208 | 2,284 | 40 |
| 58 | @tmknom | 9,195 | 6,379 | 2,816 | 11 |
| 59 | @Qiita | 9,187 | 8,271 | 916 | 5 |
| 60 | @r7kamura | 9,159 | 5,935 | 3,224 | 56 |
| 61 | @tbpgr | 9,154 | 7,619 | 1,535 | 732 |
| 62 | @kazukichi | 9,078 | 7,772 | 1,306 | 35 |
| 63 | @armorik83 | 9,042 | 6,559 | 2,483 | 110 |
| 64 | @howdy39 | 8,891 | 6,644 | 2,247 | 59 |
| 65 | @TakahikoKawasaki | 8,846 | 6,077 | 2,769 | 24 |
| 66 | @magicant | 8,310 | 5,913 | 2,397 | 36 |
| 67 | @n0bisuke | 8,208 | 6,966 | 1,242 | 288 |
| 68 | @puriketu99 | 8,168 | 5,000 | 3,168 | 183 |
| 69 | @ukiuni@github | 8,021 | 6,064 | 1,957 | 68 |
| 70 | @mochizukikotaro | 8,012 | 6,227 | 1,785 | 246 |
| 71 | @yaotti | 7,961 | 6,206 | 1,755 | 151 |
| 72 | @disc99 | 7,770 | 5,956 | 1,814 | 26 |
| 73 | @ryounagaoka | 7,700 | 5,249 | 2,451 | 47 |
| 74 | @voluntas | 7,552 | 5,571 | 1,981 | 107 |
| 75 | @hidekuro | 7,411 | 5,628 | 1,783 | 83 |
| 76 | @daxanya1 | 7,326 | 5,757 | 1,569 | 30 |
| 77 | @koba04 | 7,311 | 5,708 | 1,603 | 38 |
| 78 | @chuck0523 | 7,262 | 5,337 | 1,925 | 44 |
| 79 | @tenntenn | 7,252 | 5,713 | 1,539 | 73 |
| 80 | @kuni-nakaji | 7,039 | 4,964 | 2,075 | 17 |
| 81 | @nonbiri15 | 6,986 | 5,389 | 1,597 | 247 |
| 82 | @hik0107 | 6,976 | 5,718 | 1,258 | 22 |
| 83 | @okmttdhr | 6,953 | 5,242 | 1,711 | 79 |
| 84 | @Hiraku | 6,725 | 5,031 | 1,694 | 129 |
| 85 | @koogawa | 6,709 | 5,617 | 1,092 | 65 |
| 86 | @hnakamur | 6,661 | 5,433 | 1,228 | 187 |
| 87 | @nekoneko-wanwan | 6,653 | 5,762 | 891 | 56 |
| 88 | @harukasan | 6,610 | 4,407 | 2,203 | 52 |
| 89 | @takahirom | 6,574 | 5,194 | 1,380 | 79 |
| 90 | @k0kubun | 6,571 | 5,114 | 1,457 | 61 |
| 91 | @Ted-HM | 6,519 | 4,997 | 1,522 | 16 |
| 92 | @pugiemonn | 6,491 | 5,614 | 877 | 269 |
| 93 | @futoase | 6,459 | 4,450 | 2,009 | 101 |
| 94 | @shizuma | 6,378 | 5,739 | 639 | 102 |
| 95 | @yuba | 6,363 | 4,167 | 2,196 | 89 |
| 96 | @akameco | 6,250 | 4,383 | 1,867 | 153 |
| 97 | @m-yamashita | 6,219 | 5,024 | 1,195 | 13 |
| 98 | @toshihirock | 6,206 | 4,918 | 1,288 | 199 |
| 99 | @hashrock | 6,189 | 4,797 | 1,392 | 26 |
| 100 | @zaburo | 6,169 | 5,402 | 767 | 233 |
トップ5あたりは正直、「つ、つよい…」っていう浅い感想しか出てこない。ちなみに、トップの@hirokidaichiさんのQiita戦闘力は、ドラゴンボールの戦闘力で例えるとリクームと同格である。
もう少し深掘りすべく、ここにランクインしているメンバだけで、記事投稿数を算出してみたところ、平均が134、中央値が86、という結果に。普通の人と比べると、圧倒的に量を書いていることが分かる。
記事投稿数
さすがに100人分は多いので、ここからはダイジェストということで、上位10人をランキング。
| 順位 | ユーザ名 | Qiita戦闘力 | Contribution数 | はてブ数 | 記事数 |
|---|---|---|---|---|---|
| 1 | @7of9 | 4,552 | 4,320 | 232 | 5,550 |
| 2 | @tukiyo3 | 11,304 | 9,602 | 1,702 | 1,570 |
| 3 | @tbpgr | 9,154 | 7,619 | 1,535 | 732 |
| 4 | @suin | 32,753 | 23,844 | 8,909 | 729 |
| 5 | @ohisama@github | 476 | 450 | 26 | 636 |
| 6 | @chen7897499 | 75 | 67 | 8 | 457 |
| 7 | @tcsh | 1,496 | 1,267 | 229 | 384 |
| 8 | @snaka | 3,689 | 3,214 | 475 | 375 |
| 9 | @edo_m18 | 15,243 | 13,063 | 2,180 | 372 |
| 10 | @hshimo | 13,084 | 10,518 | 2,566 | 307 |
@7of9さんがぶっちぎりの1位で、一人で5,000件以上の記事を投稿している。2位とも3倍の差をつけている。一体、どういうことなんだってばよ…。
Contribution平均打点
一記事あたりの平均Contribution数を算出してみた。2
一記事だけで、大ヒットになってる人が多かったので、ここでは、規定打席数(投稿数)が9以上3の人のみを対象とした。
| 順位 | ユーザ名 | 平均打点 | Contribution数 | 記事数 |
|---|---|---|---|---|
| 1 | @hirokidaichi | 1008.5405 | 37,316 | 37 |
| 2 | @tmknom | 579.9091 | 6,379 | 11 |
| 3 | @takeharu | 576.8333 | 10,383 | 18 |
| 4 | @tawago | 412.4 | 4,124 | 10 |
| 5 | @muran001 | 396.4412 | 13,479 | 34 |
| 6 | @m-yamashita | 386.4615 | 5,024 | 13 |
| 7 | @nori0620 | 372.5455 | 4,098 | 11 |
| 8 | @koitaro | 324.5 | 3,894 | 12 |
| 9 | @Ted-HM | 312.3125 | 4,997 | 16 |
| 10 | @kuni-nakaji | 292.0 | 4,964 | 17 |
首位打者の栄光は、@hirokidaichiさんに輝いた。地味に、筆者も2位にランクインしており、なかなか頑張ってるんじゃなかろうか。
はてブ平均打点
同様に、はてブでもやってみた。ただ、QiitaのContributionと、はてブの相関が高く、あまり代わり映えのしないメンツになってしまった。(ヒドイ言い草
| 順位 | ユーザ名 | 平均打点 | はてブ数 | 記事数 |
|---|---|---|---|---|
| 1 | @hirokidaichi | 495.1351 | 18,320 | 37 |
| 2 | @tmknom | 256.0 | 2,816 | 11 |
| 3 | @kazunori279 | 191.6744 | 8,242 | 43 |
| 4 | @nori0620 | 168.9091 | 1,858 | 11 |
| 5 | @tnj | 143.6667 | 1,724 | 12 |
| 6 | @yugui | 141.125 | 2,258 | 16 |
| 7 | @taiyop | 136.0 | 1,224 | 9 |
| 8 | @tawago | 135.4 | 1,354 | 10 |
| 9 | @saboyutaka | 127.875 | 2,046 | 16 |
| 10 | @make_now_just | 126.2222 | 1,136 | 9 |
ここでも、@hirokidaichiさんの強さが際立ち、三冠達成である。ちなみに、この方、エンジニアリング組織論への招待という書籍を最近出版されていて、この本もなかなかに読み応えがあってオススメである。
記事分析
DataFrame
こんな感じのDataFrameを用意した。
| posted_date | item_id | user_name | contribution | hatena_count |
|---|---|---|---|---|
| 2011-11-04 | c686397e4a0f4f11683d | Qiita | 6381 | 642 |
| 2016-01-21 | 303db2d1d928db720888 | tmknom | 2539 | 783 |
累計値
まずはどのくらい、Qiitaの記事が、世の中に貢献しているか見てみる。
df.agg({'item_id': 'count', 'contribution': 'sum', 'hatena_count': 'sum'})
| 合計記事数 | 合計Contribution数 | 合計はてブ数 |
|---|---|---|
| 289,874 | 4,864,342 | 1,335,242 |
年別累計値
ちょっとバラして、年別に集計。2018年については、4月中旬までのデータである。なお、Qiitaのサービス提供開始日は2011年9月16日らしい。
df_y= df.set_index([df.index.year, df.index])
df_y.index.names = ['posted_year', 'posted_date']
df_y.groupby('posted_year').agg({'user_name': lambda x: x.nunique(), 'item_id': 'count', 'contribution': 'sum', 'hatena_count': 'sum'})
| 年 | 記事数 | 投稿ユーザ数 | Contribution数 | はてブ数 |
|---|---|---|---|---|
| 2011 | 579 | 154 | 10,853 | 1,819 |
| 2012 | 6,744 | 1,205 | 121,245 | 36,319 |
| 2013 | 15,798 | 2,919 | 401,529 | 93,172 |
| 2014 | 39,914 | 6,687 | 1,239,310 | 309,903 |
| 2015 | 56,716 | 10,723 | 1,277,125 | 291,687 |
| 2016 | 70,891 | 14,481 | 1,105,809 | 300,471 |
| 2017 | 75,434 | 17,800 | 566,944 | 241,953 |
| 2018 | 23,798 | 7,848 | 141,527 | 59,918 |
アレ?なんかContribution数が、2017年になって半減してる…。
このデータ自体は、その年に書かれた記事が、2018年4月までの間に、どれだけContributionしたかというデータなので、昔の記事のほうが値は大きくなりやすいのだが、それにしてもちょっと減りすぎじゃ…。
投稿ユーザ数推移
月別の推移
さらに分解して、投稿ユーザ数の推移を見てみる。グラフ描画にはseabornを使ってみた。
df_ym= df.set_index([df.index.year, df.index.month, df.index])
df_ym.index.names = ['posted_year', 'posted_month', 'posted_date']
grouped = df_ym.groupby(['posted_year', 'posted_month']).agg({'user_name': lambda x: x.nunique()})
sns.pointplot(x=grouped.index, y=grouped['user_name'], markers=[""], color='red')
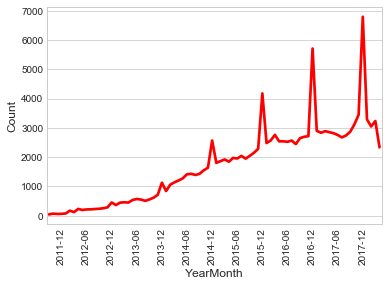
基本的に順調に増加している。アドベントカレンダー砲の威力は凄まじく、12月だけ他の月の倍ぐらい投稿ユーザ数が増えている、というのが特徴的。
移動平均
12月だけ異常なので、12ヶ月の移動平均でもプロットしてみた。
rolling = grouped.rolling(window=12).mean()
sns.pointplot(x=rolling.index, y=rolling['user_name'], markers=[""], color='red')
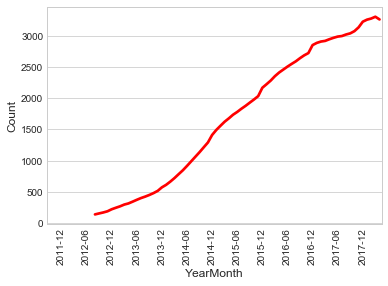
順調にQiitaに投稿する人の数は増えているようだ。
記事投稿数推移
月別の推移
次に、記事投稿数の推移を見てみる。
grouped = df_ym.groupby(['posted_year', 'posted_month']).agg({'item_id': 'count'})
sns.pointplot(x=grouped.index, y=grouped['item_id'], markers=[""], color='purple')
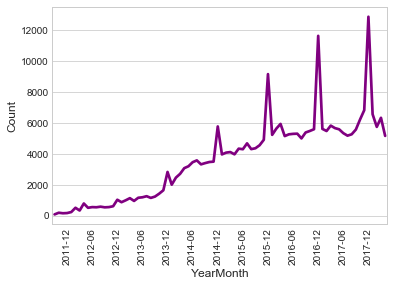
やはり、アドベントカレンダーの影響で、12月の記事数が飛び抜けて多い。
移動平均
先程同様、12ヶ月の移動平均も出してみよう。
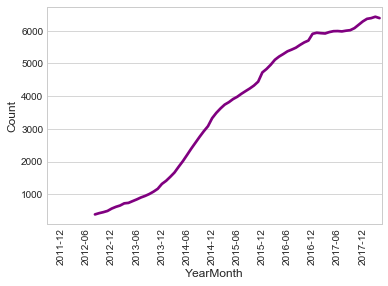
投稿される記事の数も、順調に伸びてるようだ。
Contribution数推移
月別の推移
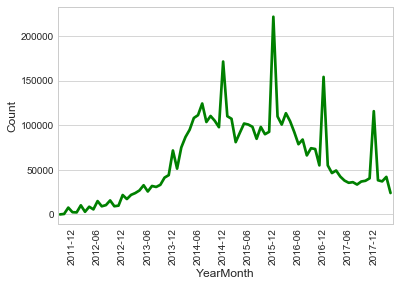
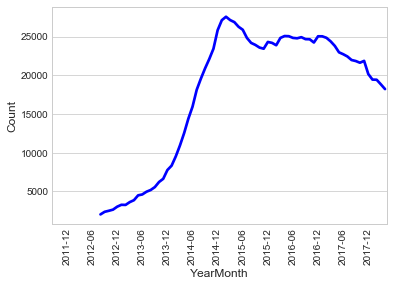
問題のContribution数の推移を見てみよう。
grouped = df.groupby('year_month').agg({'contribution': sum})
sns.pointplot(x=grouped.index, y=grouped['contribution'], markers=[""], color='green')
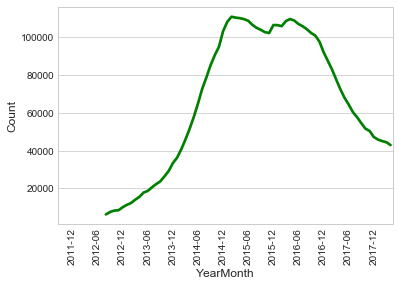
移動平均
12ヶ月の移動平均でもプロットしてみる。
2016年詳細
ターニングポイントは2016年である。詳細な数値を出してみよう。
| 月 | Contribution数 |
|---|---|
| 1 | 107,679 |
| 2 | 98,781 |
| 3 | 111,455 |
| 4 | 102,500 |
| 5 | 90,635 |
| 6 | 77,270 |
| 7 | 82,386 |
| 8 | 64,438 |
| 9 | 72,462 |
| 10 | 71,804 |
| 11 | 53,645 |
| 12 | 150,423 |
細かく数字を見てみると、2016年5月ごろから下落傾向を示しはじめ、2016年11月に大きく落ち込んでいる。5月のほうは理由がよく分からないが、11月については、「ストック」ではなく「いいね」をContributionの算出基準にするという仕様変更の時期と合致している。
その後もじわじわ下がり、2018年3月の結果は42,000程度であった。二年前と比較すると明確にContributionを獲得しづらく、数値的な意味での承認欲求は得づらくなっているようだ(´・ω・`)
平均Contribution数推移
今度は一記事あたりの平均Contribution数を見てみよう。
grouped = df_ym.groupby(['posted_year', 'posted_month']).agg({'item_id': 'count', 'contribution':'sum'})
grouped['rate'] = grouped['contribution'] / grouped['item_id']
sns.pointplot(x=grouped.index, y=grouped['rate'], markers=[""], color='green')
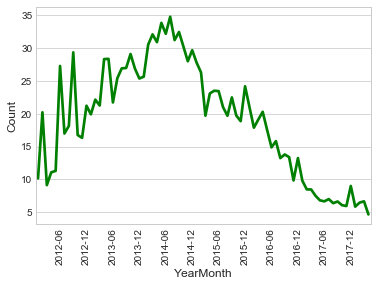
現在は、一記事あたり平均6Contributionなのに対し、2014年4月は34Contributionであり、実にピーク時の5.5倍も差が開いている。Contribution数の総和が下落傾向なのに、投稿記事数は右肩上がりなので、Contributionの獲得難易度が大きく上がっているようだ。
みんなもっと気軽に「いいね」して!
はてブ数推移
月別の推移
はてブも同様に見ておこう。
grouped = df.groupby('year_month').agg({'hatena_count': sum})
sns.pointplot(x=grouped.index, y=grouped['hatena_count'], markers=[""], color='blue')
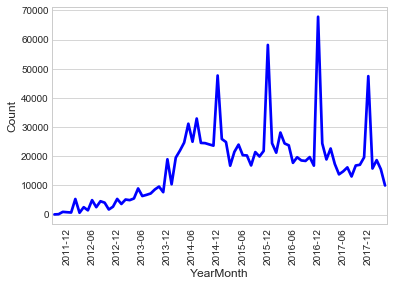
やや減少傾向にあるが、なんとか踏ん張ってる印象。
移動平均
12ヶ月の移動平均。
平均はてブ数推移
今度は一記事あたりの平均はてブ数を見てみよう。
grouped = df_ym.groupby(['posted_year', 'posted_month']).agg({'item_id': 'count', 'contribution':'sum'})
grouped['rate'] = grouped['contribution'] / grouped['item_id']
sns.pointplot(x=grouped.index, y=grouped['rate'], markers=[""], color='blue')
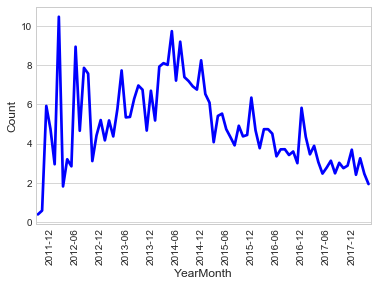
現在は、一記事あたり平均2.5はてブなのに対し、2014年5月は9.8はてブであり、ピーク時の3.9倍の差がある。
曜日別ランキング
どの曜日に出すとよりバズりやすいのか?結論を先にいうと、月曜日である。
直近一年ぐらいをスコープに算出した結果が下記である。ここでは省略するが、4半期単位や月単位でみても、あまり傾向は変わらなかった。
Contribution数
2018年
| 曜日 | Contribution数 | 記事数 | 平均Contribution数 |
|---|---|---|---|
| 月 | 25,798 | 3,292 | 7.836574 |
| 火 | 21,159 | 3,373 | 6.273051 |
| 水 | 22,137 | 3,576 | 6.190436 |
| 木 | 24,341 | 3,347 | 7.272483 |
| 金 | 15,036 | 3,339 | 4.503145 |
| 土 | 13,728 | 2,914 | 4.711050 |
| 日 | 19,328 | 3,957 | 4.884508 |
2017年
| 曜日 | Contribution数 | 記事数 | 平均Contribution数 |
|---|---|---|---|
| 月 | 98,970 | 11,191 | 8.843714 |
| 火 | 82,356 | 11,172 | 7.371643 |
| 水 | 82,339 | 11,377 | 7.237321 |
| 木 | 77,790 | 11,177 | 6.959828 |
| 金 | 81,756 | 10,715 | 7.630051 |
| 土 | 68,184 | 9,231 | 7.386415 |
| 日 | 75,549 | 10,571 | 7.146817 |
はてブ数
2018年
| 曜日 | はてブ数 | 記事数 | 平均はてブ数 |
|---|---|---|---|
| 月 | 3,292 | 12,021 | 3.651580 |
| 火 | 3,373 | 7,773 | 2.304477 |
| 水 | 3,576 | 10,479 | 2.930369 |
| 木 | 3,347 | 12,312 | 3.678518 |
| 金 | 3,339 | 5,537 | 1.658281 |
| 土 | 2,914 | 4,092 | 1.404255 |
| 日 | 3,957 | 7,704 | 1.946929 |
2017年
| 曜日 | はてブ数 | 記事数 | 平均はてブ数 |
|---|---|---|---|
| 月 | 11,191 | 42,514 | 3.798946 |
| 火 | 11,172 | 33,625 | 3.009757 |
| 水 | 11,377 | 32,753 | 2.878878 |
| 木 | 11,177 | 31,239 | 2.794936 |
| 金 | 10,715 | 36,058 | 3.365189 |
| 土 | 9,231 | 33,977 | 3.680750 |
| 日 | 10,571 | 31,787 | 3.007000 |
なぜ月曜日なのか?
おそらく、Qiitaの週間ランキングの集計タイミングと関係している。Qiitaのランキングは月曜はじまり日曜おわりで算出されており、集計時には月曜日がもっともContribution数が大きくなる。結果として、月曜日の記事は、ランキングの上位に位置しやすく、ランキングからの流入でさらにContribution数が増加するのである。
なお、Qiitaの週間ランキングは、メール経由での流入しかないわりに、かなりの集客力がある。感覚値では、ランキング上位に入ると、はてブのホットエントリと遜色ないぐらいの人の目に触れている印象である。
というわけで、渾身の記事をアップするのは月曜日にしてみてはいかがだろう。
Qiita戦闘力計測
せっかくデータがあるので、自分が全国でどのくらい発信力(Qiita限定だけど)があるのか教えてくれるサービスを作った。
ドラゴンボールのどのキャラクターの戦闘力と近いのか教えてくれる、ムダな機能も搭載しているので、よかったらどうぞ。
参考
- DRAGON BALL Z戦士と敵の戦闘力表
- ソフトウェアのための統計学
- pandasにsqlでよくやる処理をやらせてみる
- Python Pandasでのデータ操作の初歩まとめ − 前半:データ作成&操作編
-
本記事の内容は、2018年4月中旬頃に、事前にスクレイピングして取得したデータに基づいている。 ↩
-
正確に言うと、QiitaのユーザのContribution数は、記事のいいね数だけでは決まらないが、だいたい近似してるだろうという前提をおいた。 ↩
-
投稿経験のあるユーザの、平均投稿数が約9だったので、この値を閾値としている。 ↩