はじめに
先日Kubernetesの監視ってどうやるのかを調べましたが、実際の使い方を知りたくなり、動かしてみました。Kubernetesを監視するツールとして代表的なものはDatadogとPrometheusですが、今回はPrometheusの使い方を調べて実践しました。また、Prometheusとセットで使われることの多いGrafanaという可視化ツールも合わせて利用します。
Prometheusとは
もともとはSoundCloudが開発した、監視とアラート機能を持つツールです。2016年からCNCFに参画し、2018年8月にGraduationのステータスになりました。
全体のアーキテクチャは以下のようになります。

中身の説明に関しては、以下の記事が参考になりました。
次世代監視の大本命! Prometheus を実運用してみた
10分で理解する Prometheus
Prometheusの起動
Prometheusを利用する方法は、大きく2つの方法があります。
- Binaryファイルをインストールして起動
- コンテナイメージを利用して開始
2つ目はKubernetesやdockerから開始することができますが、今回はyamlファイルを作成してkubectlコマンドから起動した手順を紹介します。
環境
こちらの記事で構築した環境を利用します。
OS: Centos7
Kubernetes version: 1.13.1
User: 以下の作業は全てrootユーザで実行しています。
Binaryファイルを起動
Binaryファイルから開始する方法は公式ページのGetting startedで紹介されています。
Binaryファイルのインストール
こちらのページからバージョンを指定してインストールします。
wget https://github.com/prometheus/prometheus/releases/download/v2.6.0/prometheus-2.6.0.linux-amd64.tar.gz
tar xvfz prometheus-2.6.0.linux-amd64.tar.gz
cd prometheus-2.6.0.linux-amd64
prometheus.ymlファイルの確認
Prometheusのコンフィグファイルであるprometheus.ymlは、デフォルトでは以下のようになっています。設定変更がある場合はこのファイルを変更してPrometheusを起動します。後ほどコンフィグファイルを一部変更します。
# my global config
global:
  scrape_interval:     15s # Set the scrape interval to every 15 seconds. Default is every 1 minute.
  evaluation_interval: 15s # Evaluate rules every 15 seconds. The default is every 1 minute.
  # scrape_timeout is set to the global default (10s).

# Alertmanager configuration
alerting:
  alertmanagers:
  - static_configs:
    - targets:
      # - alertmanager:9093

# Load rules once and periodically evaluate them according to the global 'evaluation_interval'.
rule_files:
  # - "first_rules.yml"
  # - "second_rules.yml"

# A scrape configuration containing exactly one endpoint to scrape:
# Here it's Prometheus itself.
scrape_configs:
  # The job name is added as a label `job=<job_name>` to any timeseries scraped from this config.
  - job_name: 'prometheus'

    # metrics_path defaults to '/metrics'
    # scheme defaults to 'http'.

    static_configs:
    - targets: ['localhost:9090']
Binaryファイルから起動
以下のようにコンフィグファイルを指定して起動します。
./prometheus --config.file=prometheus.yml
コマンドを実行すると以下のようなログが表示されます。Server is ready to receive web requests.という表記が見えたらアクセス可能です。
level=info ts=2019-01-04T03:31:45.335407864Z caller=main.go:243 msg="Starting Prometheus" version="(version=2.6.0, branch=HEAD, revision=dbd1d58c894775c0788470944b818cc724f550fb)"
level=info ts=2019-01-04T03:31:45.335501267Z caller=main.go:244 build_context="(go=go1.11.3, user=root@bf5760470f13, date=20181217-15:14:46)"
level=info ts=2019-01-04T03:31:45.33552679Z caller=main.go:245 host_details="(Linux 3.10.0-957.1.3.el7.x86_64 #1 SMP Thu Nov 29 14:49:43 UTC 2018 x86_64 k8s-master (none))"
level=info ts=2019-01-04T03:31:45.335552521Z caller=main.go:246 fd_limits="(soft=1024, hard=4096)"
level=info ts=2019-01-04T03:31:45.335572558Z caller=main.go:247 vm_limits="(soft=unlimited, hard=unlimited)"
level=info ts=2019-01-04T03:31:45.336808997Z caller=main.go:561 msg="Starting TSDB ..."
level=info ts=2019-01-04T03:31:45.336861457Z caller=web.go:429 component=web msg="Start listening for connections" address=0.0.0.0:9090
level=info ts=2019-01-04T03:31:45.362425157Z caller=main.go:571 msg="TSDB started"
level=info ts=2019-01-04T03:31:45.3624917Z caller=main.go:631 msg="Loading configuration file" filename=prometheus.yml
level=info ts=2019-01-04T03:31:45.36354544Z caller=main.go:657 msg="Completed loading of configuration file" filename=prometheus.yml
level=info ts=2019-01-04T03:31:45.363564736Z caller=main.go:530 msg="Server is ready to receive web requests."
GUIから接続
デフォルトの設定ではlocalhost:9090からPrometheusの画面にアクセスできます。ここではhttp://<k8s-masterのグローバルIPアドレス:9090>からアクセスします。
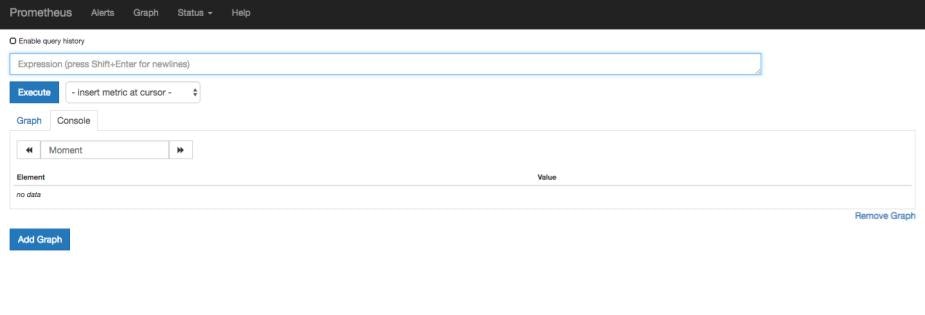
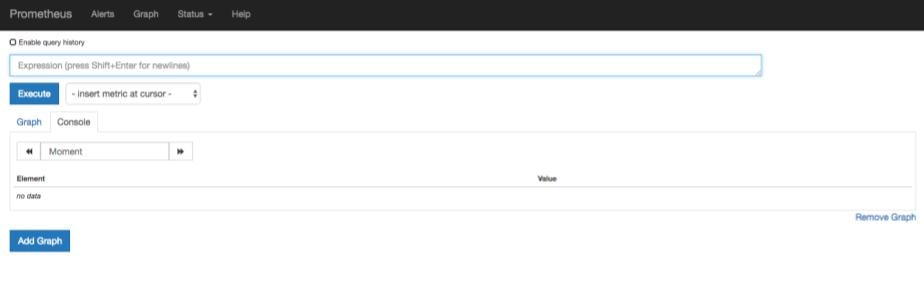
アクセスすると、以下のような画面が表示されます(<k8s-masterのグローバルIPアドレス:9090/graph>)。
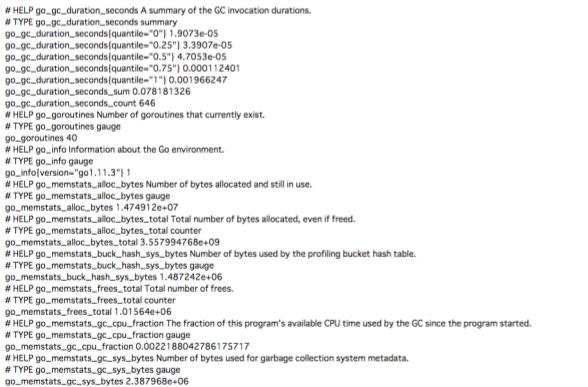
上記画面からhttp://<k8s-masterのグローバルIPアドレス:9090/metrics>にアクセスすると、このようにメトリクスの一覧が表示されます。アクセスには画面上部のタブから選択することもできます。
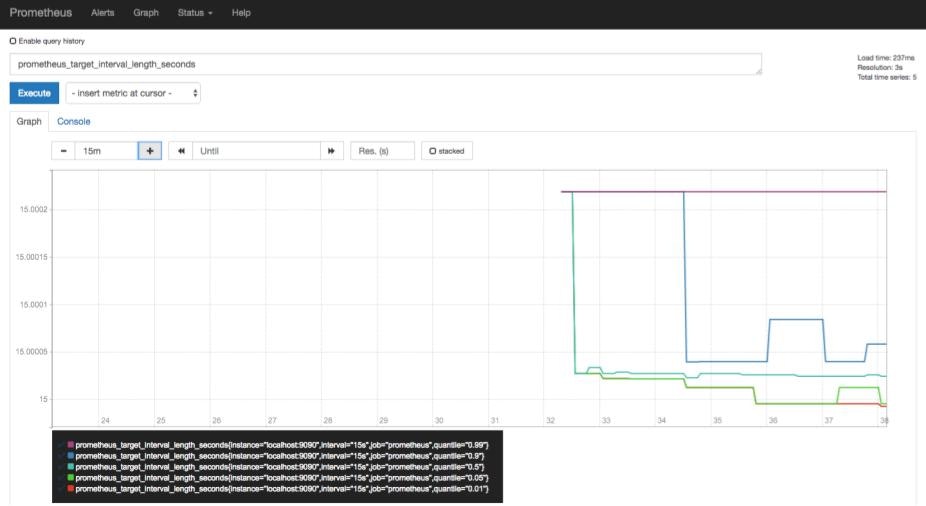
Getting Startedでは、取得するメトリクスの例も書かれています。ここではprometheus_target_interval_length_secondsというメトリクスを取得します。
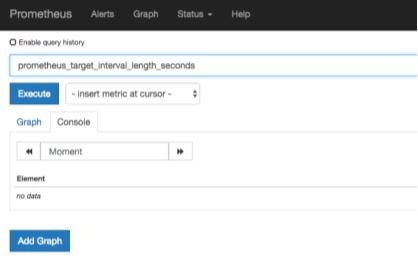
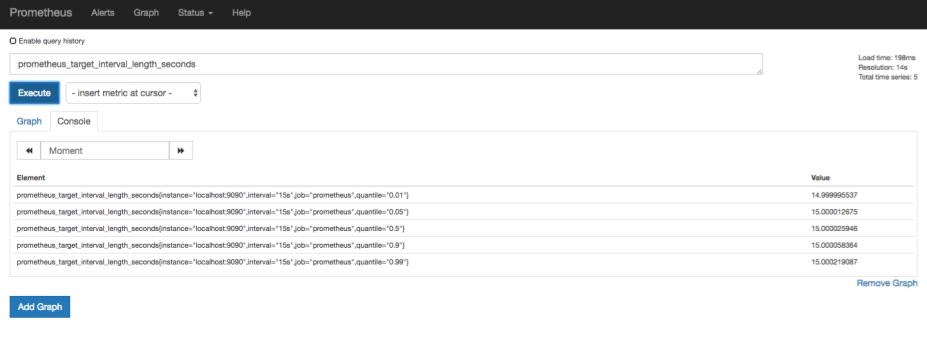
画面のExpressionという入力欄にprometheus_target_interval_length_secondsを入力し、Executeボタンをクリックします。
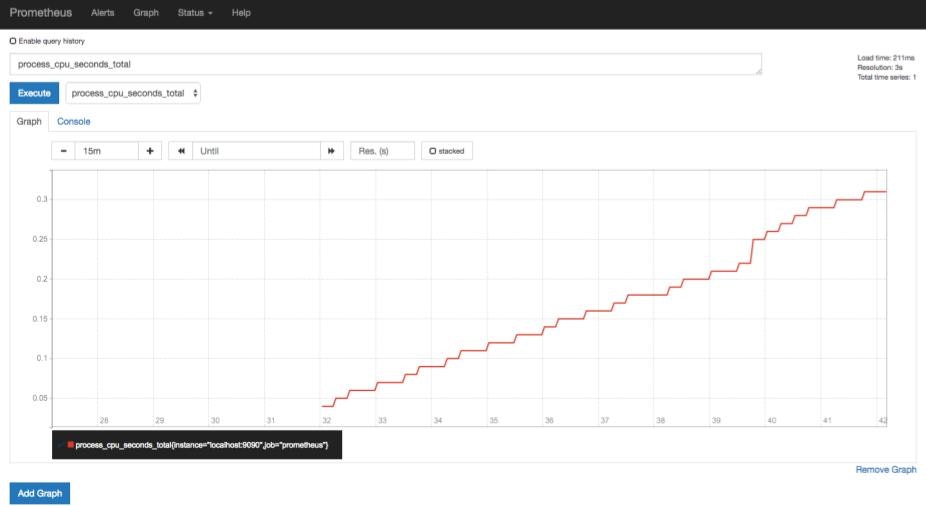
すると入力したメトリクスを表示するので、Graphを選択してみます。
するとこのようにグラフが表示されます。
Node Exporterの起動
PrometheusはPull型の監視ツールのため、被監視対象のサーバからメトリクスを受け取る必要があります。KubernetesはデフォルトでPrometheusに対応したメトリクスを提供しますが、Exporterというツールを起動してメトリクスを出力させてみます。
Exporterの種類はPrometheusのページで紹介されており、ハードウェアからDBなど様々なメトリクスに対応しています。ここではNode ExporterというExporterを利用します。Node Exporterを使ったPrometheusの監視についても公式ページで紹介されており、基本的にそちらの方法を採用します。
Node Exporterもbinaryファイルが提供されており、Prometheusのダウンロードページから確認することができます。手順としてはPrometheusの時と同様に、binaryファイルのインストール・解凍、そして起動となります。
[root@k8s-master ~]# wget https://github.com/prometheus/node_exporter/releases/download/v0.17.0/node_exporter-0.17.0.linux-amd64.tar.gz
[root@k8s-master ~]# tar xvfz node_exporter-0.17.0.linux-amd64.tar.gz
[root@k8s-master ~]# cd node_exporter-0.17.0.linux-amd64
[root@k8s-master node_exporter-0.17.0.linux-amd64]# ./node_exporter &
以下のようなログが表示され、起動します。
INFO[0000] Starting node_exporter (version=0.17.0, branch=HEAD, revision=f6f6194a436b9a63d0439abc585c76b19a206b21)  source="node_exporter.go:82"
INFO[0000] Build context (go=go1.11.2, user=root@322511e06ced, date=20181130-15:51:33)  source="node_exporter.go:83"
INFO[0000] Enabled collectors:                           source="node_exporter.go:90"
INFO[0000]  - arp                                        source="node_exporter.go:97"
INFO[0000]  - bcache                                     source="node_exporter.go:97"
INFO[0000]  - bonding                                    source="node_exporter.go:97"
INFO[0000]  - conntrack                                  source="node_exporter.go:97"
INFO[0000]  - cpu                                        source="node_exporter.go:97"
INFO[0000]  - diskstats                                  source="node_exporter.go:97"
INFO[0000]  - edac                                       source="node_exporter.go:97"
INFO[0000]  - entropy                                    source="node_exporter.go:97"
INFO[0000]  - filefd                                     source="node_exporter.go:97"
INFO[0000]  - filesystem                                 source="node_exporter.go:97"
INFO[0000]  - hwmon                                      source="node_exporter.go:97"
INFO[0000]  - infiniband                                 source="node_exporter.go:97"
INFO[0000]  - ipvs                                       source="node_exporter.go:97"
INFO[0000]  - loadavg                                    source="node_exporter.go:97"
INFO[0000]  - mdadm                                      source="node_exporter.go:97"
INFO[0000]  - meminfo                                    source="node_exporter.go:97"
INFO[0000]  - netclass                                   source="node_exporter.go:97"
INFO[0000]  - netdev                                     source="node_exporter.go:97"
INFO[0000]  - netstat                                    source="node_exporter.go:97"
INFO[0000]  - nfs                                        source="node_exporter.go:97"
INFO[0000]  - nfsd                                       source="node_exporter.go:97"
INFO[0000]  - sockstat                                   source="node_exporter.go:97"
INFO[0000]  - stat                                       source="node_exporter.go:97"
INFO[0000]  - textfile                                   source="node_exporter.go:97"
INFO[0000]  - time                                       source="node_exporter.go:97"
INFO[0000]  - timex                                      source="node_exporter.go:97"
INFO[0000]  - uname                                      source="node_exporter.go:97"
INFO[0000]  - vmstat                                     source="node_exporter.go:97"
INFO[0000]  - xfs                                        source="node_exporter.go:97"
INFO[0000]  - zfs                                        source="node_exporter.go:97"
INFO[0000] Listening on :9100                            source="node_exporter.go:111"
Web GUIからhttp://<k8s-masterのグローバルIPアドレス:9100>にアクセスすると、以下のような画面が表示されます。
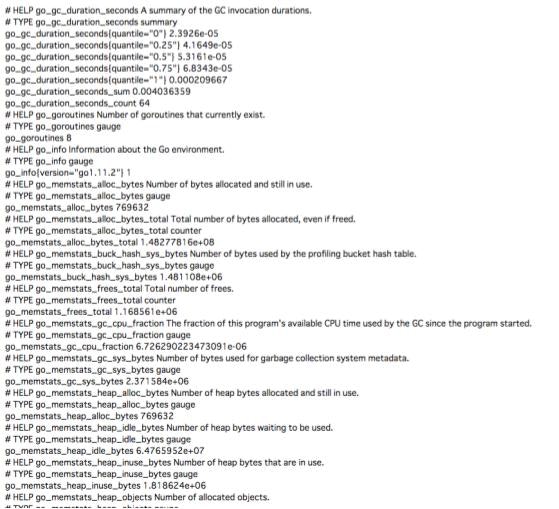
画面中のMetricsをクリックすると、メトリクスがずらっと表示されます。
prometheus.ymlの編集
起動したNode Exporterからのメトリクスを受け取るには、prometheus.ymlを編集してターゲットを特定する必要があります。ここでは以下のようにtargetsのポート番号を変更します。
# my global config
global:
  scrape_interval:     15s # Set the scrape interval to every 15 seconds. Default is every 1 minute.
  evaluation_interval: 15s # Evaluate rules every 15 seconds. The default is every 1 minute.
  # scrape_timeout is set to the global default (10s).

# Alertmanager configuration
alerting:
  alertmanagers:
  - static_configs:
    - targets:
      # - alertmanager:9093

# Load rules once and periodically evaluate them according to the global 'evaluation_interval'.
rule_files:
  # - "first_rules.yml"
  # - "second_rules.yml"

# A scrape configuration containing exactly one endpoint to scrape:
# Here it's Prometheus itself.
scrape_configs:
  # The job name is added as a label `job=<job_name>` to any timeseries scraped from this config.
  - job_name: 'prometheus'

    # metrics_path defaults to '/metrics'
    # scheme defaults to 'http'.

    static_configs:
    - targets: ['localhost:9100']   #ポート番号を変更する
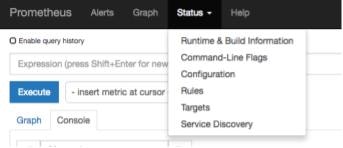
再びPrometheusの画面からStatus→Targetsを選択すると、ターゲットのポート番号が変更されています。
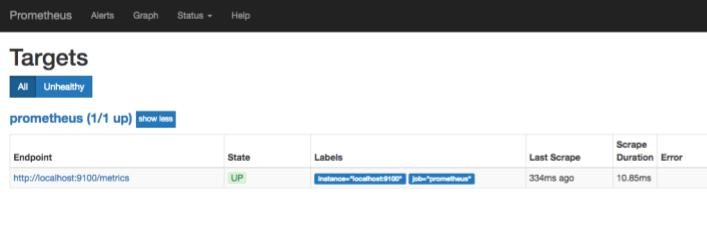
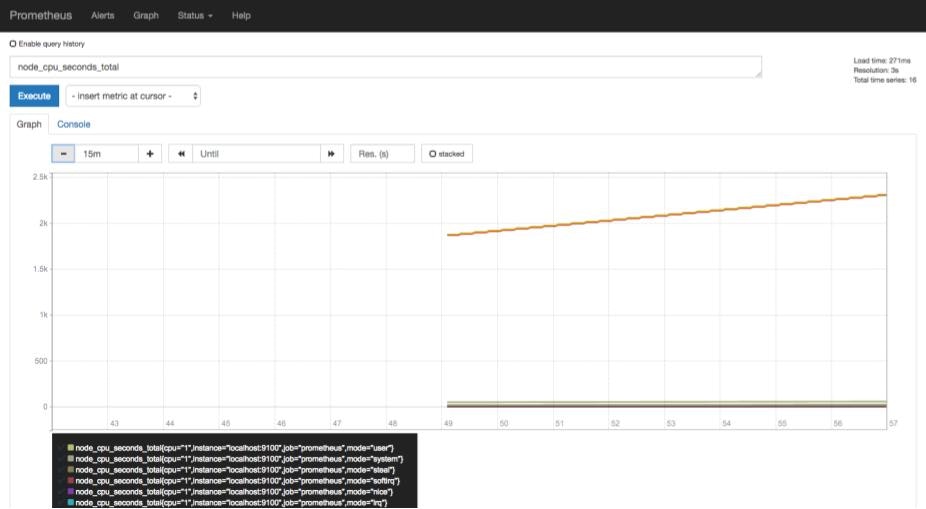
先ほどは利用できなかったメトリクスが利用できるようになります。ここではnode_cpu_second_totalというメトリクスをグラフで表示しています。
Node Exporterからどんなメトリクスが取得できるかは、Node Exporterのgithubページから確認できます。
別nodeからのメトリクスを取得
ここまでは全てmaster(k8s-master)のメトリクスを取得していましたが、今度はworker(k8s-node-1)のメトリクスを取得します。worker側で上記と同じ手順でNode Exporterのインストール・起動を完了したら、再びprometheus.ymlを編集します。編集箇所は先ほどと同様targetsの部分です。
# my global config
global:
  scrape_interval:     15s # Set the scrape interval to every 15 seconds. Default is every 1 minute.
  evaluation_interval: 15s # Evaluate rules every 15 seconds. The default is every 1 minute.
  # scrape_timeout is set to the global default (10s).

# Alertmanager configuration
alerting:
  alertmanagers:
  - static_configs:
    - targets:
      # - alertmanager:9093

# Load rules once and periodically evaluate them according to the global 'evaluation_interval'.
rule_files:
  # - "first_rules.yml"
  # - "second_rules.yml"

# A scrape configuration containing exactly one endpoint to scrape:
# Here it's Prometheus itself.
scrape_configs:
  # The job name is added as a label `job=<job_name>` to any timeseries scraped from this config.
  - job_name: 'prometheus'

    # metrics_path defaults to '/metrics'
    # scheme defaults to 'http'.

    static_configs:
    - targets: ['localhost:9100','k8s-node-1:9100']  #ターゲットを追加する
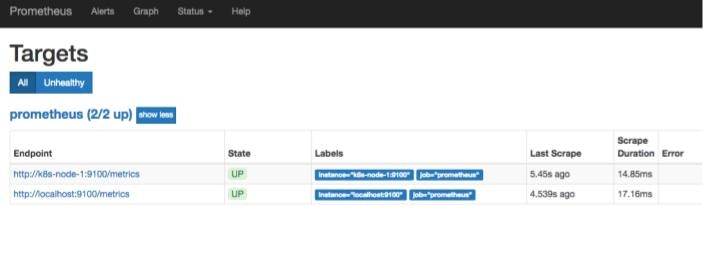
再びPrometheusのGUI画面からTargetsをクリックすると、ターゲットが増えていることが確認できます。
Grafanaの起動
ここまででPrometheusからメトリクスを確認することができました。しかし画面を見ていただくとわかるように、かなり寂しい、そして見にくいです。そこで可視化ツールとしてGrafanaを起動します。
Grafanaの利用方法についても、Prometheusの公式ページで紹介されています。やはりセットで使われることが想定されているようです。
起動方法はこれまでと同様ですが、別の記事ではsystemctlから起動していたので、そちらを採用しました。
[root@k8s-master ~]# wget https://dl.grafana.com/oss/release/grafana-5.4.2-1.x86_64.rpm
[root@k8s-master ~]# yum localinstall -y grafana-5.4.2-1.x86_64.rpm
[root@k8s-master ~]# systemctl start grafana-server
[root@k8s-master ~]# systemctl status grafana-server
statusを確認すると、以下のようにちゃんと起動しているのがわかります。
● grafana-server.service - Grafana instance
   Loaded: loaded (/usr/lib/systemd/system/grafana-server.service; disabled; vendor preset: disabled)
   Active: active (running) since Fri 2019-01-04 04:29:21 UTC; 8s ago
     Docs: http://docs.grafana.org
 Main PID: 2830 (grafana-server)
    Tasks: 11
   Memory: 18.5M
   CGroup: /system.slice/grafana-server.service
           └─2830 /usr/sbin/grafana-server --config=/etc/grafana/grafana.ini --pidfile=/var/run/grafana/grafana-server.pid --packaging=rpm cfg:defaul...

Jan 04 04:29:21 k8s-master grafana-server[2830]: t=2019-01-04T04:29:21+0000 lvl=info msg="Initializing CleanUpService" logger=server
Jan 04 04:29:21 k8s-master grafana-server[2830]: t=2019-01-04T04:29:21+0000 lvl=info msg="Initializing NotificationService" logger=server
Jan 04 04:29:21 k8s-master grafana-server[2830]: t=2019-01-04T04:29:21+0000 lvl=info msg="Initializing ProvisioningService" logger=server
Jan 04 04:29:21 k8s-master grafana-server[2830]: t=2019-01-04T04:29:21+0000 lvl=info msg="Initializing PluginManager" logger=server
Jan 04 04:29:21 k8s-master grafana-server[2830]: t=2019-01-04T04:29:21+0000 lvl=info msg="Starting plugin search" logger=plugins
Jan 04 04:29:21 k8s-master systemd[1]: Started Grafana instance.
Jan 04 04:29:21 k8s-master grafana-server[2830]: t=2019-01-04T04:29:21+0000 lvl=info msg="Plugin dir created" logger=plugins dir=/var/lib/gra.../plugins
Jan 04 04:29:21 k8s-master grafana-server[2830]: t=2019-01-04T04:29:21+0000 lvl=info msg="Initializing TracingService" logger=server
Jan 04 04:29:21 k8s-master grafana-server[2830]: t=2019-01-04T04:29:21+0000 lvl=info msg="Initializing Stream Manager"
Jan 04 04:29:21 k8s-master grafana-server[2830]: t=2019-01-04T04:29:21+0000 lvl=info msg="HTTP Server Listen" logger=http.server address=0.0.... socket=
Hint: Some lines were ellipsized, use -l to show in full.
GUI画面からhttp://<k8s-masterのプライベートIPアドレス:3000>にアクセスします。以下のような画面が表示されることがあるのでしばらく待ちます。
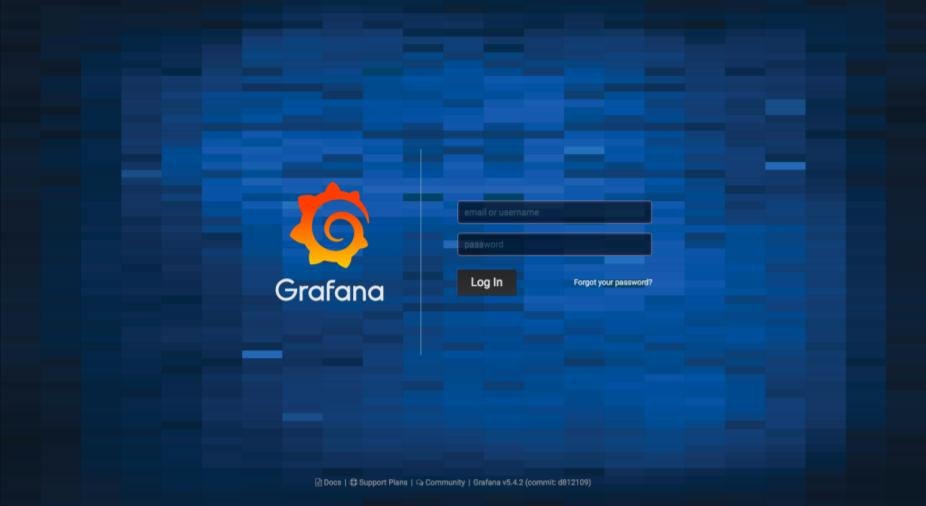
ログイン画面が表示されます。初期ログインのID/PWはadmin/adminです。すでにPrometheusの時より画面が美しいですね!
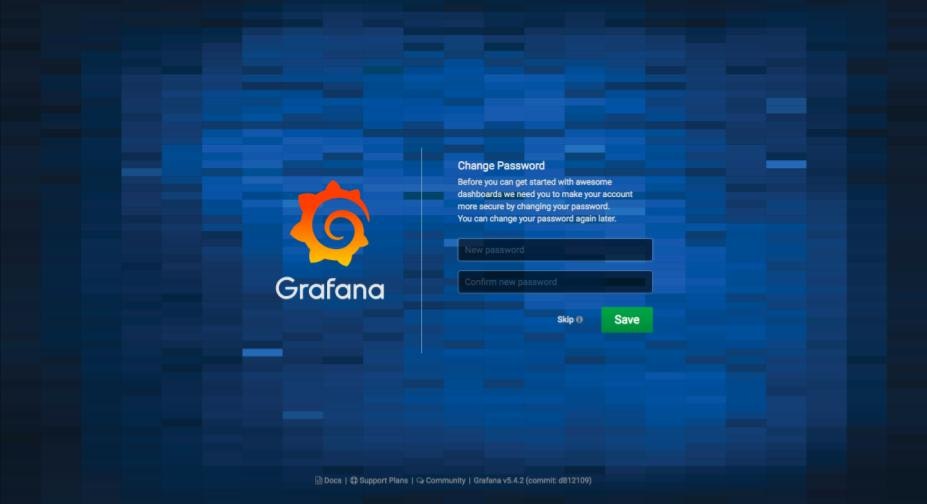
入力して次へ進むとパスワードの変更を求められます。
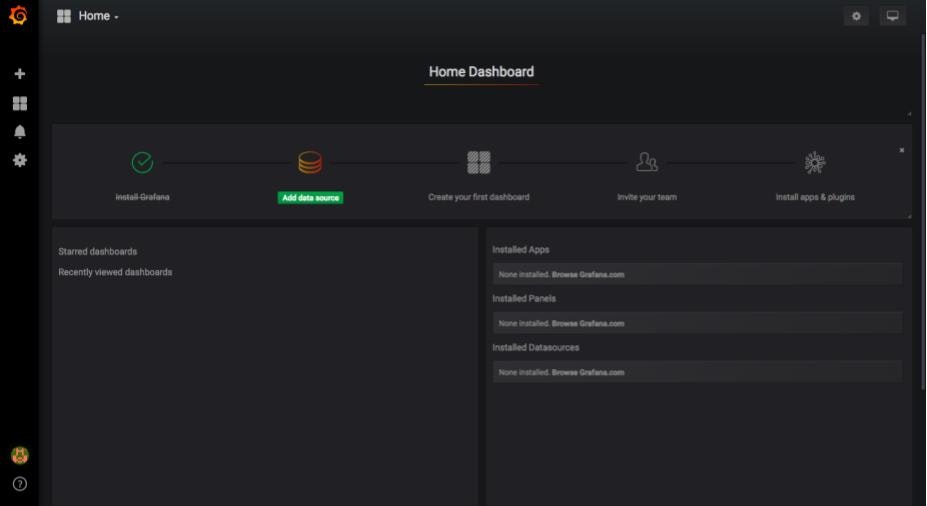
入力後は以下のような画面が表示されます。
Prometheus Dashboardの準備
ここからPrometheusのDashboardを準備します。
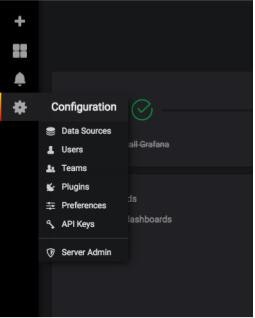
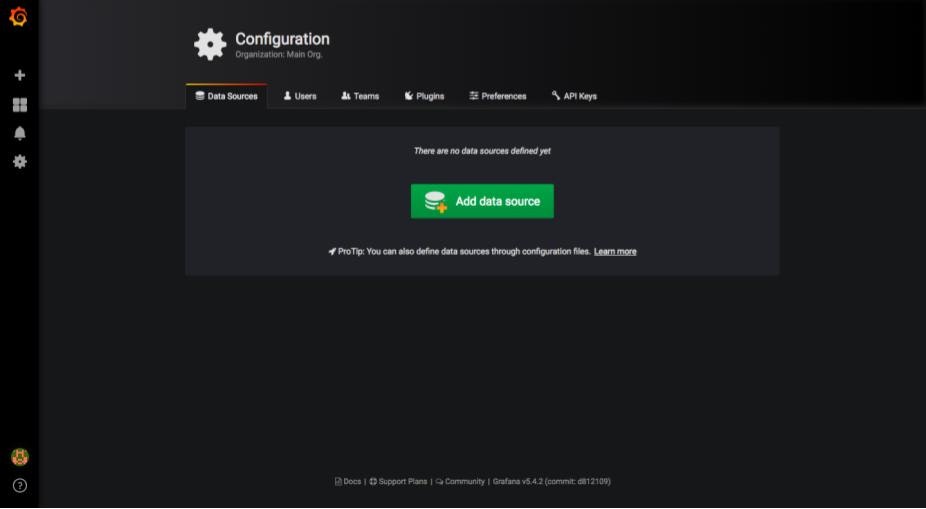
画面左側のConfigurationからData Sourcesを選択します。
以下のような画面が表示されるので、中央にあるAdd data sourceをクリックします。
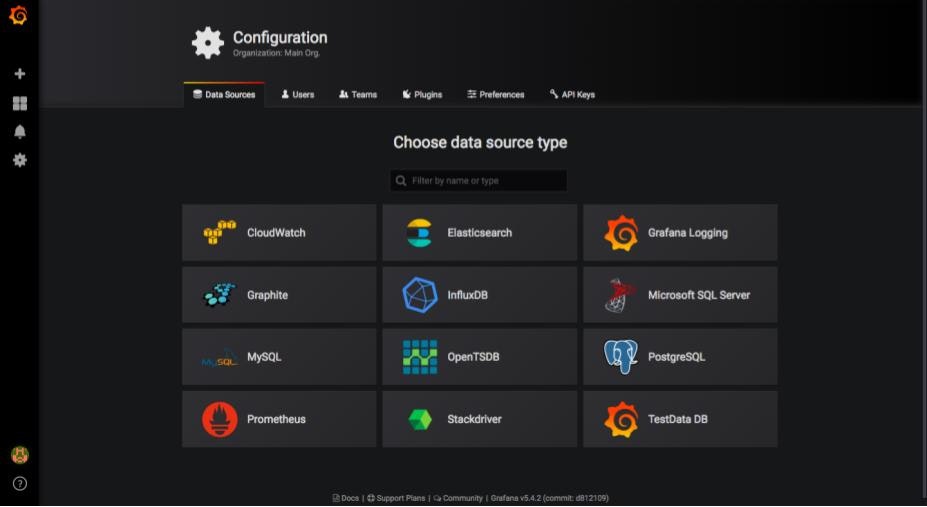
続いてData sourceのタイプを選択します。ここではPrometheusを選択します。
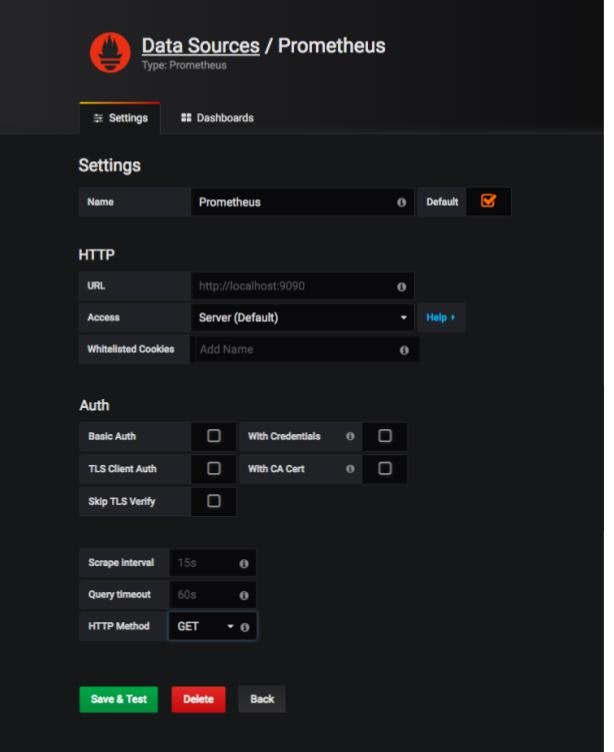
Settings画面が表示されたら、必要な箇所を入力します。ここではURL,Scrape Interval,Query timeoutを入力しました。
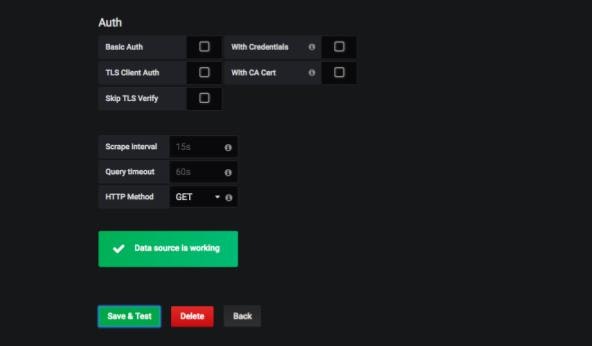
入力後、Save & Testをクリックすると、接続テスト?が行われ、正常に作動した場合は以下のように表示されます。
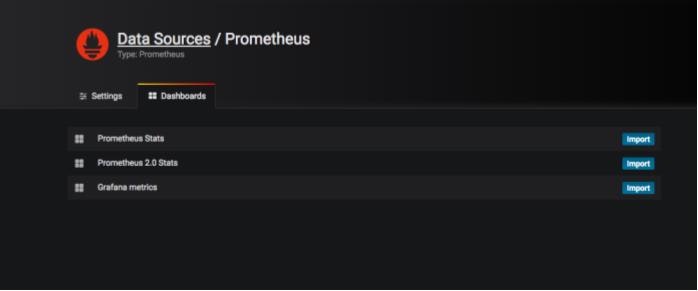
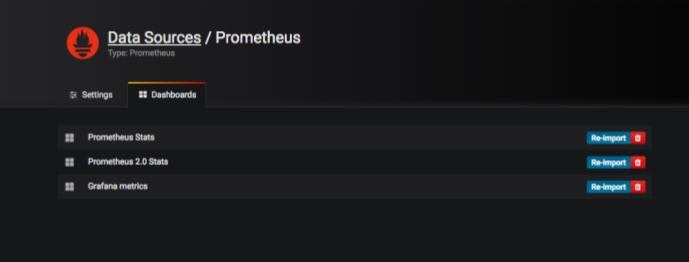
続いて、同画面の別タブであるDashboardsに移動します。表示されたImportを全てクリックし、有効にします。
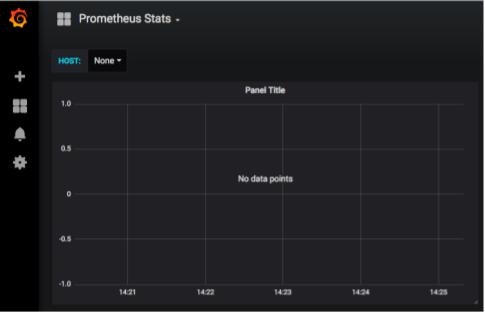
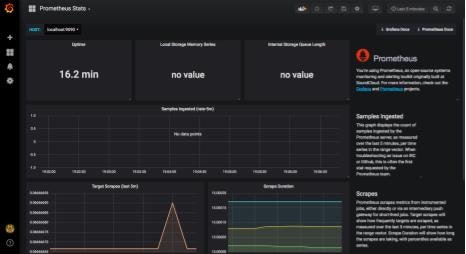
その後、Configuration→Dashboards→Homeをクリックし、表示された中からImportしたDashboardsを選択します。ここではPrometheus Statsを選択します。すると以下のようにDashboardが表示されます。
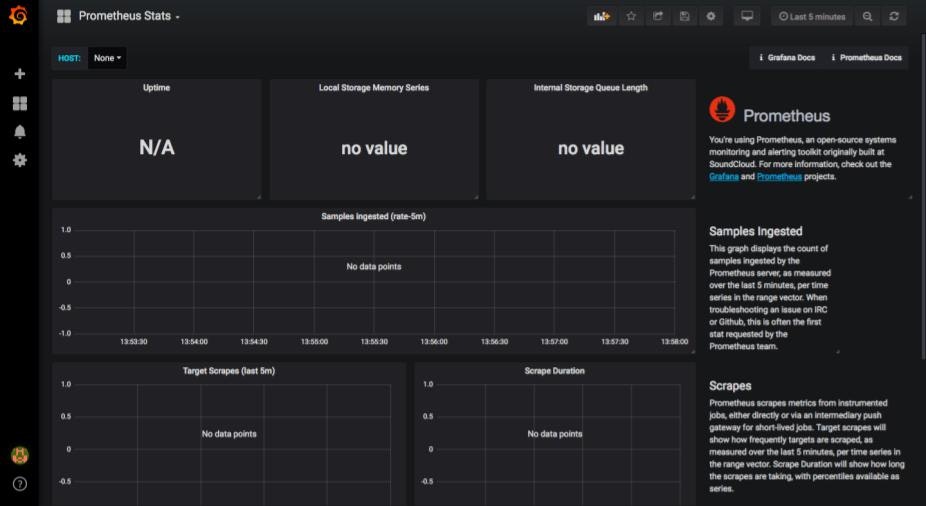
正しく読み込めていないように見えますが、ここでは一旦無視して、新規でグラフを作成します。画面上部からAdd panelを選択します。
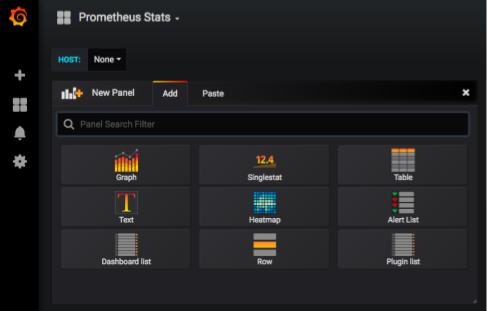
次にGraphを選択します。
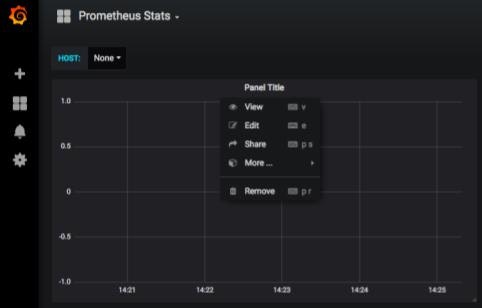
グラフ上部のPanel Titleあたりをクリックすると、メニューが表示されるので、Editを選択します。
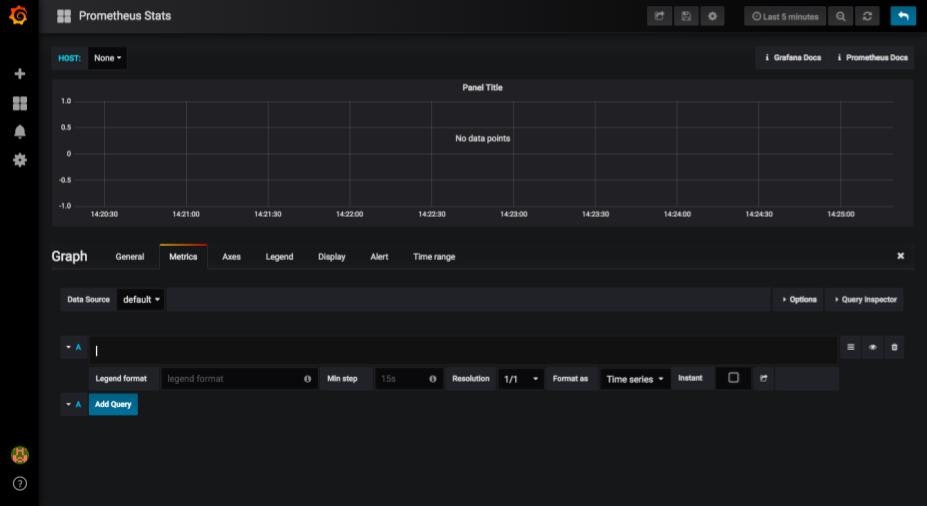
すると以下のような画面が表示されます。ここでグラフごとの設定を決めていきます。取得するメトリクスもここから入力します。
まずメトリクスを入力します。Metrics→defaultの画面の入力欄に取得するメトリクスを入力します。ここでは試しにnode_memory_Active_file_bytesを入力しました。すると早速グラフが表示されます。
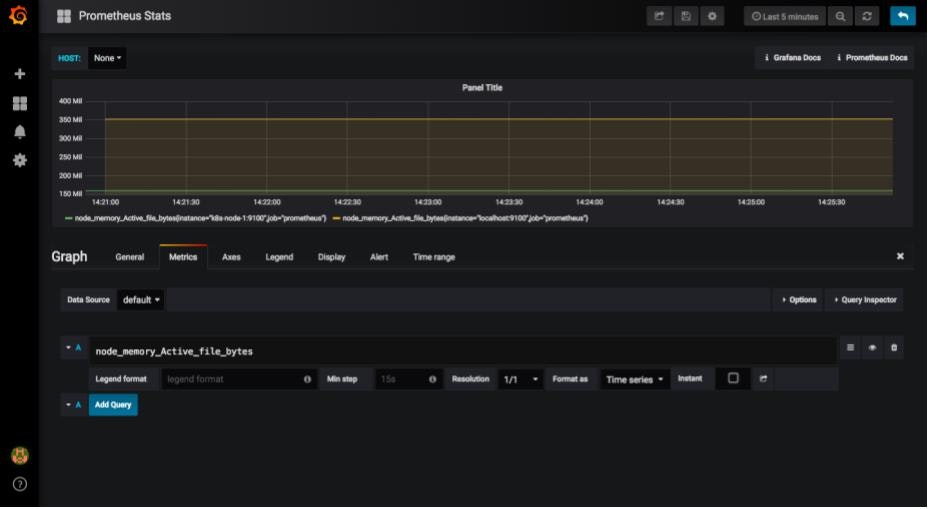
あとはグラフのタイトルや細かな設定等を変更すればグラフの完成です。
ここで先ほどN/Aと表示されていたグラフを見てみます。ここではUptimesのグラフを選択しました。
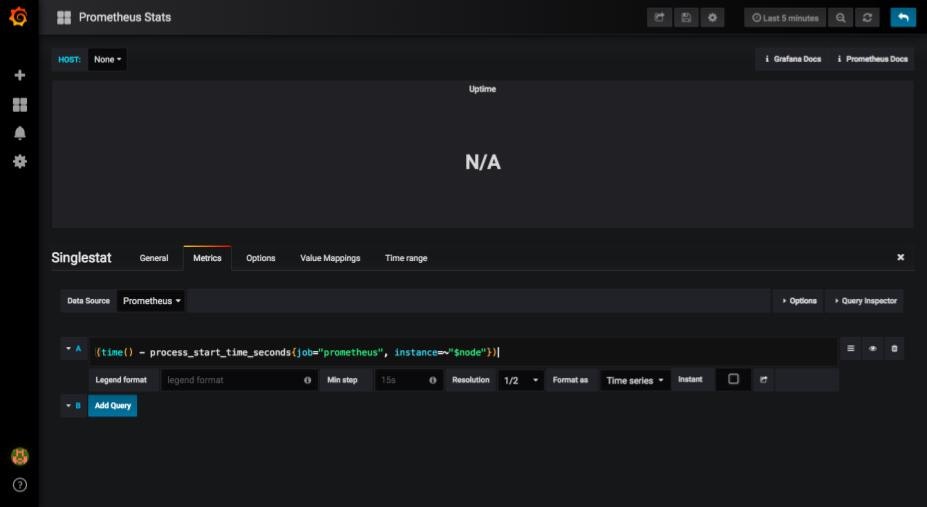
メトリクスの箇所を見ると、ノードの名前(ここではinstanceと表記された箇所)が変数となっています。この部分がうまくいかず、メトリクスを取得できなかったようです。
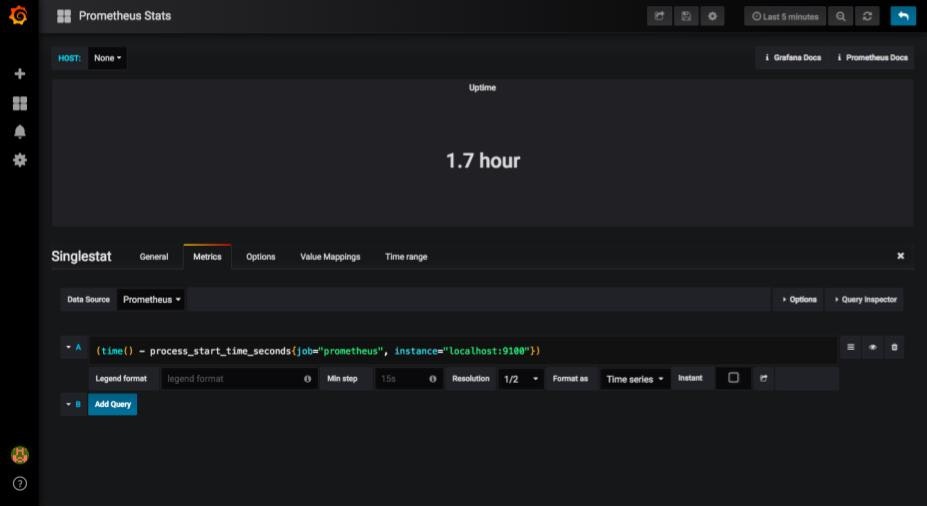
試しにlocalhost:9100と入力すると、ちゃんとグラフに表示されます。
【追記】こちらの記事で説明されていましたが、どうやらcAdvisorを取得できていないために正しくグラフが表示されなかったようです。
ここまでがBinaryファイルからPrometheus + Grafanaを起動する方法でした。
yamlファイルを作成してデプロイ
続いてyamlファイルを作成してPrometheus + Grafanaをデプロイする方法を紹介します。
Prometheusのデプロイ
Prometheusをデプロイするための各種yamlファイルを作成します。作成手順はこちらを参考にしました。
ここでは4種類のyamlファイルを作成します。
ClusterRole, ClusterRoleBinding
※上記記事を参考に作成したためClusterRole, ClusterRoleBindingを作成しましたが、記事内ではGKE環境を想定しており、今回は必要ないものと思われます。
apiVersion: rbac.authorization.k8s.io/v1beta1
kind: ClusterRole
metadata:
  name: prometheus
rules:
- apiGroups: [""]
  resources:
  - nodes
  - nodes/proxy
  - services
  - endpoints
  - pods
  verbs: ["get", "list", "watch"]
- apiGroups:
  - extensions
  resources:
  - ingresses
  verbs: ["get", "list", "watch"]
- nonResourceURLs: ["/metrics"]
  verbs: ["get"]
---
apiVersion: rbac.authorization.k8s.io/v1beta1
kind: ClusterRoleBinding
metadata:
  name: prometheus
roleRef:
  apiGroup: rbac.authorization.k8s.io
  kind: ClusterRole
  name: prometheus
subjects:
- kind: ServiceAccount
  name: default
  namespace: monitoring
ConfigMap
Binaryから起動する際にはprometheus.ymlを編集して設定を変更しました。yamlファイルから起動する際にもこれを利用しますが、幾つか指定する方法があるようです。
- ConfigMapで利用するデータを書き込む
- Deploymentで
argsでconfigファイルを指定する
今回はConfigMapに利用するデータを書き込み指定します。data:の箇所でファイルの内容を書き込みます。
apiVersion: v1
kind: ConfigMap
metadata:
  name: prometheus-server-conf
  labels:
    name: prometheus-server-conf
  namespace: monitoring
data:
  prometheus.yml: |-
    # my global config
    global:
      scrape_interval:     15s # Set the scrape interval to every 15 seconds. Default is every 1 minute.
      evaluation_interval: 15s # Evaluate rules every 15 seconds. The default is every 1 minute.
      # scrape_timeout is set to the global default (10s).

    # Alertmanager configuration
    alerting:
      alertmanagers:
      - static_configs:
        - targets:
          # - alertmanager:9093

    # Load rules once and periodically evaluate them according to the global 'evaluation_interval'.
    rule_files:
      # - "first_rules.yml"
      # - "second_rules.yml"

    # A scrape configuration containing exactly one endpoint to scrape:
    # Here it's Prometheus itself.
    scrape_configs:
      # The job name is added as a label `job=<job_name>` to any timeseries scraped from this config.
      - job_name: 'prometheus'

        # metrics_path defaults to '/metrics'
        # scheme defaults to 'http'.

        static_configs:
        - targets: ['localhost:9100','k8s-node-1:9100']
Deployment
このファイルでPrometheusを起動します。
apiVersion: extensions/v1beta1
kind: Deployment
metadata:
  name: prometheus-deployment
  namespace: monitoring
spec:
  replicas: 1
  template:
    metadata:
      labels:
        app: prometheus-server
    spec:
      containers:
        - name: prometheus
          image: prom/prometheus:latest
          # configfileで指定した場所には該当のファイルが存在しません。。。
          args:
            - "--config.file=/etc/prometheus/prometheus.yml"
            - "--storage.tsdb.path=/prometheus/"
          ports:
            - containerPort: 9090
Service
上記Deploymentファイルをデプロイしただけではアクセスができません。外部から接続できるようにします。参考記事では2つの方法を紹介しています。
- kubectl port forwardingを利用する
- NodePort, LoadBalancer等を用いる
ここでは後者の方法を用います。NodePortによって外部からの接続を可能にします。接続するポートは30000番を指定しています。
apiVersion: v1
kind: Service
metadata:
  name: prometheus-service
spec:
  selector:
    app: prometheus-server
  type: NodePort
  ports:
    - port: 8080
      targetPort: 9090
      nodePort: 30000
各種yamlファイルのデプロイ
それではデプロイします。まず監視用のnamespaceを作成します。
[root@k8s-master ~]# kubectl create namespace monitoring
namespace/monitoring created
[root@k8s-master ~]# kubectl get ns
NAME          STATUS   AGE
default       Active   11d
kube-public   Active   11d
kube-system   Active   11d
monitoring    Active   6s
[root@k8s-master ~]#
続いてClusterRoleのファイルをデプロイします。
[root@k8s-master ~]# kubectl create -f clusterRole.yml
clusterrole.rbac.authorization.k8s.io/prometheus created
clusterrolebinding.rbac.authorization.k8s.io/prometheus created
[root@k8s-master ~]#
[root@k8s-master ~]# kubectl get clusterrole prometheus -n monitoring
NAME         AGE
prometheus   13m
[root@k8s-master ~]#
ConfigMapをデプロイします。
[root@k8s-master ~]# kubectl create -f prometheus-configmap.yml -n monitoring
configmap/prometheus-server-conf created
[root@k8s-master ~]# kubectl get configmap -n monitoring
NAME                     DATA   AGE
prometheus-server-conf   1      57s
[root@k8s-master ~]#
Deploymentファイルをデプロイします。
kubectl create -f prometheus-deployment.yml -n monitoring
deployment.extensions/prometheus-deployment created
[root@k8s-master ~]# kubectl get deployments -n monitoring
NAME                    READY   UP-TO-DATE   AVAILABLE   AGE
prometheus-deployment   1/1     1            1           16s
[root@k8s-master ~]#
最後にServiceファイルをデプロイします。
[root@k8s-master ~]# kubectl create -f prometheus-service.yml -n monitoring
service/prometheus-service created
[root@k8s-master ~]# kubectl get svc -n monitoring
NAME                 TYPE       CLUSTER-IP      EXTERNAL-IP   PORT(S)          AGE
prometheus-service   NodePort   10.108.59.161   <none>        8080:30000/TCP   9s
[root@k8s-master ~]#
これでGUIからアクセスすることができます。http://<k8s-masterのグローバルIPアドレス:30000>にアクセスすると、以下のようにアクセスできます。
メトリクスを指定してグラフに表示することもできます。
Grafanaのデプロイ
続いてGrafanaをデプロイします。先ほど作成したPrometheus用のDeployment, Serviceファイルをもとに、Grafana用のファイルを作成しました。変更したのは、名前とコンテナイメージの部分、あとはポート番号くらいです。
apiVersion: extensions/v1beta1
kind: Deployment
metadata:
  name: grafana-deployment
  namespace: monitoring
spec:
  replicas: 1
  template:
    metadata:
      labels:
        app: grafana-server
    spec:
      containers:
        - name: grafana
          image: grafana/grafana:latest
          #args:
          #  - "--config.file=/root/prometheus.yml"
          #  - "--storage.tsdb.path=/prometheus/"
          ports:
            - containerPort: 3000
apiVersion: v1
kind: Service
metadata:
  name: grafana-service
spec:
  selector:
    app: grafana-server
  type: NodePort
  ports:
    - port: 8100
      targetPort: 3000
      nodePort: 30020
ではデプロイします。
[root@k8s-master ~]# kubectl create -f grafana-deployment.yml -n monitoring
deployment.extensions/grafana-deployment created
[root@k8s-master ~]# kubectl get pods -n monitoring
NAME                                     READY   STATUS    RESTARTS   AGE
grafana-deployment-75d8d6dcc5-hkwt7      1/1     Running   0          11s
prometheus-deployment-5cc78d984f-b5pxw   1/1     Running   0          10m
[root@k8s-master ~]# kubectl create -f grafana-service.yml -n monitoring
service/grafana-service created
[root@k8s-master ~]# kubectl get svc -n monitoring
NAME                 TYPE       CLUSTER-IP      EXTERNAL-IP   PORT(S)          AGE
grafana-service      NodePort   10.102.56.76    <none>        8100:30020/TCP   11s
prometheus-service   NodePort   10.102.96.204   <none>        8080:30000/TCP   11m
[root@k8s-master ~]#
これでGrafanaも使えるので、GUIからhttp://<k8s-masterのグローバルIPアドレス:30020>にアクセスします。ログイン画面から同様に設定すると、以下のようにDashboardが表示されるようになりました。
まとめ・感想
- binary: 公式ページが推奨?している手順だけあって、非常に簡単に起動ができます。設定ファイルも比較的わかりやすく、ターゲットの追加も簡単です。
- yaml: yamlファイルの準備ができさえすればとても簡単にできますが、yamlファイルの準備がとても大変です。
本当はyamlファイルでもNode Exporterを起動し、メトリクスの取得まで実施したかったのですが、書き方が間違っているのかうまくいきませんでした(デプロイはできましたが、結局メトリクスを取得できませんでした)。yamlファイルの書き方も含め、引き続き調べていきます。
個人的にはbinaryから実行する方がやりやすく感じたのですが、柔軟性やコンフィグの管理などを考えるとyamlからデプロイの方が都合が良さそうです。
参考リンク
prometheus のデータを grafana でグラフ表示してみた
Prometheusのfile_sd_configsを試してみる
KubernetesのRBACについて
Kubernetesの全NodeをPrometheusで監視する方法
Prometheusをコンテナとして起動する方法