prometheusでkubernetesのクラスタを監視したい!
初投稿です。
kubernetesのクラスタ監視といえば、prometheus、EFK、SaaSではDatadogなどがありますが、今回はprometheusで監視を行います。
kubernetes用のprometheus環境構築
https://github.com/giantswarm/kubernetes-prometheus
より、prometheus環境を構築します。最終更新が9月で、Deploymentもbetaだったりしますが、今回は気にせずに利用します。
Quickstartにあるコマンドを実行すると、monitoringというnamespaceにprometheus/grafana/node-exporterなどが自動的に構築されます。
kubectl apply \
  --filename https://raw.githubusercontent.com/giantswarm/kubernetes-prometheus/master/manifests-all.yaml
構築後はmonitoringのnamespaceでpodが色々と立ち上がっているのが確認できます。
# kubectl get pods --namespace=monitoring
NAME                                  READY     STATUS    RESTARTS   AGE
alertmanager-56f6fdd9f6-z4vl8         1/1       Running   0          2h
grafana-core-867b94888d-td7b4         1/1       Running   0          5h
kube-state-metrics-694fdcf55f-797th   1/1       Running   0          5h
kube-state-metrics-694fdcf55f-tsvh5   1/1       Running   0          5h
node-directory-size-metrics-8rjvx     2/2       Running   0          5h
node-directory-size-metrics-z86cs     2/2       Running   0          5h
prometheus-core-5cf65c7b68-2dg5r      1/1       Running   0          2h
prometheus-node-exporter-8dccv        1/1       Running   0          5h
prometheus-node-exporter-rmlwk        1/1       Running   0          5h
alertmanagerやkube-state-metricsなども立ち上げてくれます。
NodePortも構築してくれるため、URLから確認してみましょう。
# kubectl get svc --namespace=monitoring
NAME                       TYPE        CLUSTER-IP       EXTERNAL-IP   PORT(S)          AGE
alertmanager               NodePort    100.64.36.59     <none>        9093:32651/TCP   5h
grafana                    NodePort    100.70.155.49    <none>        3000:31676/TCP   5h
kube-state-metrics         ClusterIP   100.66.157.125   <none>        8080/TCP         5h
prometheus                 NodePort    100.71.101.61    <none>        9090:32296/TCP   5h
prometheus-node-exporter   ClusterIP   None             <none>        9100/TCP         5h
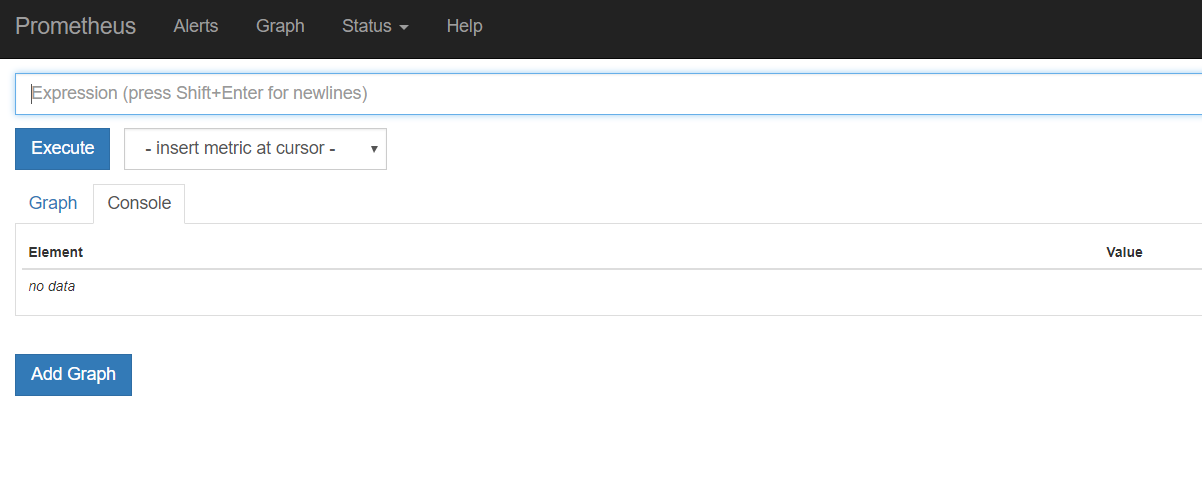
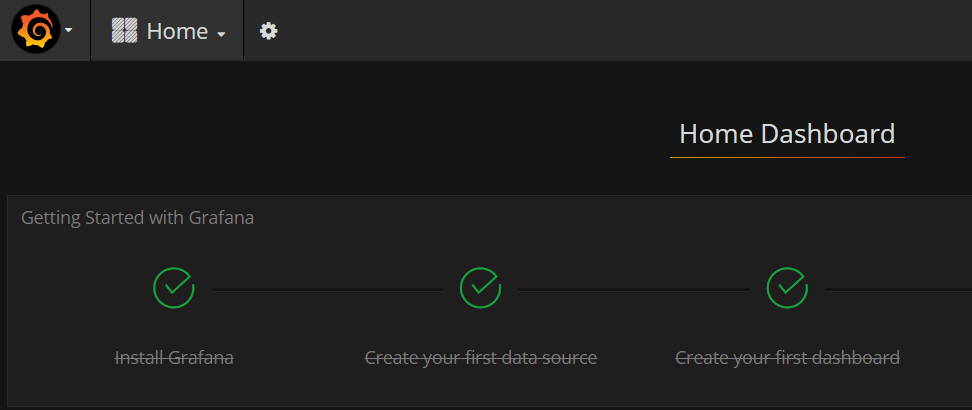
prometheus、grafanaともに立ち上がっています。
ただ、kubernetes-pod-resourcesなどを確認すると、N/Aと出ており、正しく確認ができません。
これはprometheusの設定で、cAdvisorを取得していないためです。
prometheusの設定変更
prometheusのConfigMapを修正し、cAdvisorを取得しましょう。
kubectl edit configmap prometheus-core --namespace=monitoring
scrape_configs 以下に、job_nameを追加しましょう。
(公式のコピペです:https://github.com/prometheus/prometheus/blob/master/documentation/examples/prometheus-kubernetes.yml)
- job_name: 'kubernetes-cadvisor'

  # Default to scraping over https. If required, just disable this or change to
  # `http`.
  scheme: https

  # This TLS & bearer token file config is used to connect to the actual scrape
  # endpoints for cluster components. This is separate to discovery auth
  # configuration because discovery & scraping are two separate concerns in
  # Prometheus. The discovery auth config is automatic if Prometheus runs inside
  # the cluster. Otherwise, more config options have to be provided within the
  # <kubernetes_sd_config>.
  tls_config:
    ca_file: /var/run/secrets/kubernetes.io/serviceaccount/ca.crt
  bearer_token_file: /var/run/secrets/kubernetes.io/serviceaccount/token

  kubernetes_sd_configs:
  - role: node

  relabel_configs:
  - action: labelmap
    regex: __meta_kubernetes_node_label_(.+)
  - target_label: __address__
    replacement: kubernetes.default.svc:443
  - source_labels: [__meta_kubernetes_node_name]
    regex: (.+)
    target_label: __metrics_path__
    replacement: /api/v1/nodes/${1}/proxy/metrics/cadvisor
設定を反映後、configMapを反映させるため、一度Podを削除します。
kubectl delete pods prometheus-core-XXX --namespace=monitoring
再起動して、RunningになっていればOKです。
起動に失敗した場合は、yamlの編集ミスなどが考えられます(自分がやったので)。
再起動後、grafanaを確認すると、ノード全体のCPUやMemory、Podのリソースなどが確認できています。
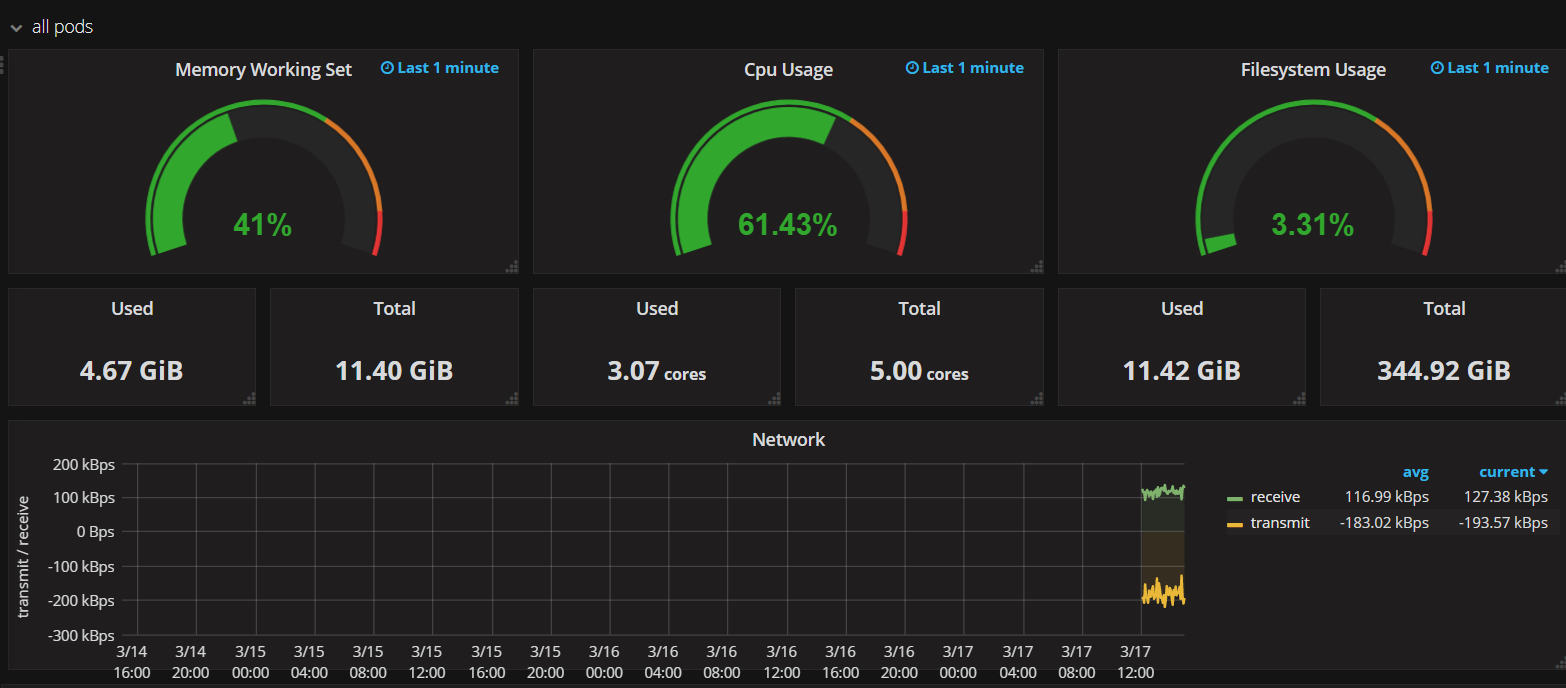
これでNodeの状態をグラフィカルに監視できました!
おわりに
Alertmanagerを利用することで、Nodeの状態によってSlackにアラートを飛ばすなども可能です。
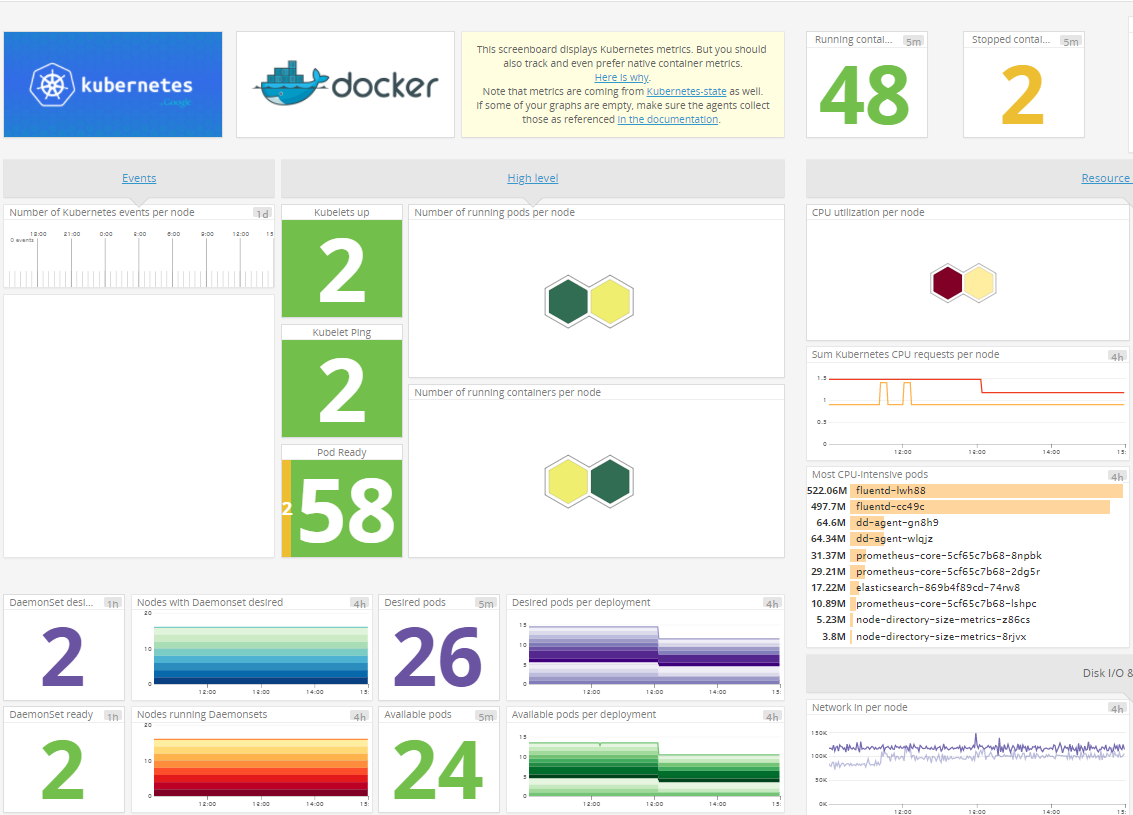
datadogだとdd-agentのdaemonsetを起動するだけでメトリクスが取れる&アラートも設定できるので、小規模orお金があるならdatadogでいい気がします。
以下は、datadogのkubernetesのクラスタ監視画面。わかりやすい。