はじめに
objective-cでつくったはいいけど使っていないクラスをswiftに書き換えてgithubにあげてみたので、そのクラスについて紹介したいと思います。自分はまだ使う場面がない(今のところ思いつかない)ので、あわよくばだれかに使ってもらえたらいいなと思います。(第四弾)
2019/04/21 せっかくなんでswift5.0対応しました
2019/10/16 せっかくなんでSwiftPM対応しました
GitHub
今回はこちらのクラスについて紹介します。
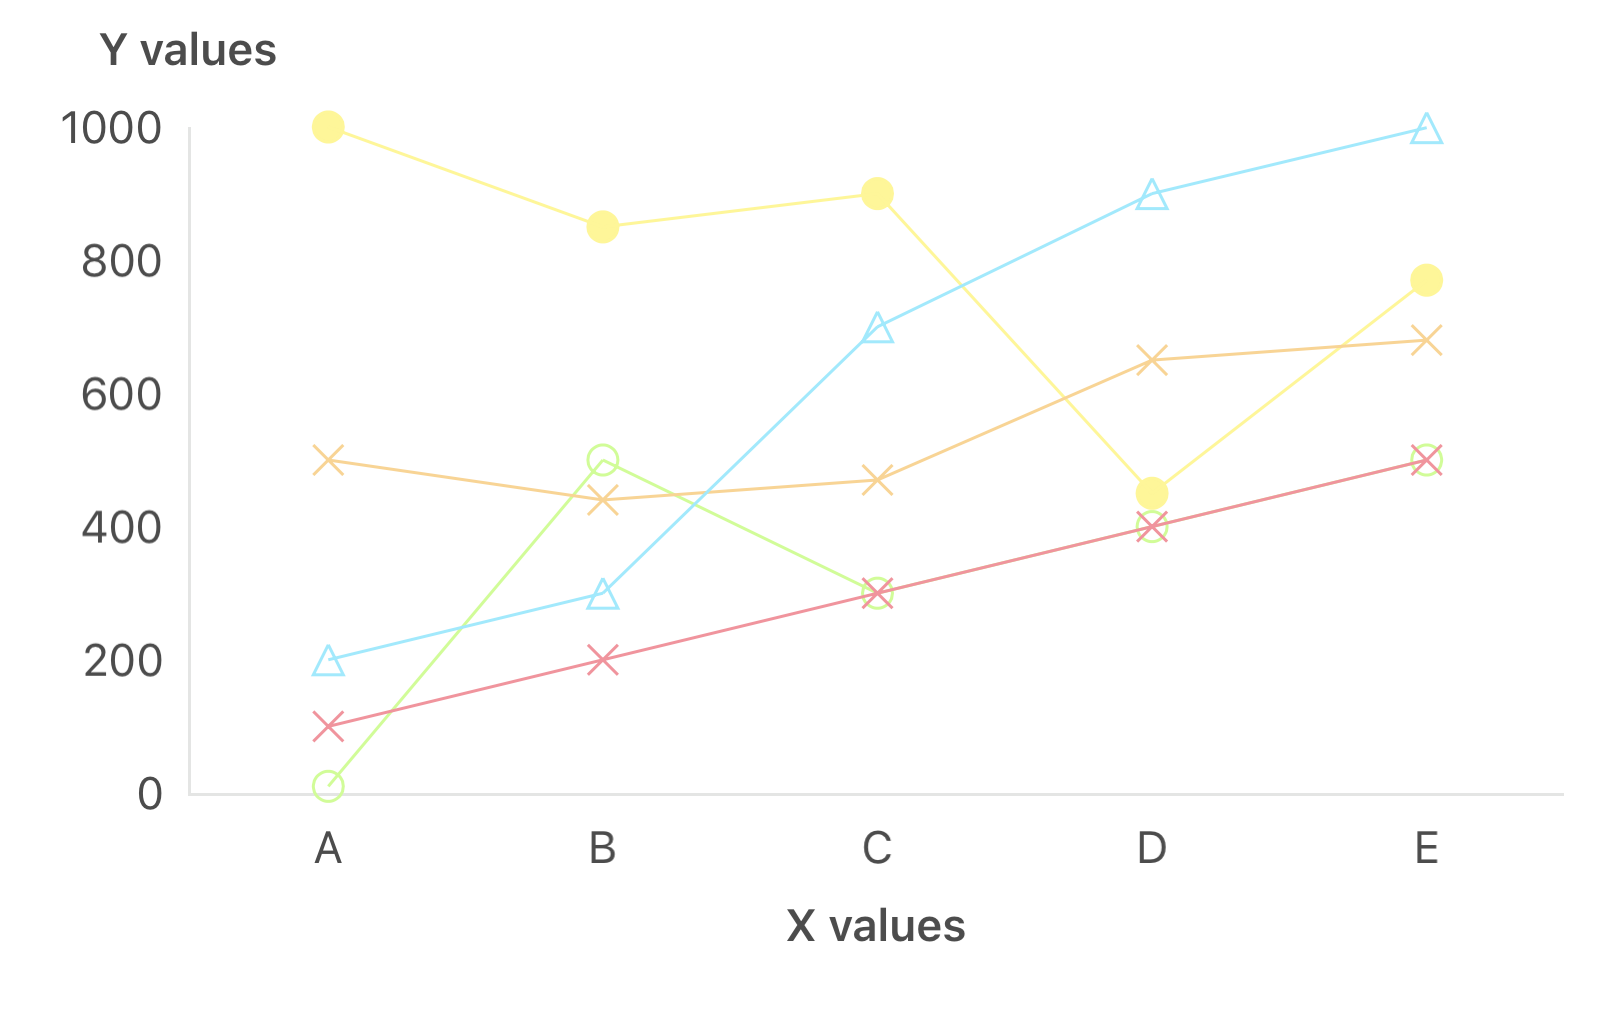
- AMLineChartView
- AMScatterChartView
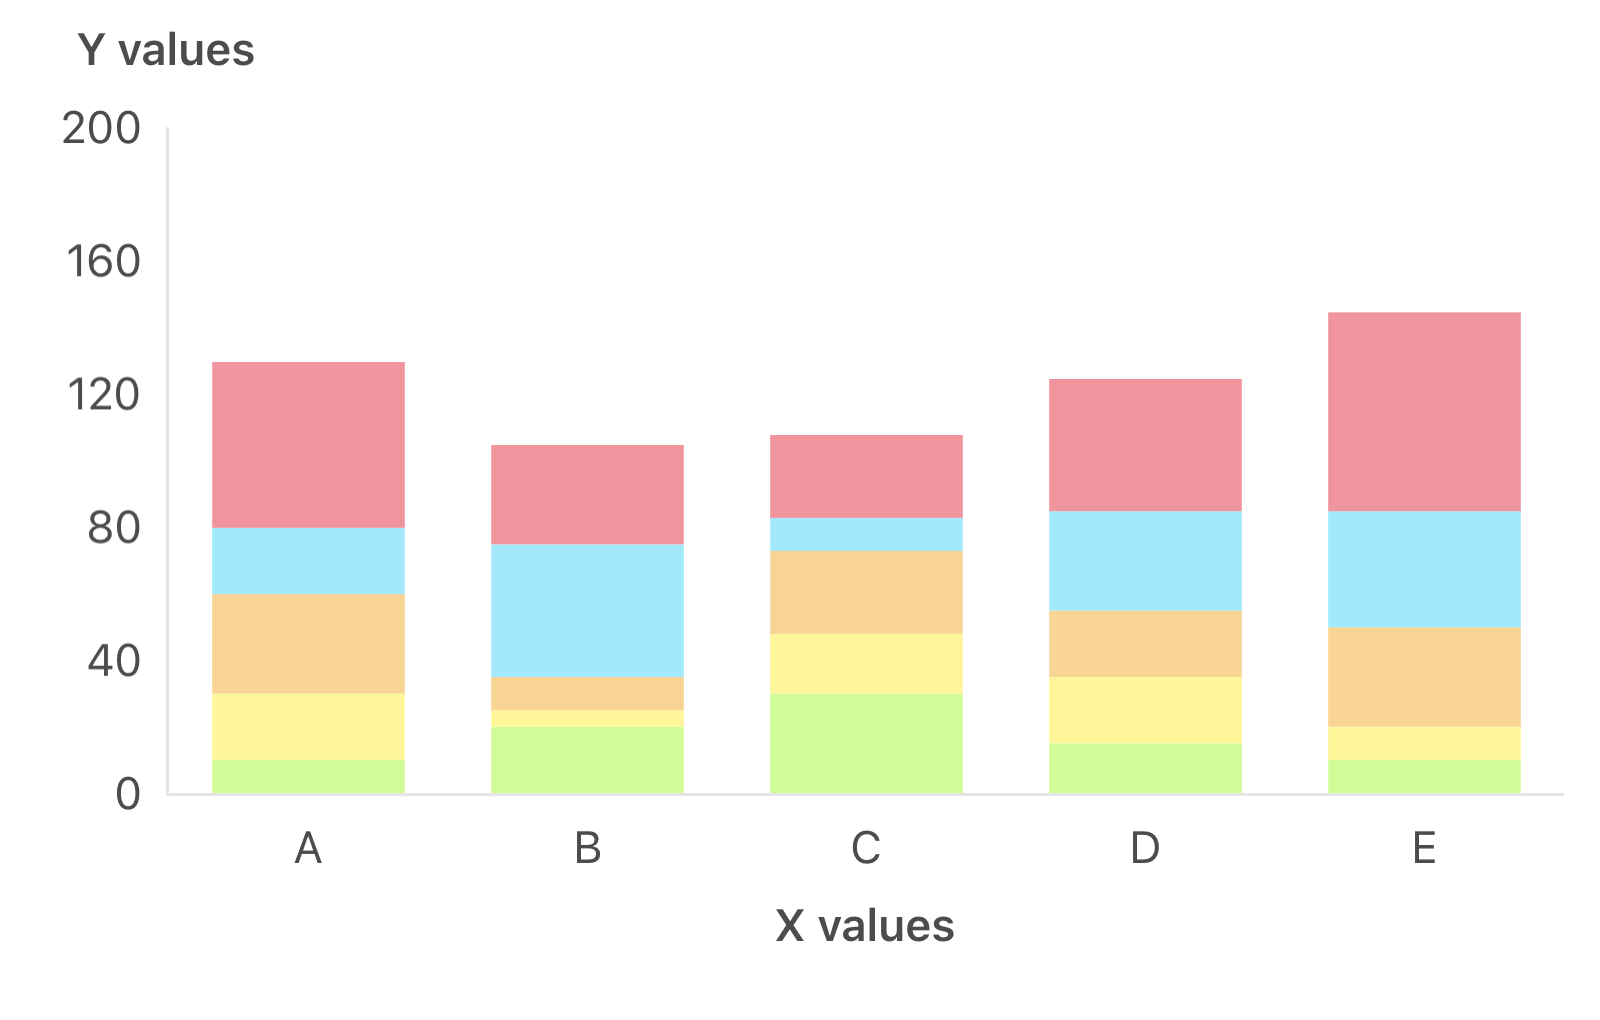
- AMBarChartView
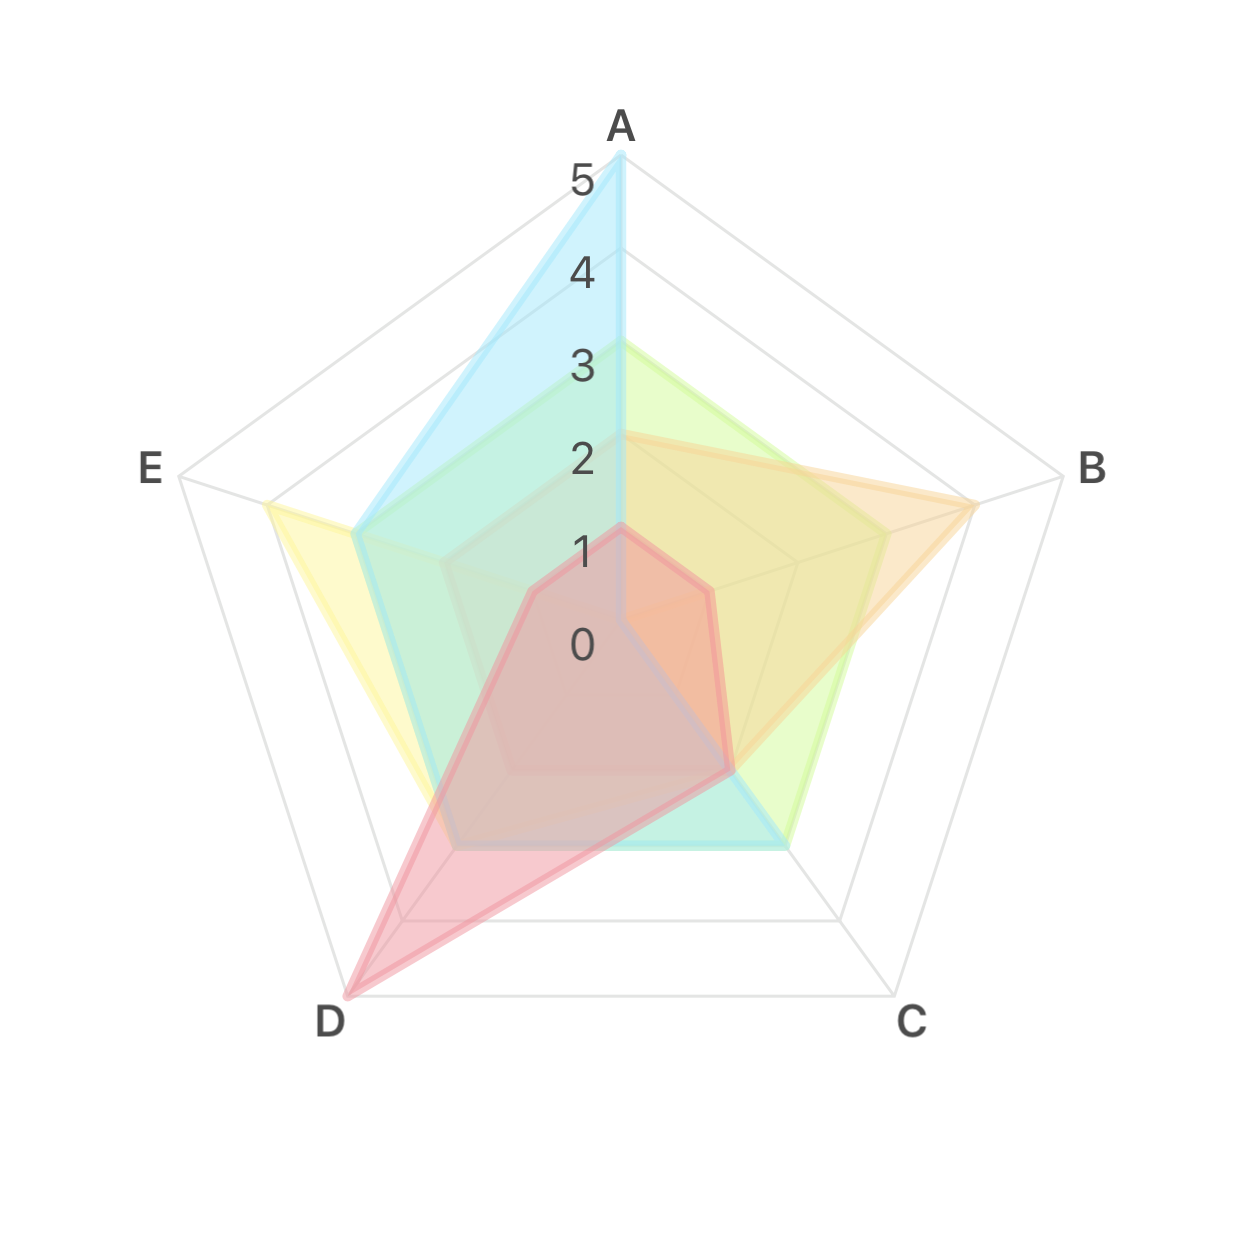
- AMRadarChartView
- AMPieChartView
見た目
機能
折れ線グラフ、散布図、棒グラフ、レーダーチャート、円グラフの表示ができる
使い方
- xibにカスタムクラスを設定

- 目盛りの最小値・最大値、目盛りの数などを設定

-
デリゲートを設定する
デリゲートはtableViewを意識してつくりました。AMLineChartView
sectionが各グラフ、rowが各点に相当する
protocol AMLineChartViewDataSource: AnyObject {

/// グラフの数を設定する
func numberOfSections(in lineChartView: AMLineChartView) -> Int

/// 折れ線の点の数を設定する
func numberOfRows(in lineChartView: AMLineChartView) -> Int

/// 折れ線の各点の値を設定する
func lineChartView(_ lineChartView: AMLineChartView, valueForRowAtIndexPath indexPath: IndexPath) -> CGFloat

/// 各グラフの色を設定する
func lineChartView(_ lineChartView: AMLineChartView, colorForSection section: Int) -> UIColor

/// X軸の文字を設定する
func lineChartView(_ lineChartView: AMLineChartView, titleForXlabelInRow row: Int) -> String

/// 各グラフの点の形を設定する
func lineChartView(_ lineChartView: AMLineChartView, pointTypeForSection section: Int) -> AMPointType
}
```
点の形には下記の種類がある

```swift
enum AMPointType {
/// 丸(塗りつぶしなし)
case type1
/// 丸(塗りつぶしあり)
case type2
/// 四角(塗りつぶしなし)
case type3
/// 四角(塗りつぶしあり)
case type4
/// 三角(塗りつぶしなし)
case type5
/// 三角(塗りつぶしあり)
case type6
/// ひし形(塗りつぶしなし)
case type7
/// ひし形(塗りつぶしあり)
case type8
/// ×印
case type9
}
```
こんな感じ
## AMScatterChartView
sectionが各グラフ、rowが各点に相当する

```swift
protocol AMScatterChartViewDataSource: AnyObject {

/// グラフの数を設定する
func numberOfSections(in scatterChartView: AMScatterChartView) -> Int

/// 各グラフの点の数を設定する
func scatterChartView(_ scatterChartView: AMScatterChartView, numberOfRowsInSection section: Int) -> Int

/// 散布図の各点の値を設定する
func scatterChartView(_ scatterChartView: AMScatterChartView, valueForRowAtIndexPath indexPath: IndexPath) -> AMScatterValue

/// 各グラフの色を設定する
func scatterChartView(_ scatterChartView: AMScatterChartView, colorForSection section: Int) -> UIColor

/// 各グラフの点の形を設定する
func scatterChartView(_ scatterChartView: AMScatterChartView, pointTypeForSection section: Int) -> AMPointType
}
```
グラフの値は下記の構造体を設定する

```swift
struct AMScatterValue {

	var xValue : CGFloat = 0
	var yValue : CGFloat = 0

	init(x :CGFloat, y :CGFloat) {
    	xValue = x
    	yValue = y
	}
}
```

点の種類は折れ線グラフと同様
こんな感じ
<img width="500" alt="chart_s.png" src="https://user-images.githubusercontent.com/34936885/67146918-fccb2c80-f2ca-11e9-8348-ee00d5febf12.png">

## AMBarChartView

sectionが各グラフ、rowが各項目に相当する

```swift
protocol AMBarChartViewDataSource: AnyObject {

/// グラフの数を設定する(棒の数)
func numberOfSections(in barChartView: AMBarChartView) -> Int

/// 各グラフの項目数を設定する
func barChartView(_ barChartView: AMBarChartView, numberOfRowsInSection section: Int) -> Int

/// 各グラフの項目の値を設定する
func barChartView(_ barChartView: AMBarChartView, valueForRowAtIndexPath indexPath: IndexPath) -> CGFloat

/// 各グラフの項目の色を設定する
func barChartView(_ barChartView: AMBarChartView, colorForRowAtIndexPath indexPath: IndexPath) -> UIColor

/// x軸の文字を設置する
func barChartView(_ barChartView: AMBarChartView, titleForXlabelInSection section: Int) -> String
}
```
こんな感じ
## AMRadarChartView

sectionが各グラフ、rowが各項目に相当する

```swift
protocol AMRadarChartViewDataSource: AnyObject {

/// グラフの数を設定する
func numberOfSections(in radarChartView: AMRadarChartView) -> Int

/// 項目数を設定する(頂点の数)
func numberOfRows(in radarChartView: AMRadarChartView) -> Int

/// 各項目の値を設定する
func radarChartView(_ radarChartView: AMRadarChartView, valueForRowAtIndexPath indexPath: IndexPath) -> CGFloat

/// 各グラフの塗りつぶし色を設定する
func radarChartView(_ radarChartView: AMRadarChartView, fillColorForSection section: Int) -> UIColor

/// 各グラフの枠線色を設定する
func radarChartView(_ radarChartView: AMRadarChartView, strokeColorForSection section: Int) -> UIColor

/// 各頂点の文字を設定する
func radarChartView(_ radarChartView: AMRadarChartView, titleForVertexInRow row: Int) -> String

/// 各頂点の文字フォントを設定する
func radarChartView(_ radarChartView: AMRadarChartView, fontForVertexInRow row: Int) -> UIFont

/// 各頂点の文字色を設定する
func radarChartView(_ radarChartView: AMRadarChartView, textColorForVertexInRow row: Int) -> UIColor
}
```
こんな感じ
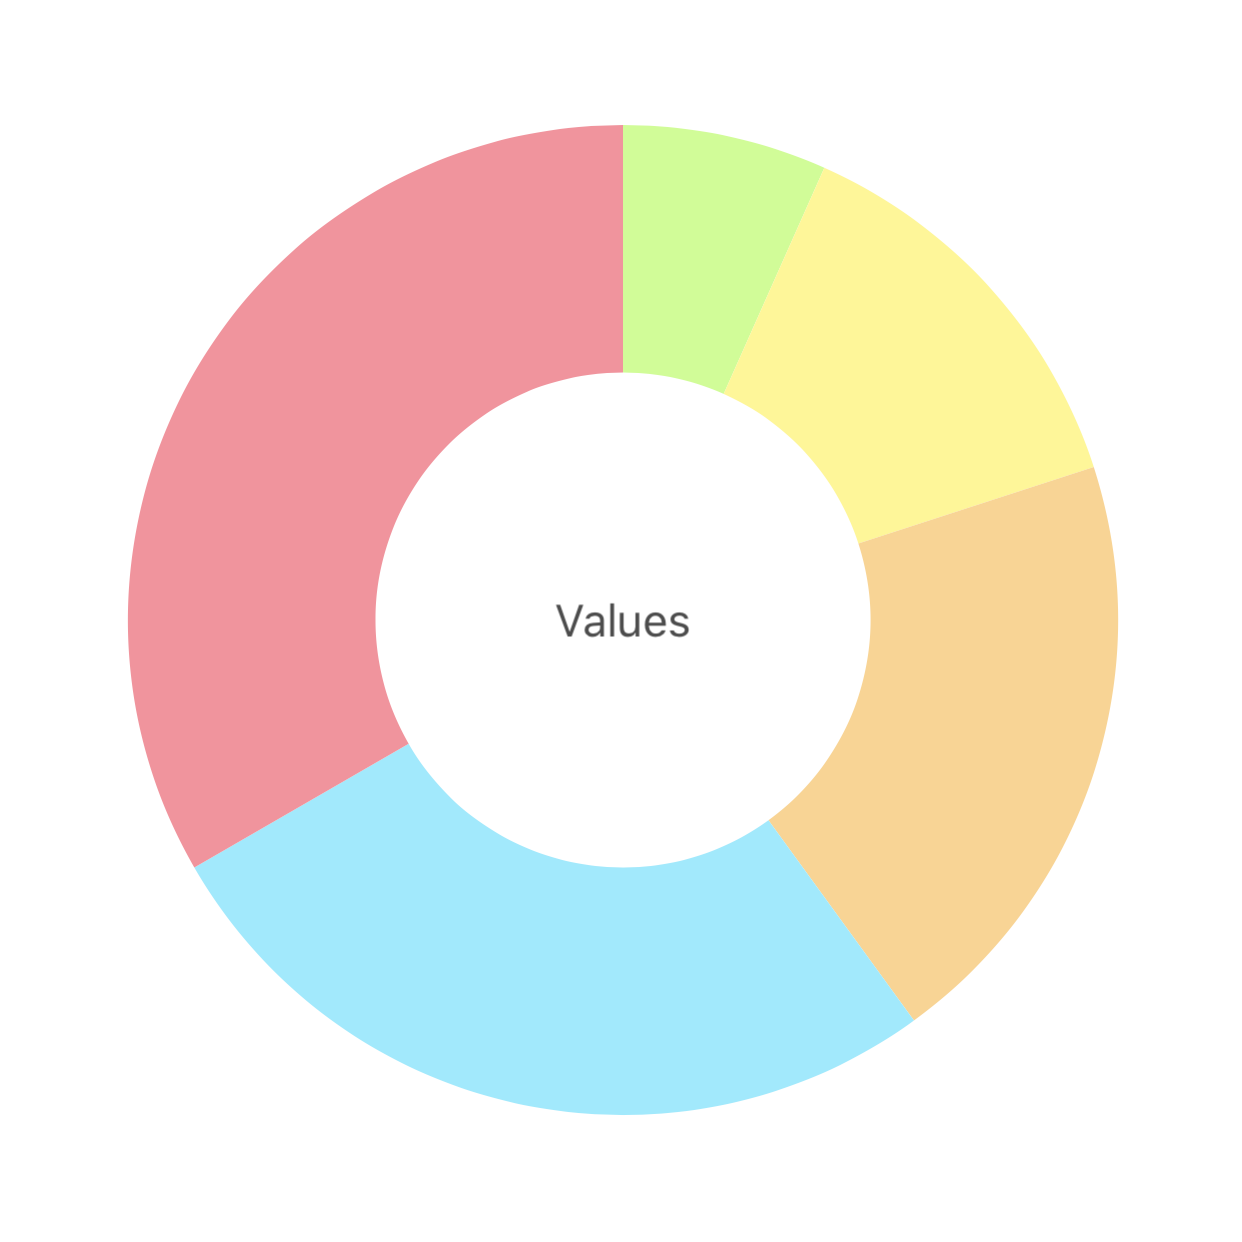
## AMPieChartView

sectionが各項目に相当する

```swift
protocol AMPieChartViewDataSource: AnyObject {

/// 扇の数を設定する
func numberOfSections(in pieChartView: AMPieChartView) -> Int

/// 各項目の値を設定する
func pieChartView(_ pieChartView: AMPieChartView, valueForSection section: Int) -> CGFloat

/// 各項目の色を設定する
func pieChartView(_ pieChartView: AMPieChartView, colorForSection section: Int) -> UIColor
}
```
円グラフのみ選択のアクションがある

```swift
protocol AMPieChartViewDelegate: AnyObject {

/// 項目選択時に呼ばれる
func pieChartView(_ pieChartView: AMPieChartView, didSelectSection section: Int)

/// 項目選択解除時に呼ばれる
func pieChartView(_ pieChartView: AMPieChartView, didDeSelectSection section: Int)
}
```
こんな感じ
つくったきっかけ
ある日、「次の要望でグラフを表示するかもしれない。」と言われグラフ表示用のクラスを色々つくってみた。グラフはライブラリが充実しているので最初は公開されているものを使おうか迷ったが、時間もあったので勉強がてら自作することにした。
使わなかった理由
そんな要望がくることはなかった...
さいごに
今回は時間があり、細かいカスタマイズもできると思い自作したが、公開されているライブラリを利用する方がいいように思う。工数もかからないし、長い間利用されているものであればバグも少ないと思われる。
これとかすごいcharts(github:danielgindi/Charts)
私はほぼObjective-Cしか使ったことがないペーペーのプログラマーなので記事内容やgithubのコードにおかしなところがあればご指摘いただければ幸いです。
つくったのまとめ
- アナログ時計を描画してみた(swift)
- スピードメーターをつくってみた(swift)
- めくるカレンダーをつくってみた(swift)
- グラフを描画してみた(swift)
- ちからわざで日本地図を描いてみた(swift)
- カラーピッカーをつくってみた(swift)
- 面積比がそれっぽいベン図を描いてみた(swift)
- UIViewを燃やしてみた(swift)