This article is written in English. Japanese Version is here.
Introduction
Welcome to the third installment of our tutorial series on structural analysis in the age of AlphaFold2 (First time, Second time). This time, we will derive the initial phase from the structure factor F(hkl). As the title indicates "In the Era of AlphaFold2," we will use the high-precision model structures output by AlphaFold2 to derive the initial phase.
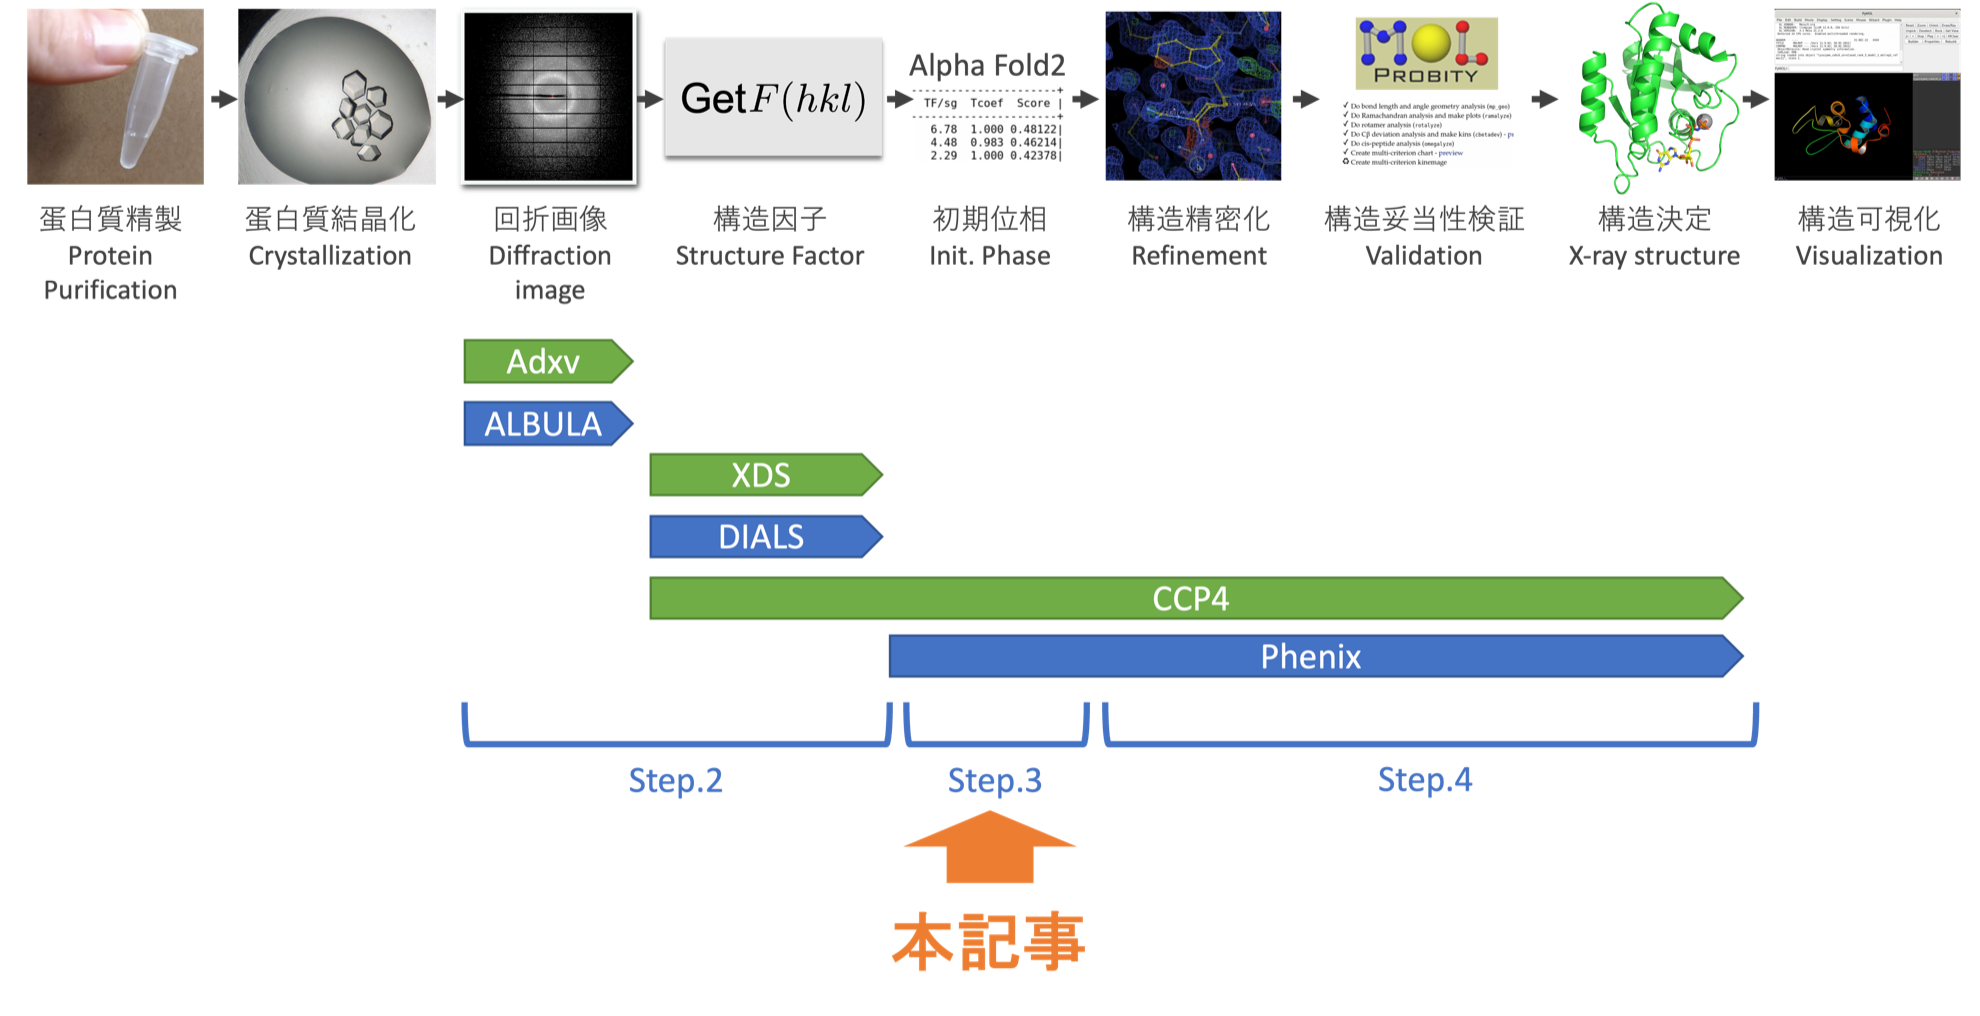
Table of Contents
- Step.0 The flow of structure determination
- Step.1 Installing analytical software
- Step.2 Checking diffraction images and calculating structure factors
- Step.3 Finding initial phases(This article)
- Step.4 Structure refinement and validation
Target Audience and Purpose of This Article
This article aims to enable researchers, graduate students, and undergraduates who are not specialized in protein X-ray crystallography to understand the entire process of protein X-ray crystal structure analysis, from diffraction images to structure determination. We assume that readers have some familiarity with Bash commands in a Linux environment.
In this article, we will present a tutorial on protein structure analysis in a four-part series. This is the third part.
Also, this article is completely open. Whether at schools, research institutions, or companies, we would be delighted if you could spread this article and use it for educational purposes. However, we have not abandoned copyright.
Computing Environment Needed for Protein X-ray Crystallographic Analysis
From my experience, the following computing environment is suitable for protein X-ray crystallographic analysis. It requires computer power, so it's important not to attempt it on a Raspberry Pi or similar device.
- OS
- Linux, such as Ubuntu, CentOS (strongly recommended)
- MacOSX
- Windows 10/11 (use either the native environment or a Linux environment on WSL2)
- CPU: > 4 cores (recommended: > 16 cores)
- Main Memory: > 16 GB (recommended: > 32 GB)
- Storage: > 50 GB (about 12 GB for software installation, data sets 20 - 30 GB/crystal)
- GPU: Not essential (recommended: equipped with a GPU)
In this step, we will perform the analysis on a virtual machine on Google Cloud Platform, which we set up inStep.1.
Github Repository
We have uploaded representative files related to this tutorial to Github. We hope it will serve as a useful reference.
Step.3 Deriving the Initial Phase
Step.3-0 Preparation: What are the Initial Phase and the MR Method?
As explained in Step 0, the phase problem is a stumbling block in protein X-ray crystallography. This is due to the inability of current 2D detectors (such as the EIGER detector from DECTRIS) to directly observe the phase α(hkl). You may wonder how then is it computed? It may sound peculiar, but we backtrack the phase α(hkl) from the constructed model of the protein structure (which is what we want to achieve), thereby obtaining the electron density ρ(xyz). However, to construct the protein model structure, the electron density ρ(xyz) is required in the first place1. Thus, the protein model structure and phase α(hkl) are mutually dependent, analogous to the "which came first, the chicken or the egg?" conundrum, making the process of obtaining the protein model structure challenging.
Without overcoming this obstacle, obtaining the target protein model structure would be impossible. Therefore, we first obtain a rough initial phase α(hkl) to gain an approximate electron density ρ(xyz), which allows for some model construction. Afterward, the protein model structure is constructed using the derived initial phase, from which a new phase α(hkl) and new electron density ρ(xyz) are calculated. The model structure is then improved based on the enhanced electron density ρ(xyz). This cycle is repeated, gradually refining the protein model structure. This process is referred to as Refinement.
While the phase problem can be solved in the field of low-molecular X-ray crystal structure analysis (inorganic, organic compounds) by harnessing computer power through the Direct Method, this approach is not feasible for protein X-ray crystallography when the molecule is large (= the unit cell is large). Therefore, numerous methods have been developed by our predecessors to obtain the initial phase. These methods are mainly divided into ①experimental techniques (MIR, MAD, SAD methods, etc.) and ②computational methods (MR method). The experimental methods ①, unless sulfur atoms (S) from Cysteine or Methionine are present in the protein2, require additional experiments such as introducing heavy atoms into the protein crystal, which are time, money, and labor-intensive. On the other hand, in the computational method ②, the Molecular Replacement method (MR) is used, which leverages similar protein structures, does not require additional experiments, and can be entirely executed on a computer, making it very convenient.
From my experience, for example, where an experimental method (SAD method using heavy atoms like Pt) takes 1-2 months, the determination of the initial phase can be completed within about 5 minutes using the MR method. Due to its convenience, the MR method is often selected as the first choice to determine the initial phase. However, when a similar structure cannot be found, there was no choice but to rely on the experimental methods for determining the initial phase3.
This situation was transformed with the introduction of AlphaFold2 developed by DeepMind. Until now, similar structures used in the MR method were obtained from the Protein Data Bank (PDB) using sequence information. However, protein structures are highly diverse based on their amino acid sequences, and even if the sequences are similar (it has been said that a 30% sequence similarity suggests a potential similar structure), critical amino acid mutations that can alter the overall structure can result in substantial differences between the target structure and the similar structure, making structural determination difficult at times. Here is where the highly accurate protein structure prediction model, AlphaFold2, comes into play. Instead of finding similar structures from the PDB, it is expected that very accurate initial phases can be obtained if the protein model structure output by AlphaFold2 is used as a similar structure for the MR method. In fact, many structural biologists on Twitter are expressing their surprise (example)(JP). Therefore, it is expected that the use of AlphaFold2 + MR method will become the mainstream method for determining the initial phase, and this tutorial will follow this approach for deriving the initial phase.
Step 3-1: Preparing Model Structures Using AlphaFold2
This section will guide you on how to use AlphaFold2 to output model structures for input into the molecular replacement method. However, the original AlphaFold2 released by DeepMind requires a huge database (around 2.6TB) and expensive GPU (which uses a large amount of VRAM in proportion to the length of the protein sequence), making it a high hurdle for casual use. Therefore, we will be using one implementation of AlphaFold2, ColabFold, which operates on Google Colaboratory, a Python analysis execution platform provided for free by Google. For a detailed understanding of AlphaFold2 and ColabFold, please refer to articles by Professor Mori at the University of Tokyo, one of the developers, on Qiita(JP) and the overview published on JSBi Bioinformatics Review(JP).
- Access ColabFold's GitHub repository and launch Google Colaboratory's Notebooks from the "AlphaFold2_mmseq2" link. Please note that a Google account is required to use Google Colaboratory.

2. The basic usage is as written in the opened Notebook. Input the sequence of Lysozyme in query_sequence. Be careful not to insert any spaces in the sequence. Additionally, while it's optional, input a recognizable name in jobname. Then, select Run all from Runtime to start the inference of the model structure. After processing, a zip file will be automatically downloaded. If a warning appears, select Run anyway.
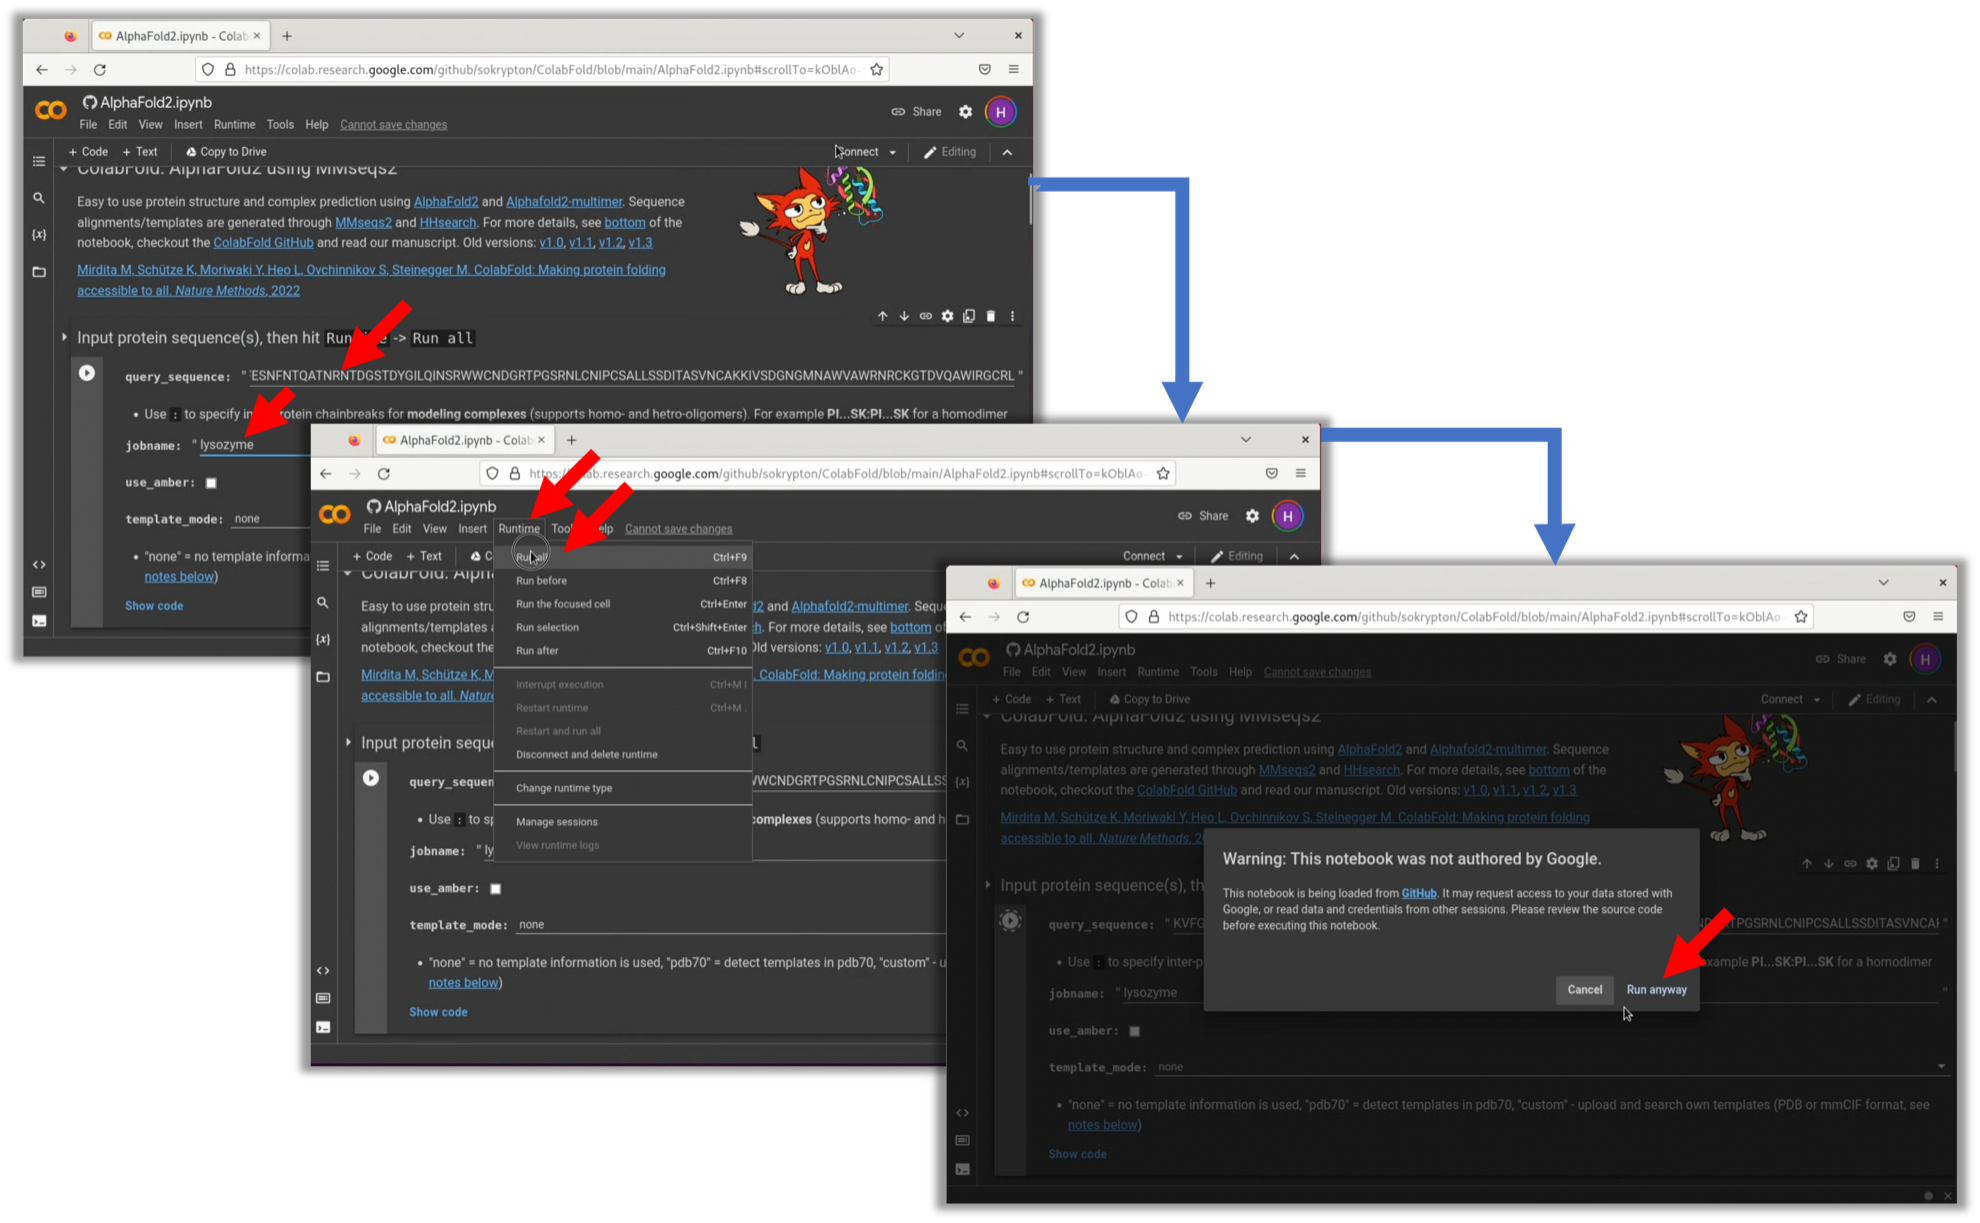
KVFGRCELAAAMKRHGLDNYRGYSLGNWVCAAKFESNFNTQATNRNTDGSTDYGILQINSRWWCNDGRTPGSRNLCNIPCSALLSSDITASVNCAKKIVSDGNGMNAWVAWRNRCKGTDVQAWIRGCRL
The author has uploaded the Lysozyme model structure inferred using ColabFold here. Feel free to use it as needed.
Step 3-2: Determining Initial Phases via Molecular Replacement (MR)
Using the predicted model structure obtained from AlphaFold2, we will perform molecular replacement (MR).
Step 3-2-1: MR with Structure Factors F(hkl) (Space Group: P41212)
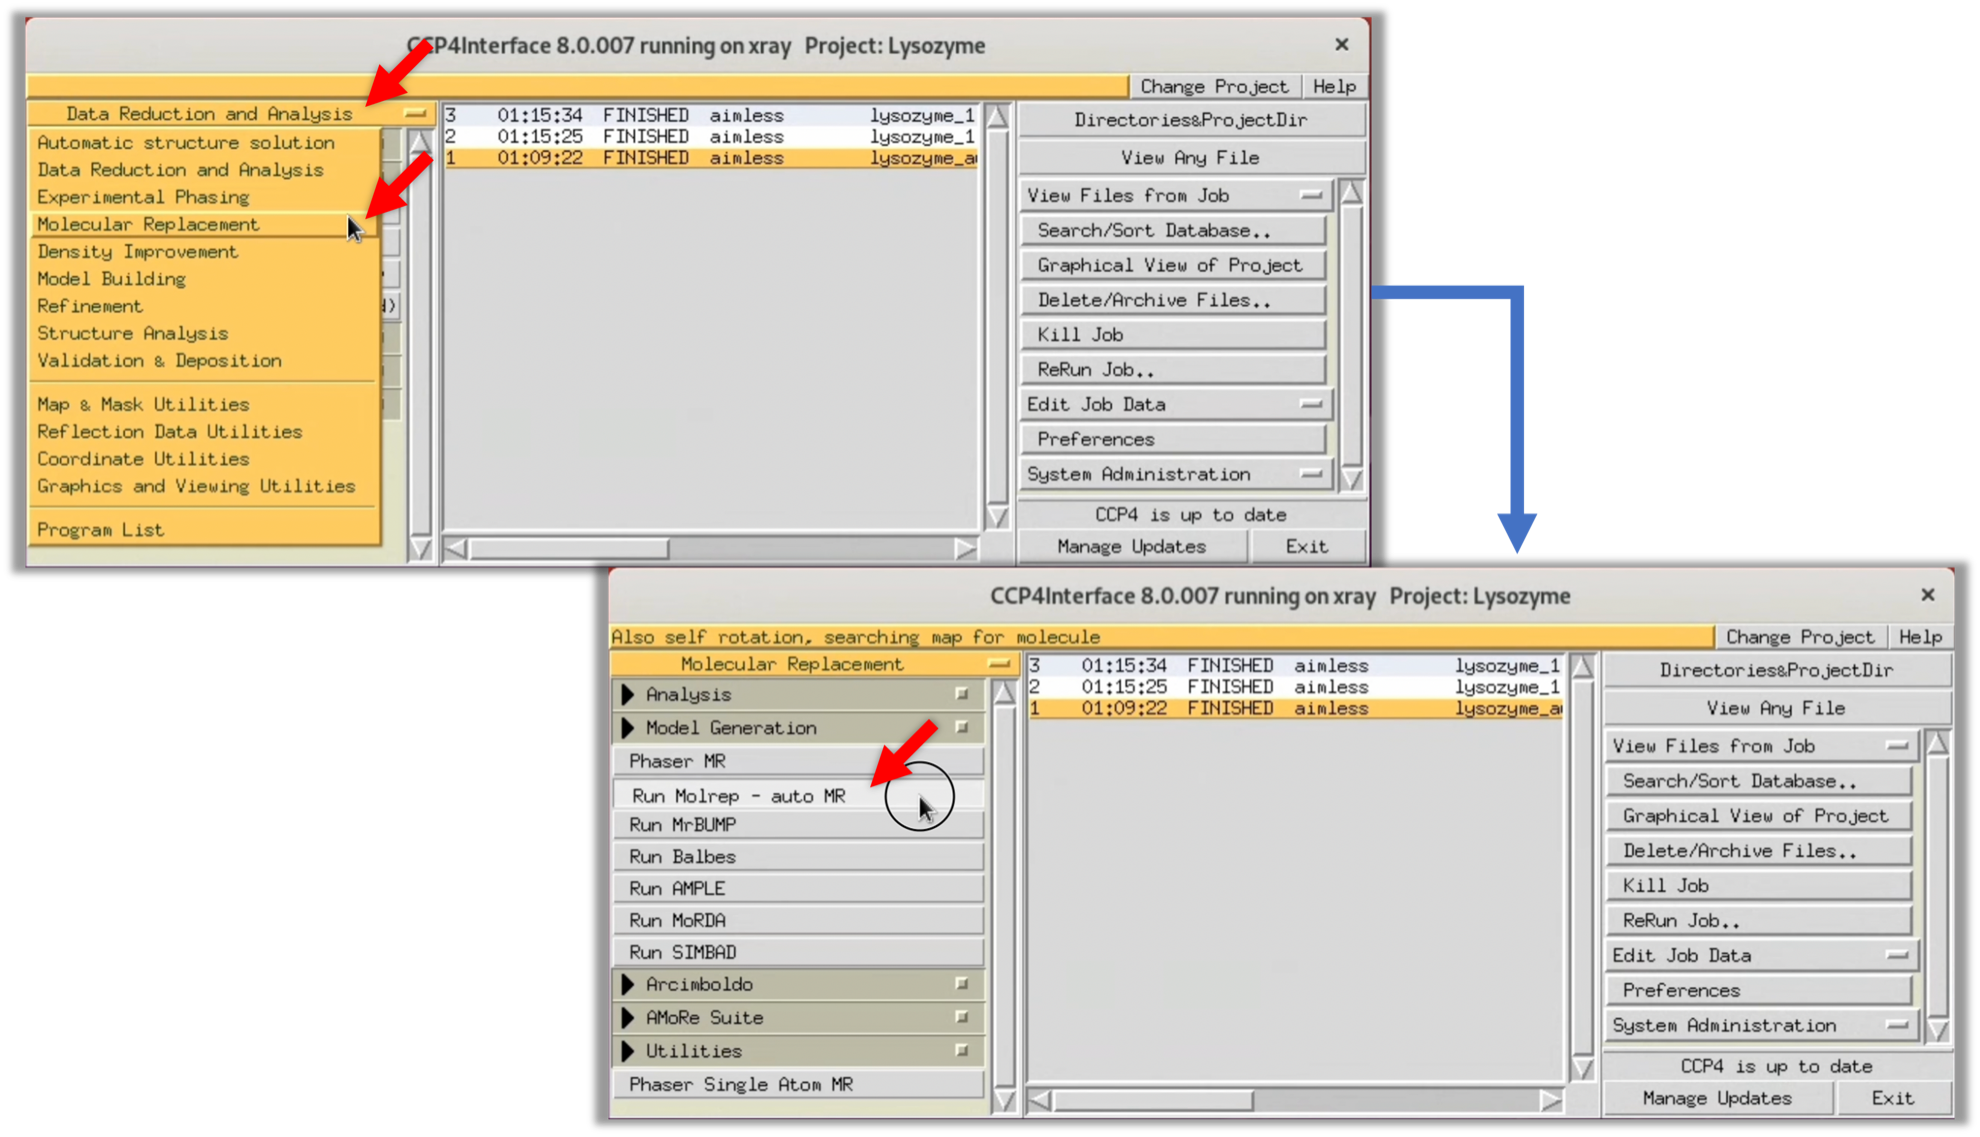
- Launch CCP4i, then select
Data Reduction and Analysis-->Molecular Replacementfrom the menu on the left, and start the Molecular Replacement software,Molrep.
$ ccp4i
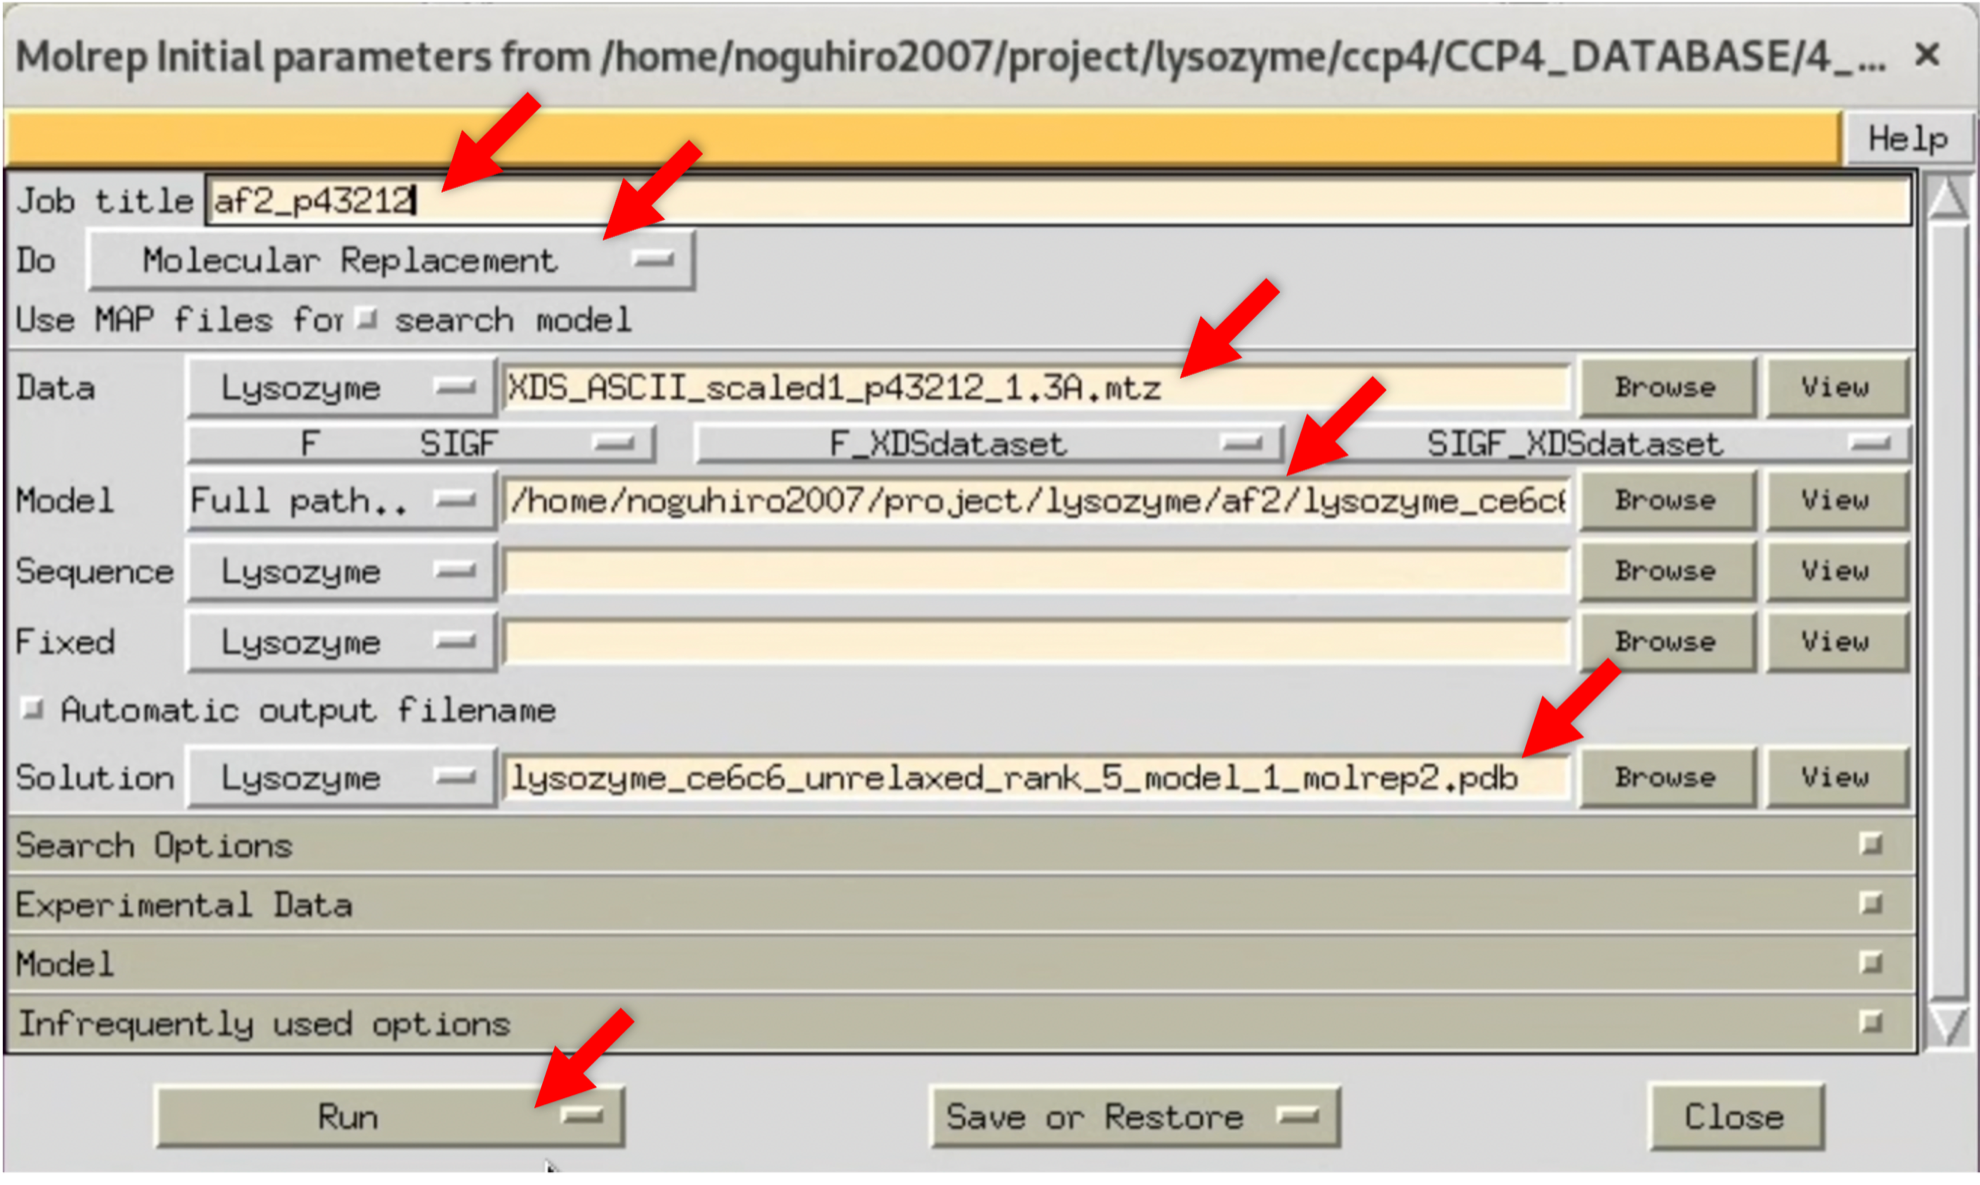
2. Refer to the image below and input the necessary fields in the opened Molrep window. For "Data", specify the structure factor F(hkl) finally obtained in Step 2 after scaling. For "Model", specify the protein model structure predicted in Step 3-1. "Solution" is automatically filled in, but you may specify an appropriate filename depending on the situation. Once the inputs are completed, select Run --> Run Now to start MR.
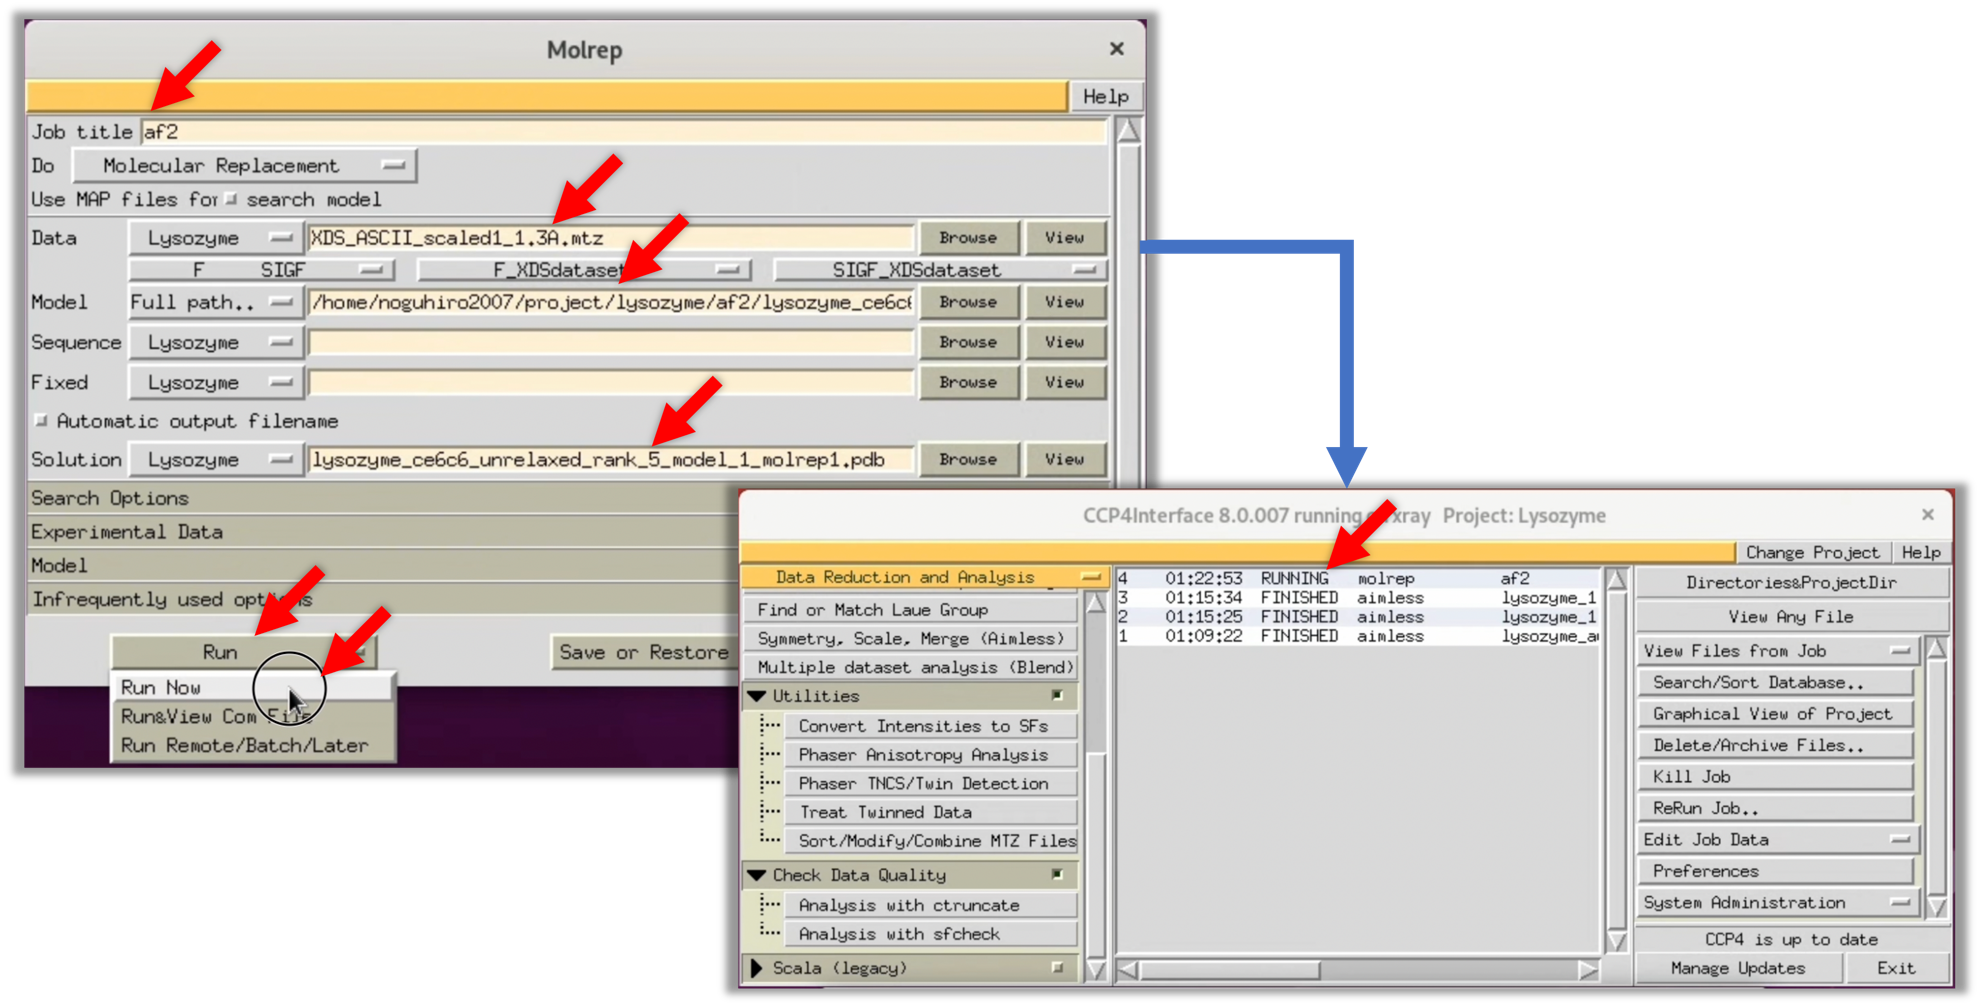
Though the default settings of ColabFold output five predicted model structures, an appropriate one is used for MR.
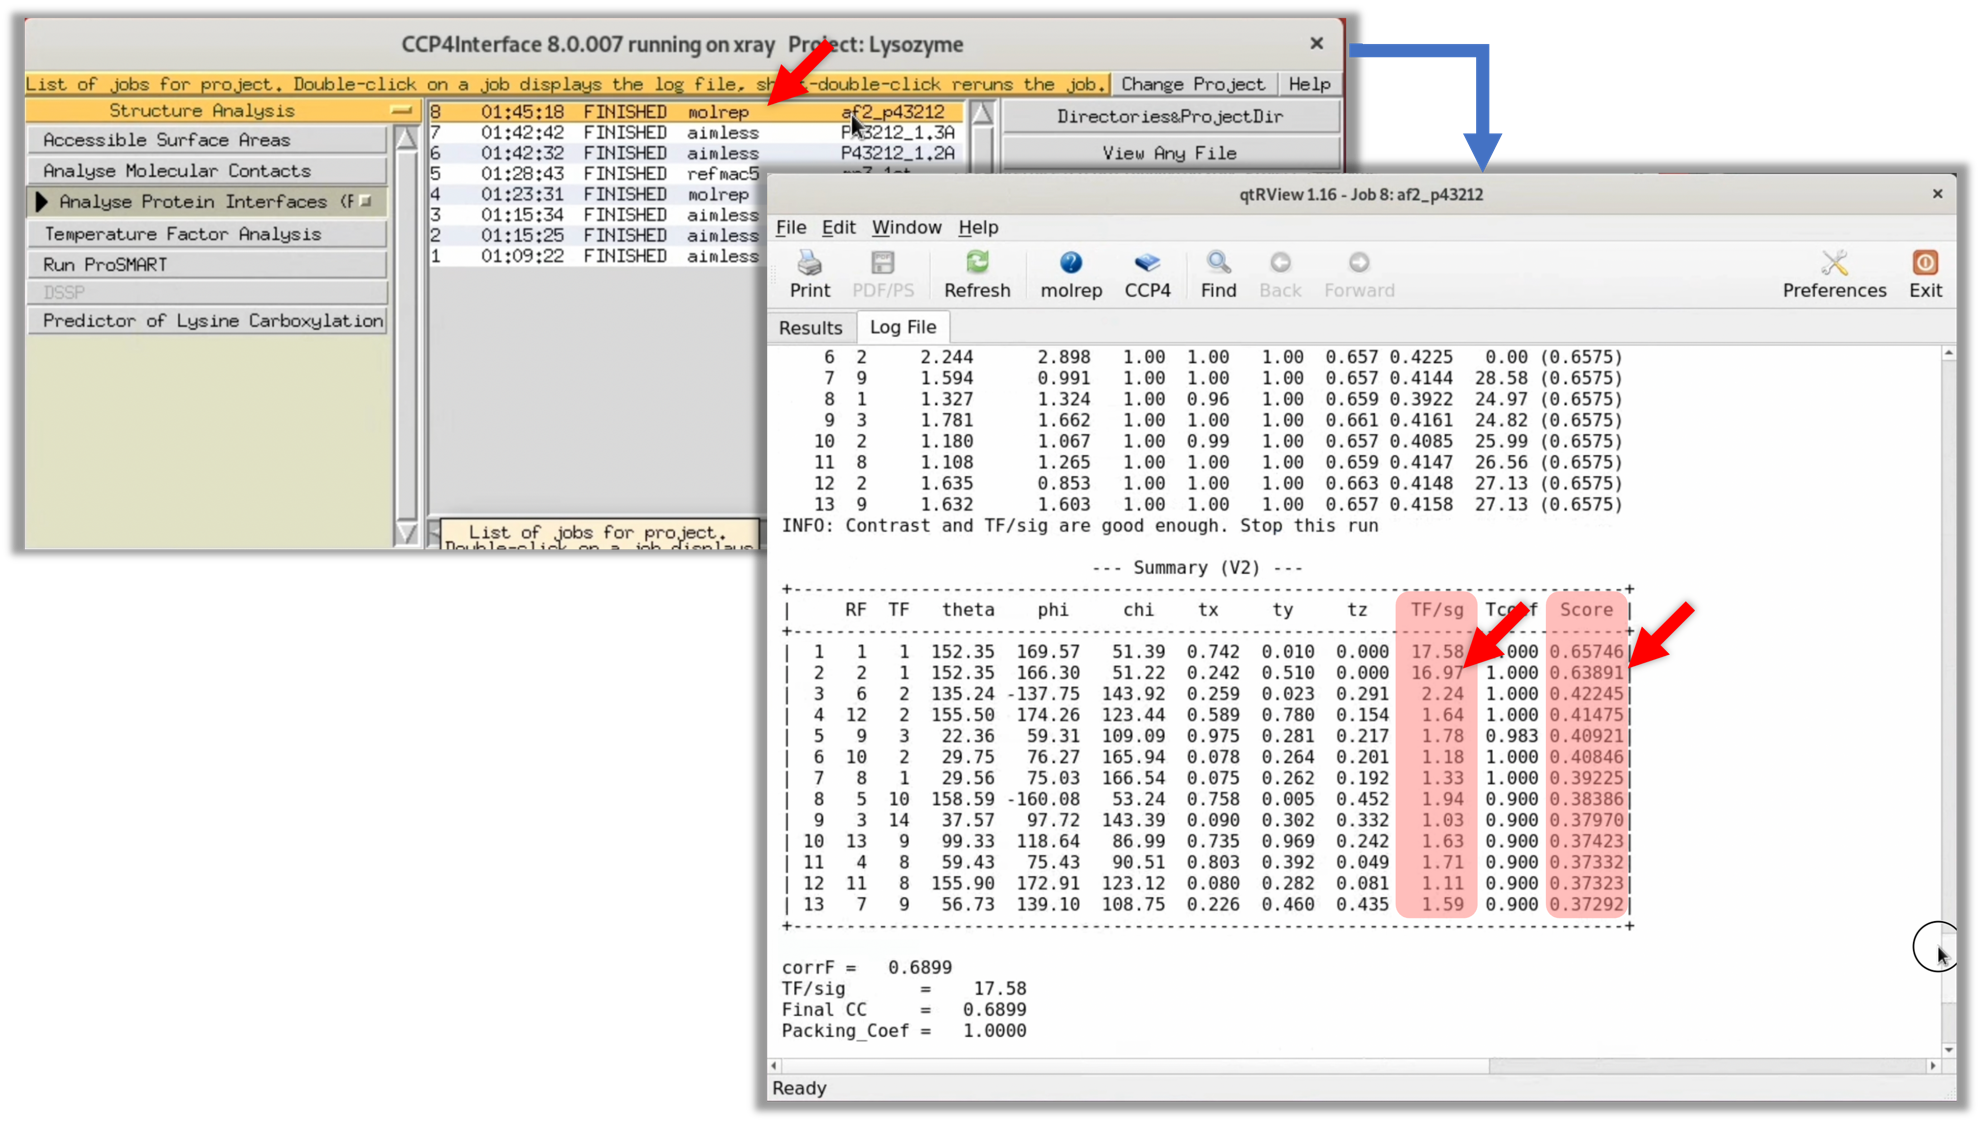
3. Once the process is complete, the status changes to "FINISHED". Double-click on this item to view the log in the GUI. From there, click on the Log File tab to see the original log output from MOLREP. At this point, the focus should be on the TF/sg and Score columns in the "--- Summary (V2) ---" table (highlighted in red). Generally, if the correct initial phase is obtained, both the TF/sg and Score will be significantly higher than the other solutions.
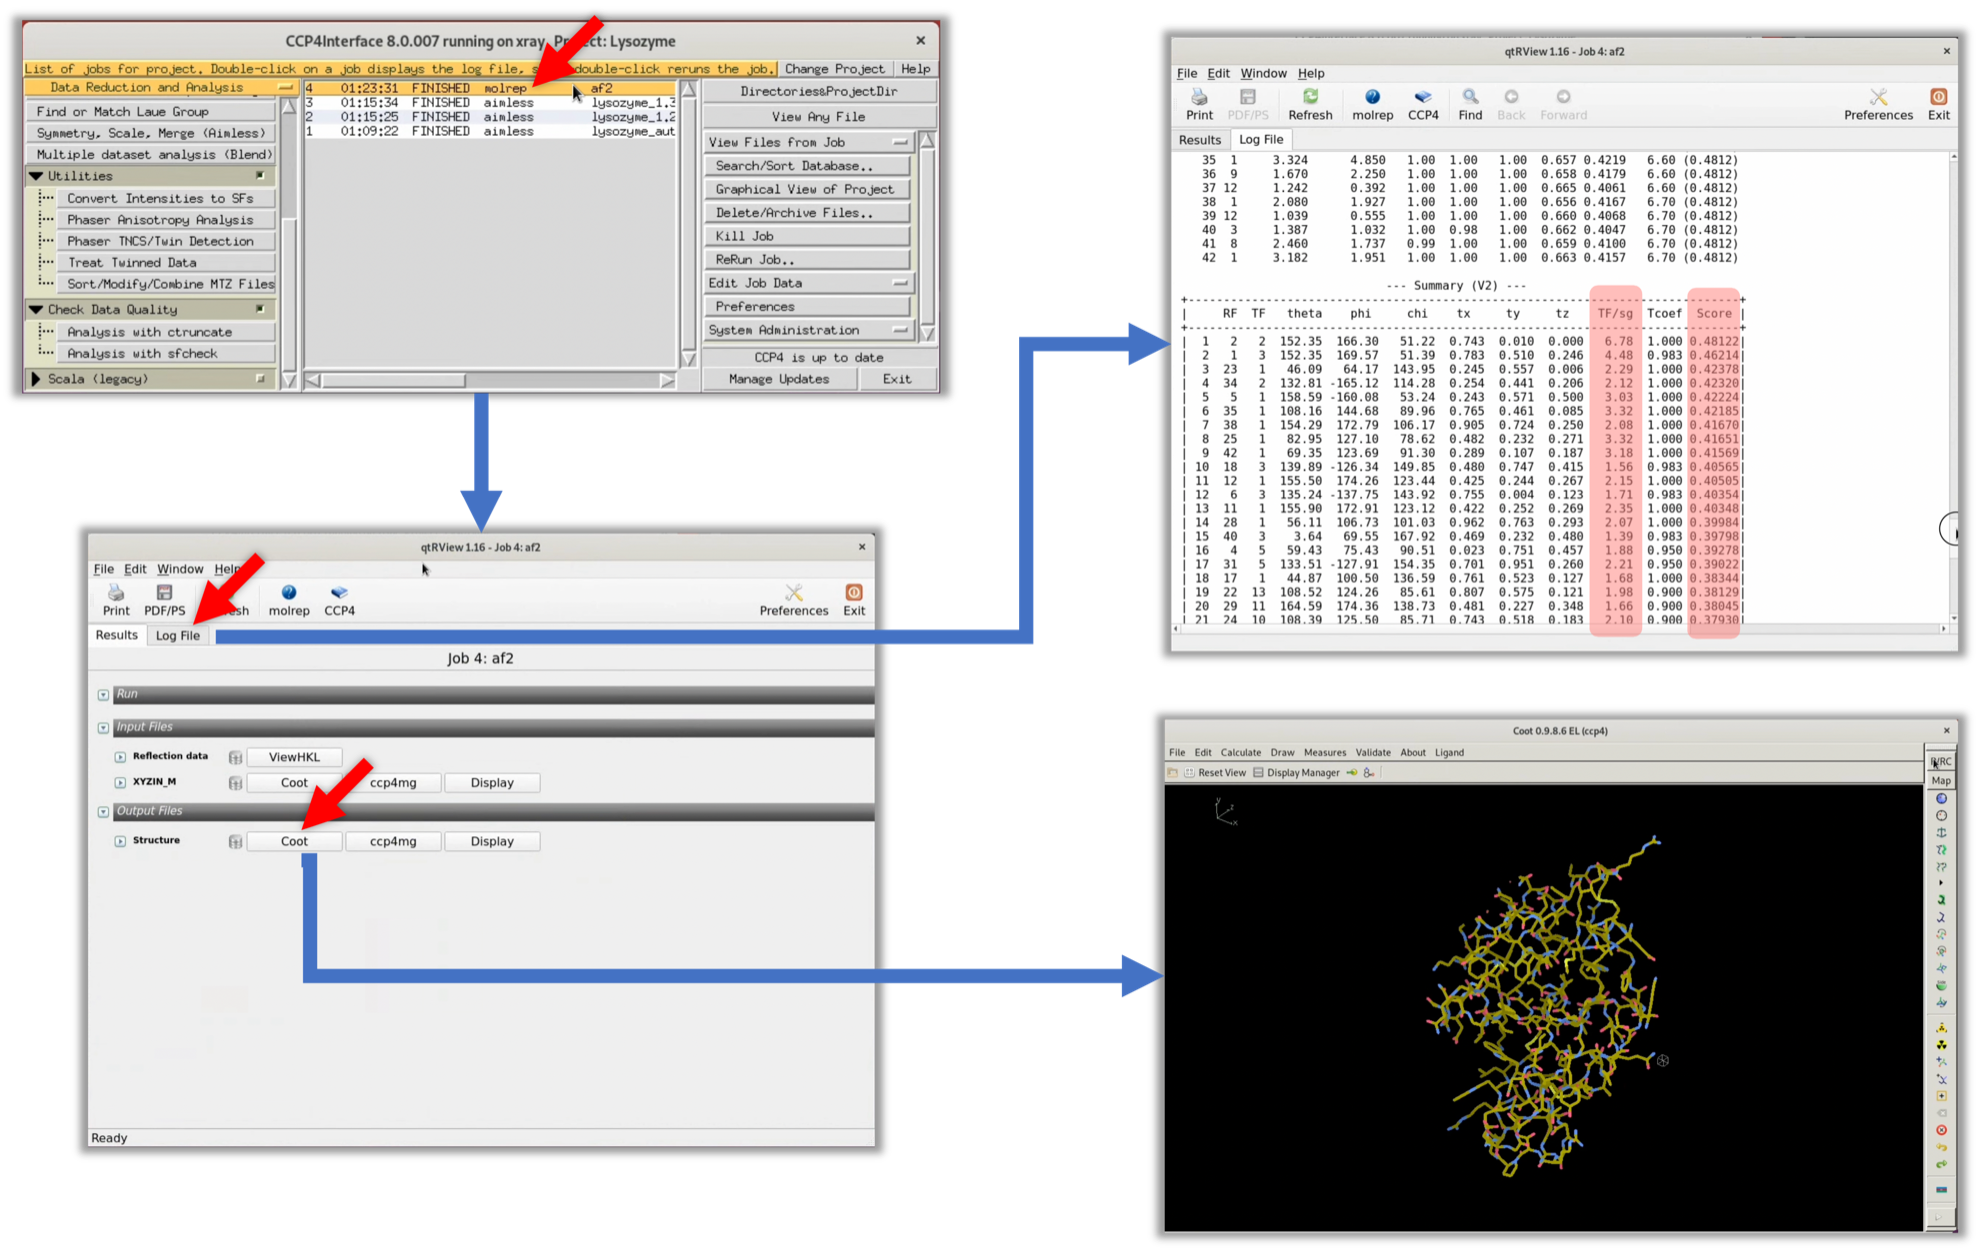
The values in the TF/sg and Score columns of the MOLREP log are not significantly higher than the other values. Therefore, it is highly likely that an appropriate initial phase has not been obtained.
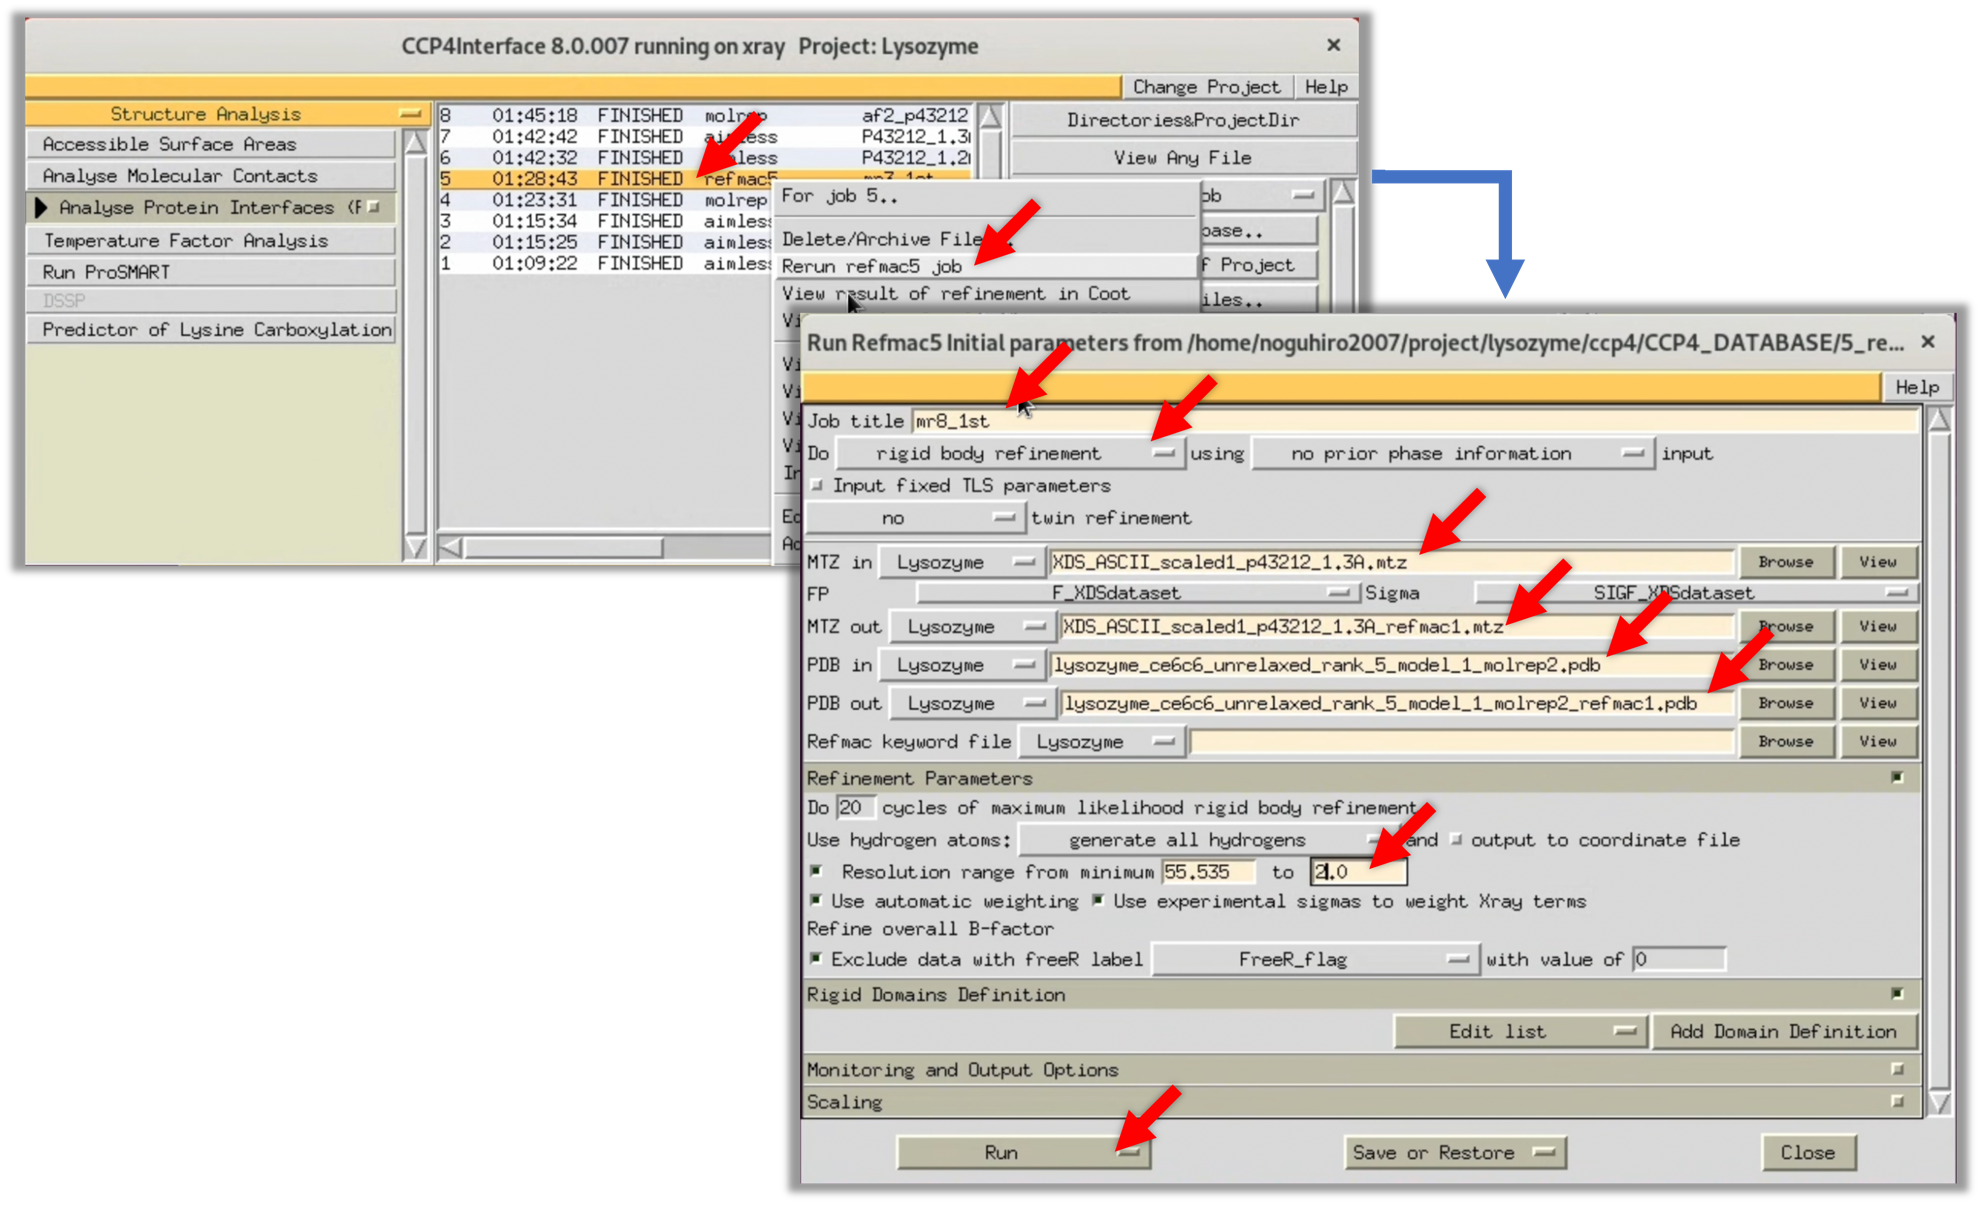
4. Even if the TF/sg and Score values from the MOLREP log suggest that it's unlikely that a suitable solution has been obtained, we will check the electron density map ρ(xyz) with our own eyes. To do so, we use the refinement software Refmac to perform one refinement and generate an electron density map ρ(xyz). From the CCP4i menu, select Refinement --> Run Refmac5 to display the parameter input window for Refmac.
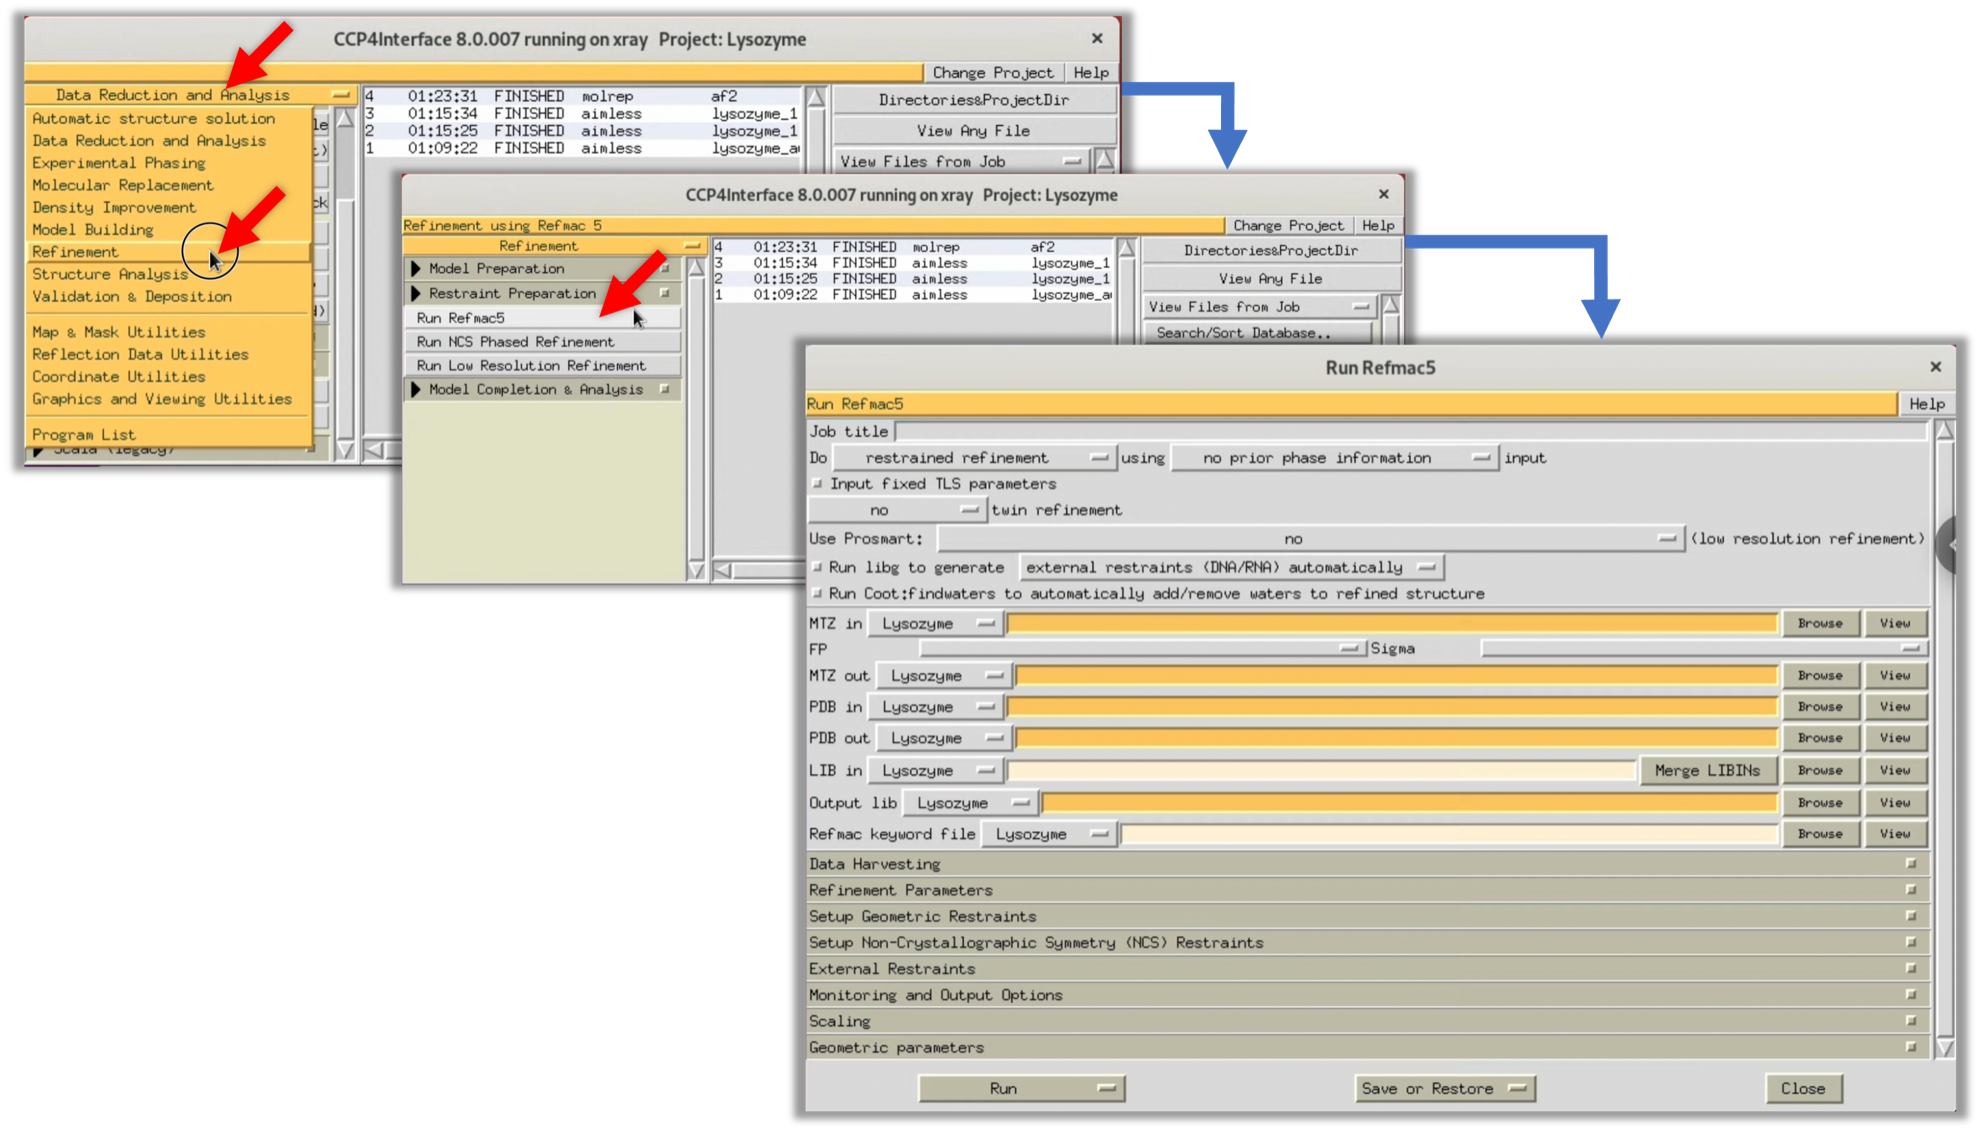
5. Refer to the red arrow in the figure to input the necessary parameters. Then select Run --> Run Now to start Refmac.
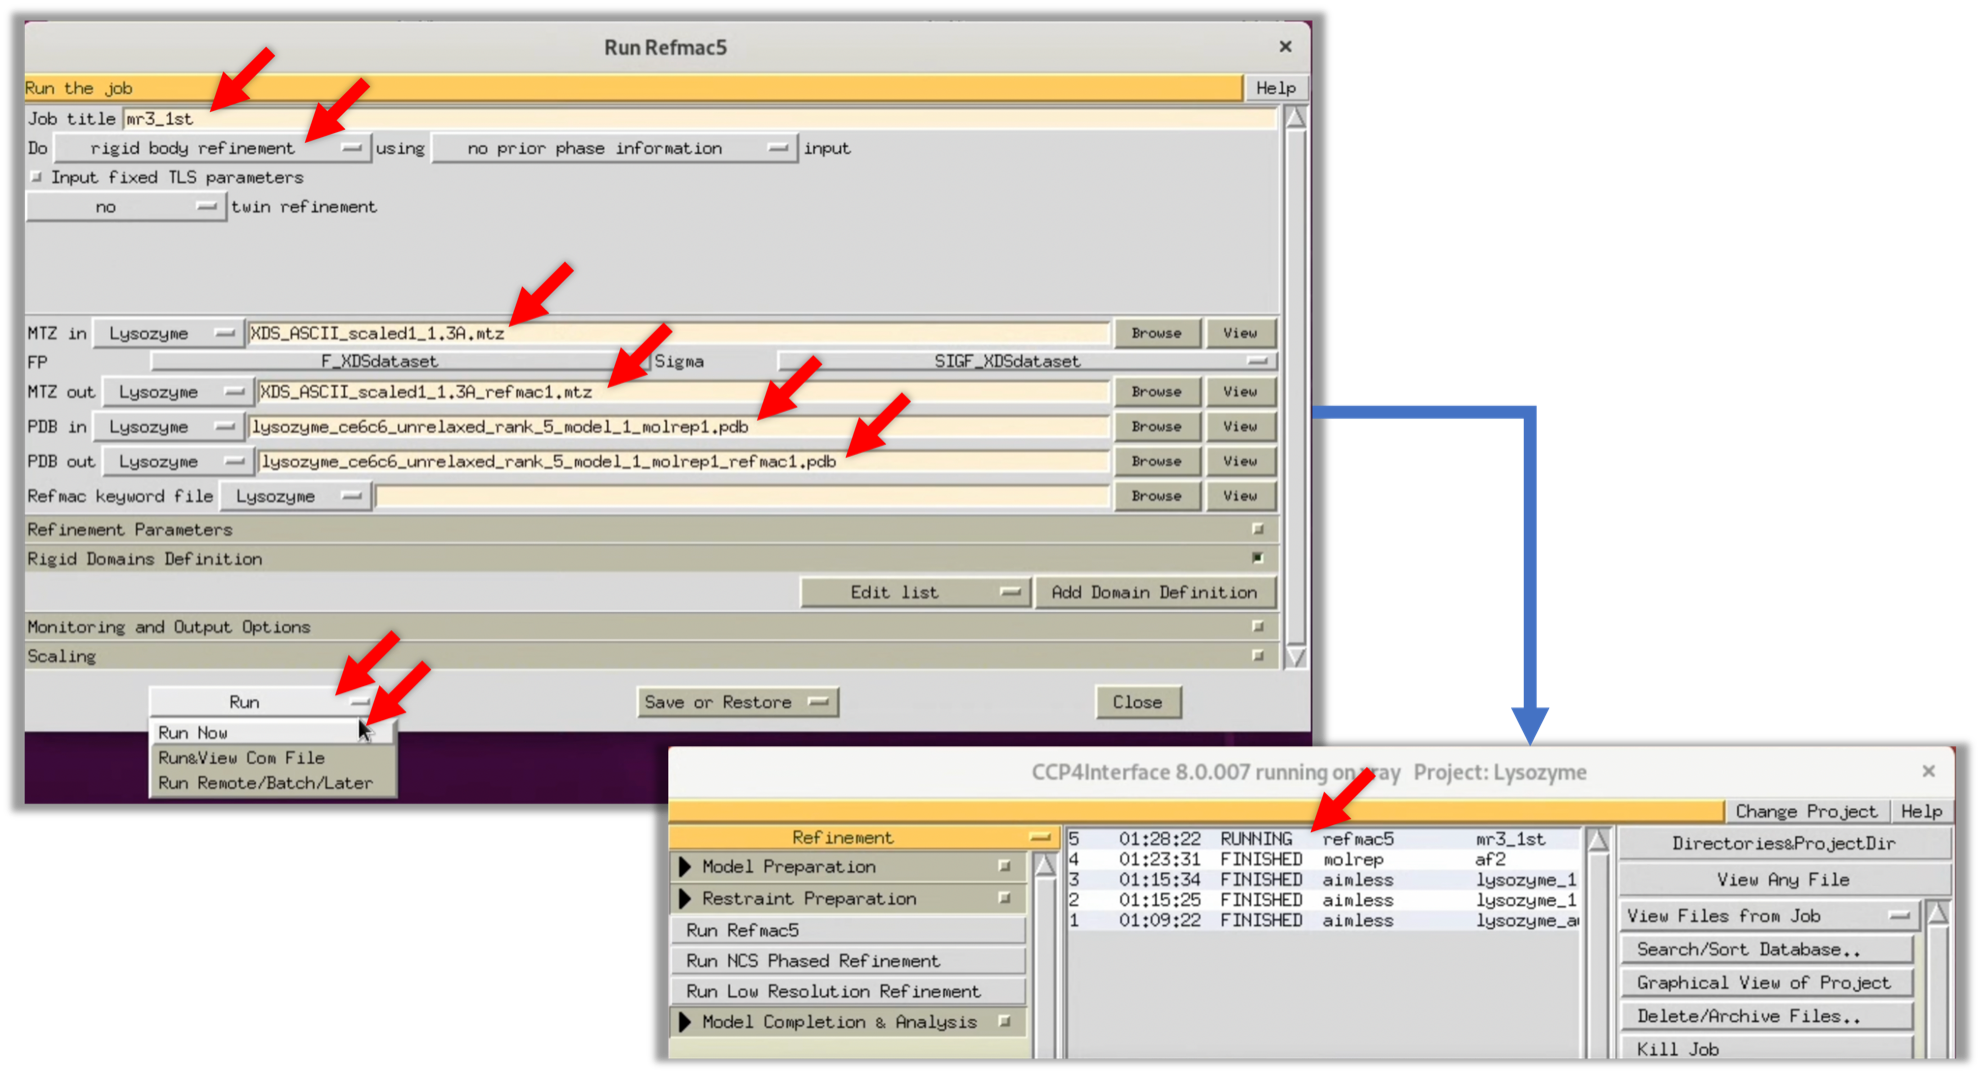
6. When Refmac's process has finished (FINISHED), double-click on that item and click the Coot button at the bottom of the displayed window to launch Coot, a protein structure and map viewer frequently used in this field.
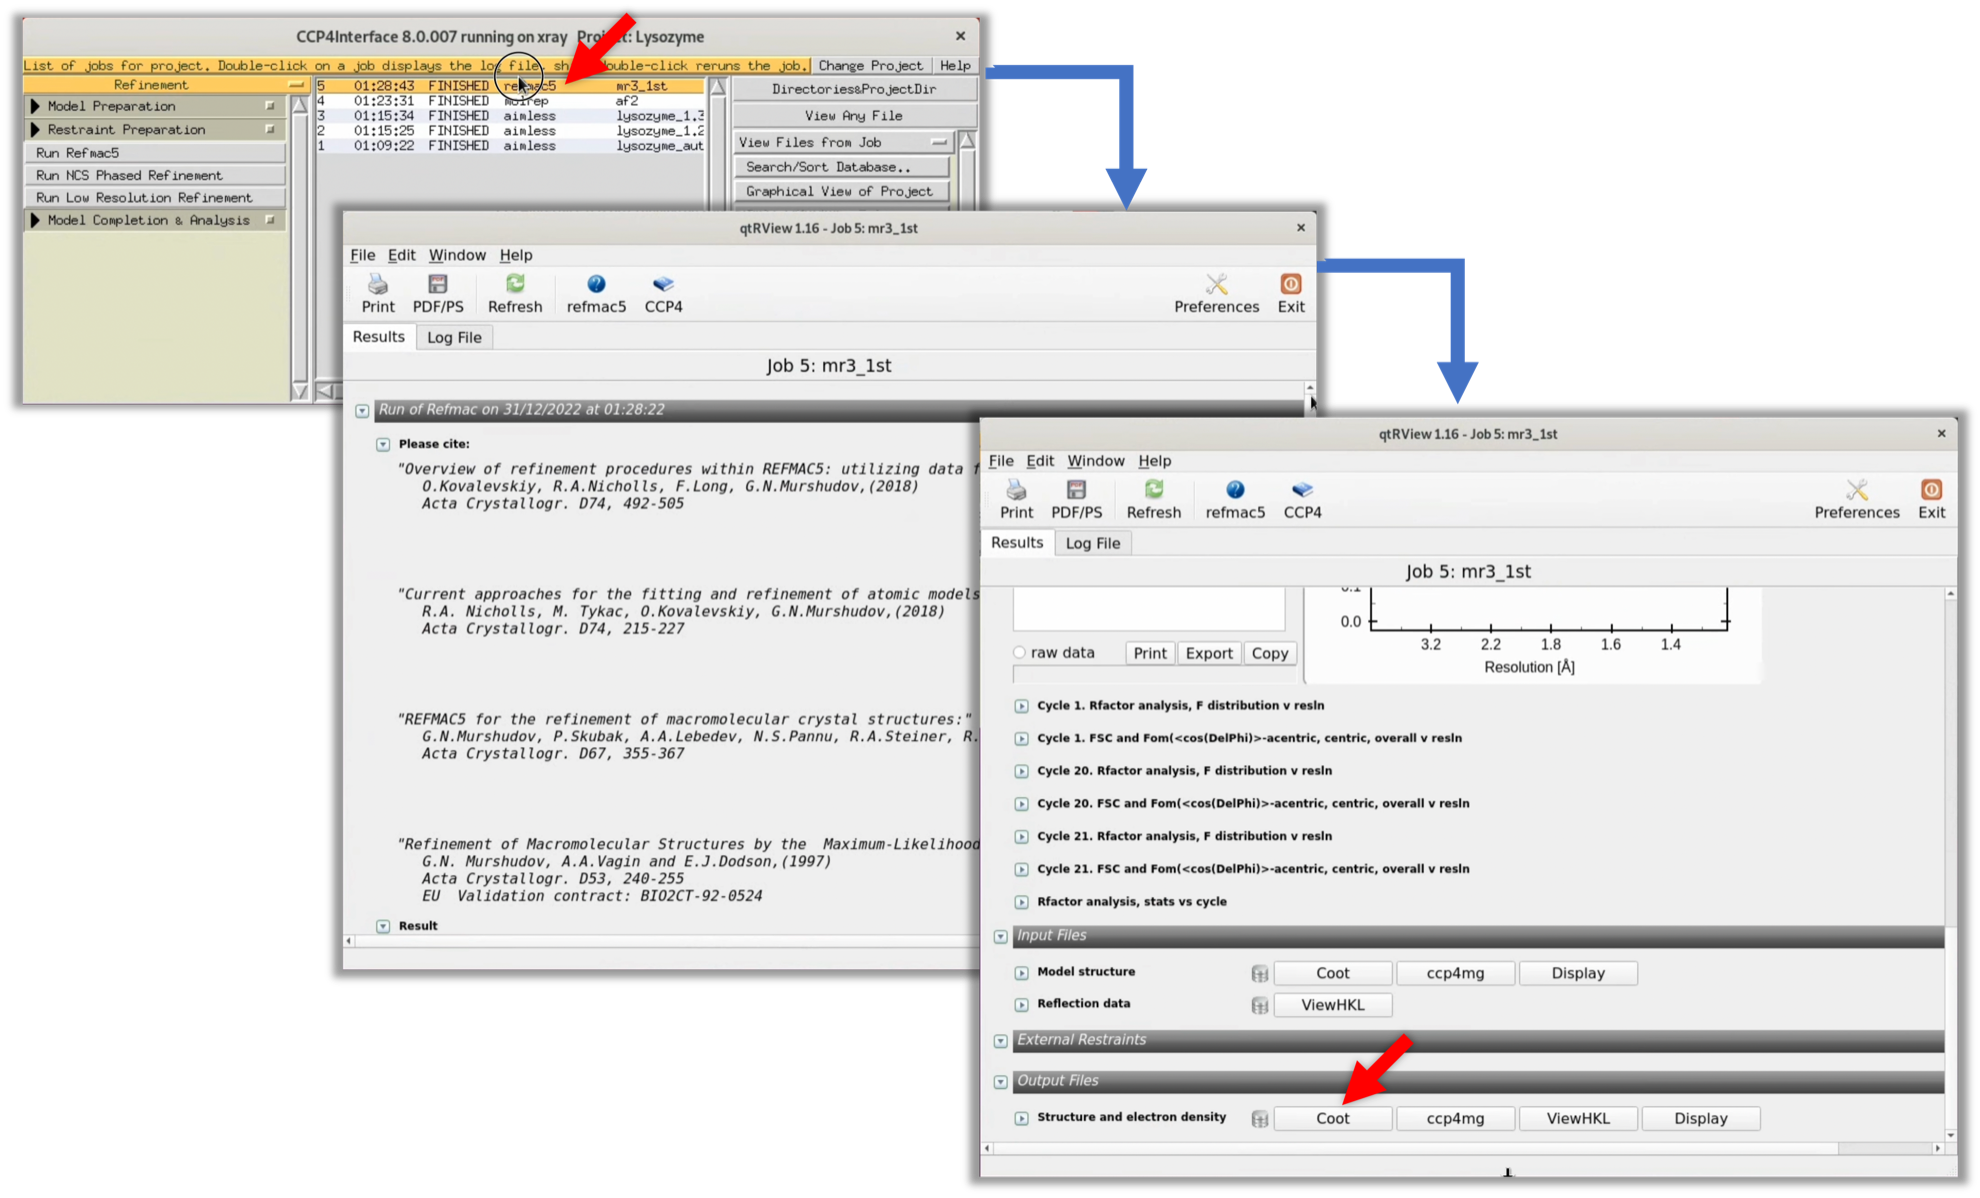
After starting Coot, refer to the following video to check the electron density map ρ(xyz).
What you should pay attention to is the difference in electron density map ρ(xyz) between the solvent space between the sides of the lysozyme and the lysozyme itself when displaying the protein model as a whole (video: 2:00 ~). In the video, even when changing the visualization threshold of the electron density map ρ(xyz), it is difficult to distinguish between the two, giving the impression that the electron density map ρ(xyz) exists randomly. In this case, it is judged that a good initial phase has not been obtained.
Though it is empirical, generally, if the density ratio of the electron density map between the protein model body and the surrounding solvent space is clear, it can be judged that a good initial phase has been obtained.
The author has uploaded the results of Molrep and Refmac processing in the space group P41212 to GitHub. Feel free to refer to it as needed.
Step 3.2.2 Why the MR Method Did Not Work Well with the Structure Factor F(hkl) (Space Group: P41212)
In this tutorial, as in the case of successful Scaling (refer to Step 2.5.2), it is likely that another space group belonging to the same Bravais lattice is the true space group. The structure factor $F(hkl)$ processed above was processed in the space group P41212, but this is reprocessed in the space group P43212 and the MR method is retried with Molrep.
The Bravais lattice of the lysozyme crystal in this study is Primitive Tetragonal, and the space group P41212 was predicted by AIMLESS to belong to it. However, P41212 and P43212 both have extinction rules on the same helical axis, and it is extremely difficult to distinguish between them with only AIMLESS. In such cases, it is not uncommon for the space group to be undetermined until the initial phase (or even the final model structure) is determined, and a deep understanding of crystallography is required for determination. On the other hand, in today's era of improved computational power, a strategy of identifying the space group as "the space group that gives the best score in Molrep" can be considered effective.
For a more detailed explanation of the space groups of proteins, the article "Table of Possible Space Groups for Protein Crystals" by the Fukui Laboratory in the Department of Applied Biological Chemistry at the Graduate School of Agricultural and Life Sciences, The University of Tokyo, is very easy to understand, so please refer to it here (JP).
Step 3.2.3 Obtaining the Structure Factor F(hkl) of Space Group P43212
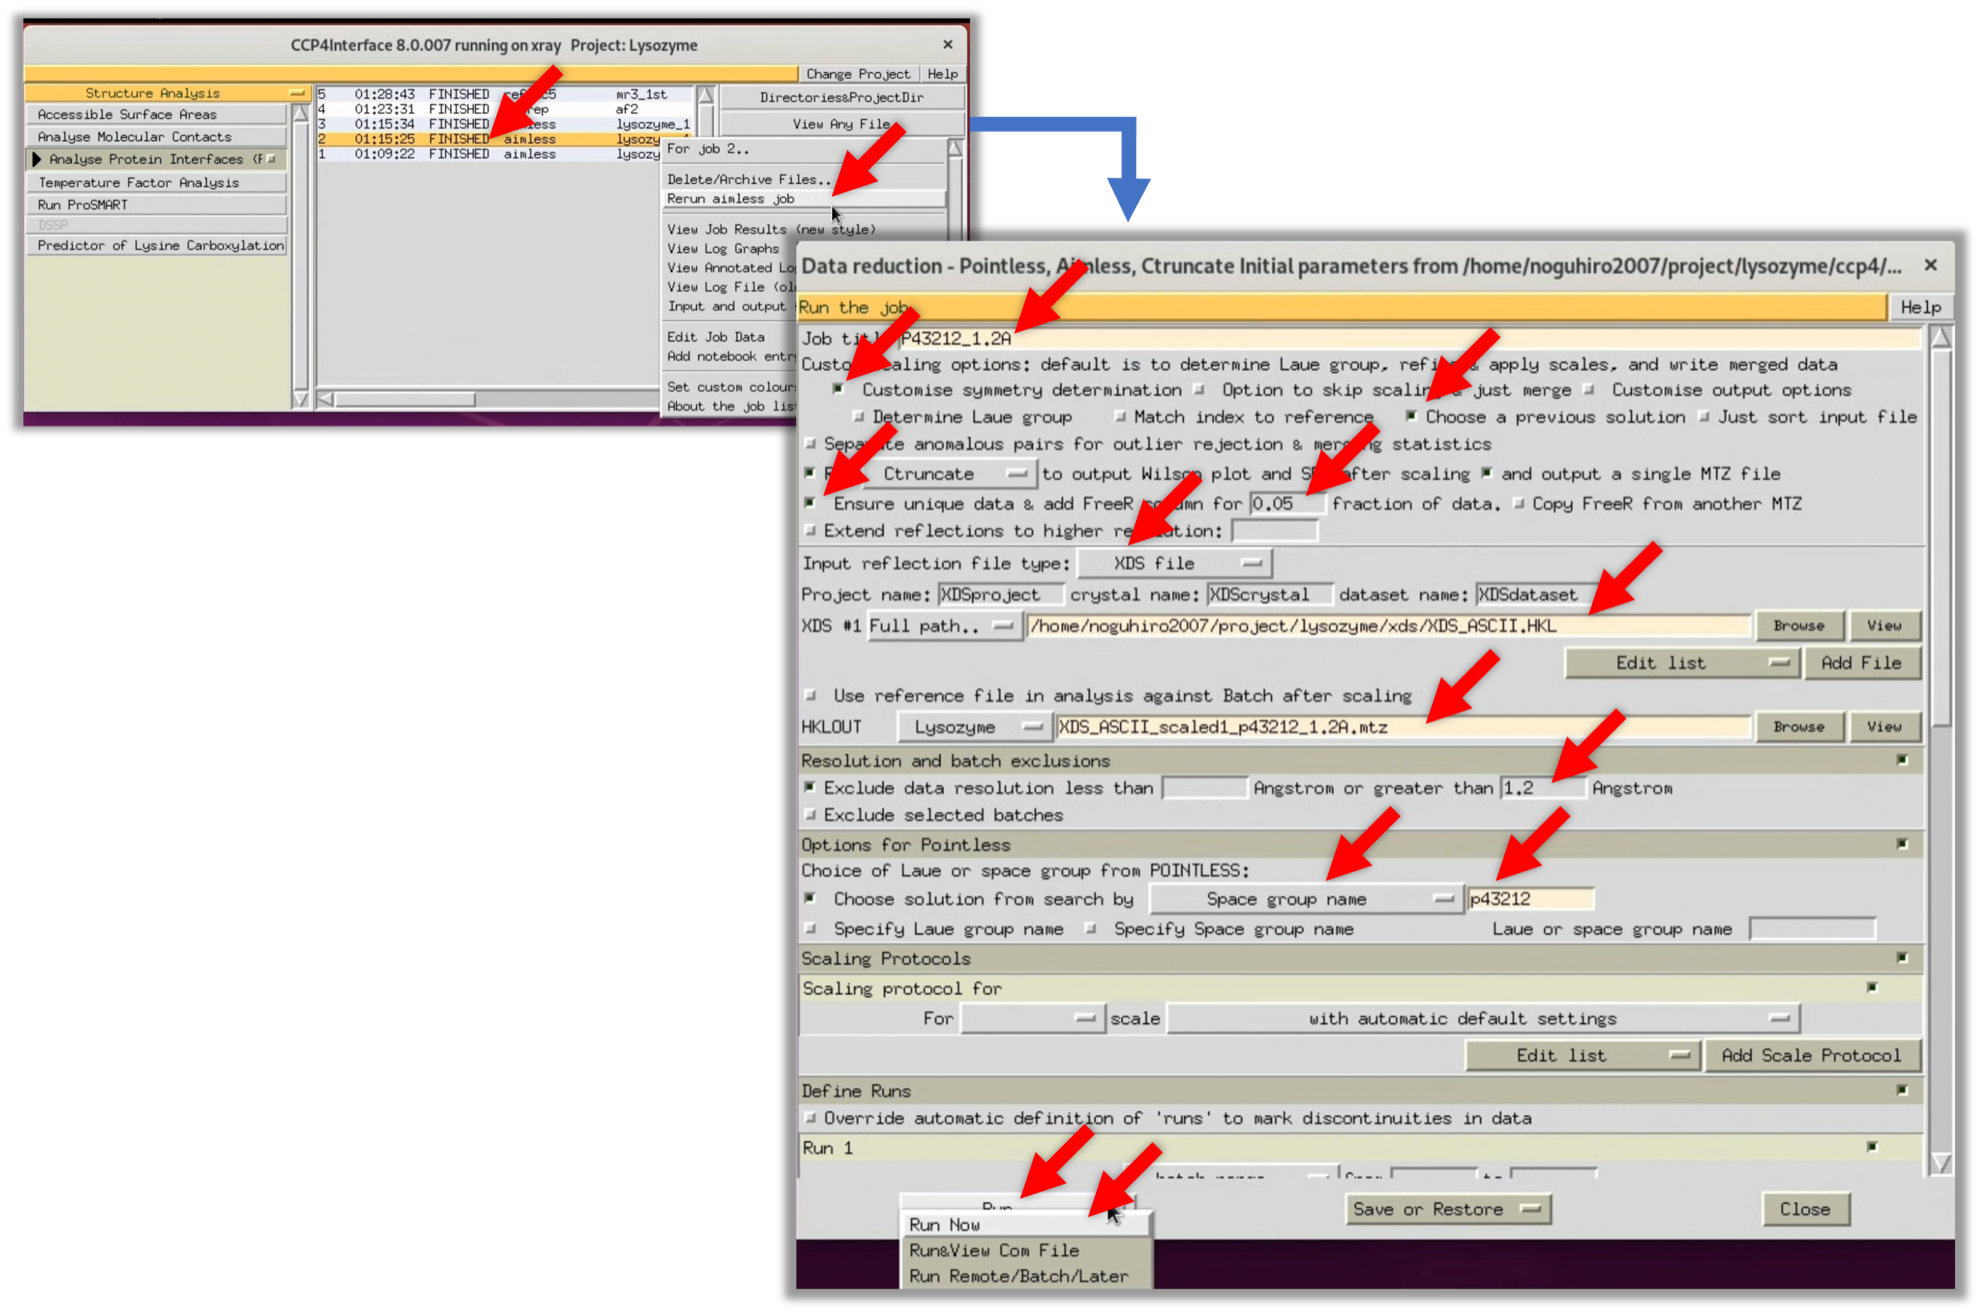
- Redo the Scaling in space group P43212 (refer to Step 2.5.2). To shorten the input time of parameters, select AIMLESS (Scaled in P41212) in CCP4i's Status, select "Return aimless job" from the right-click menu to open the previous parameter input screen. Then, redo the Scaling at a resolution of 1.2Å and with the Space group name P43212, following the red arrow in the image below.
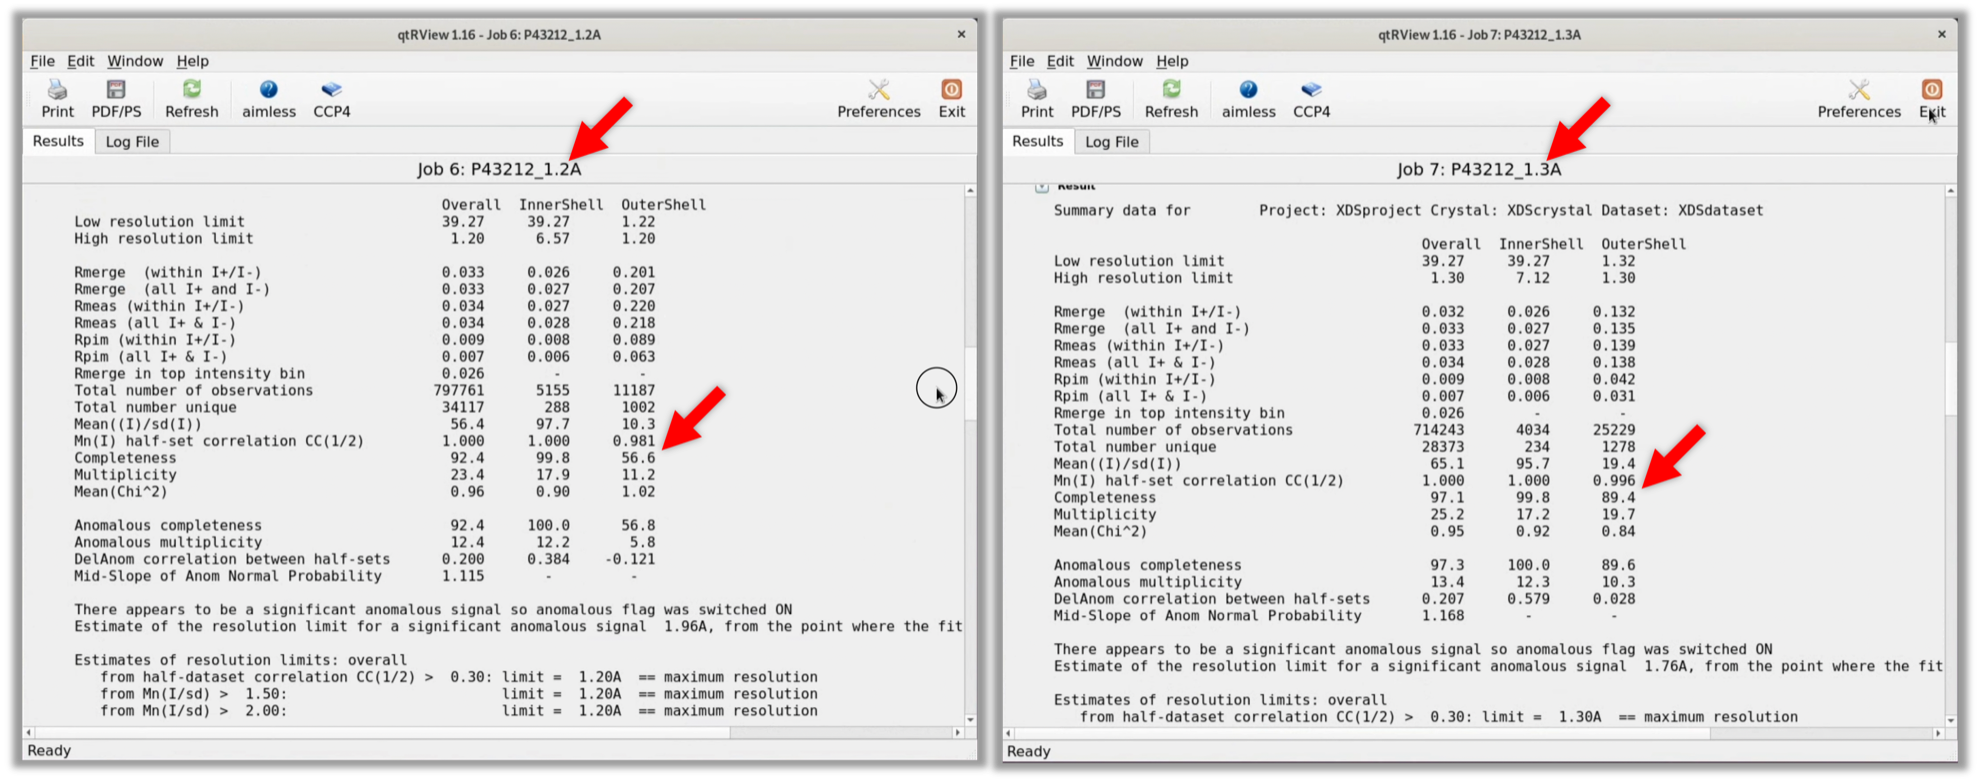
2. As a result, the Completeness of the OuterShell was 56.6% at a resolution of 1.2Å in the space group P43212. Therefore, when I redid AIMLESS at a resolution of 1.3Å in space group P43212, the Completeness of the OuterShell was 89.4%, so the resolution was specified as 1.3Å, as was the case when processing in space group P41212.
Step 3.2.4 MR Method Using Structure Factor F(hkl) (Space Group: P43212)
The MR method is carried out using the structure factor $F(hkl)$ in space group P43212, similar to Step 3.2.1 MR Method Using Structure Factor F(hkl) in Space Group P41212.
- Open Molrep's parameter input window, as in Step 3.2.1, and run it using the structure factor $F(hkl)$ from the previous Scaling in space group P43212/resolution 1.3Å.
2. Once Molrep's processing is finished, check its log. The results show that the TF/sq and Score in the second line of "Summary (V2)" are significantly higher than those in the third line, suggesting that Molrep could have found an appropriate initial phase.
3. For verification, create an electron density map $\rho (xyz)$ using Refmac and take a look at it in Coot, similar to Step 3.2.1. Set the parameters in Refmac according to the image below and run the process.
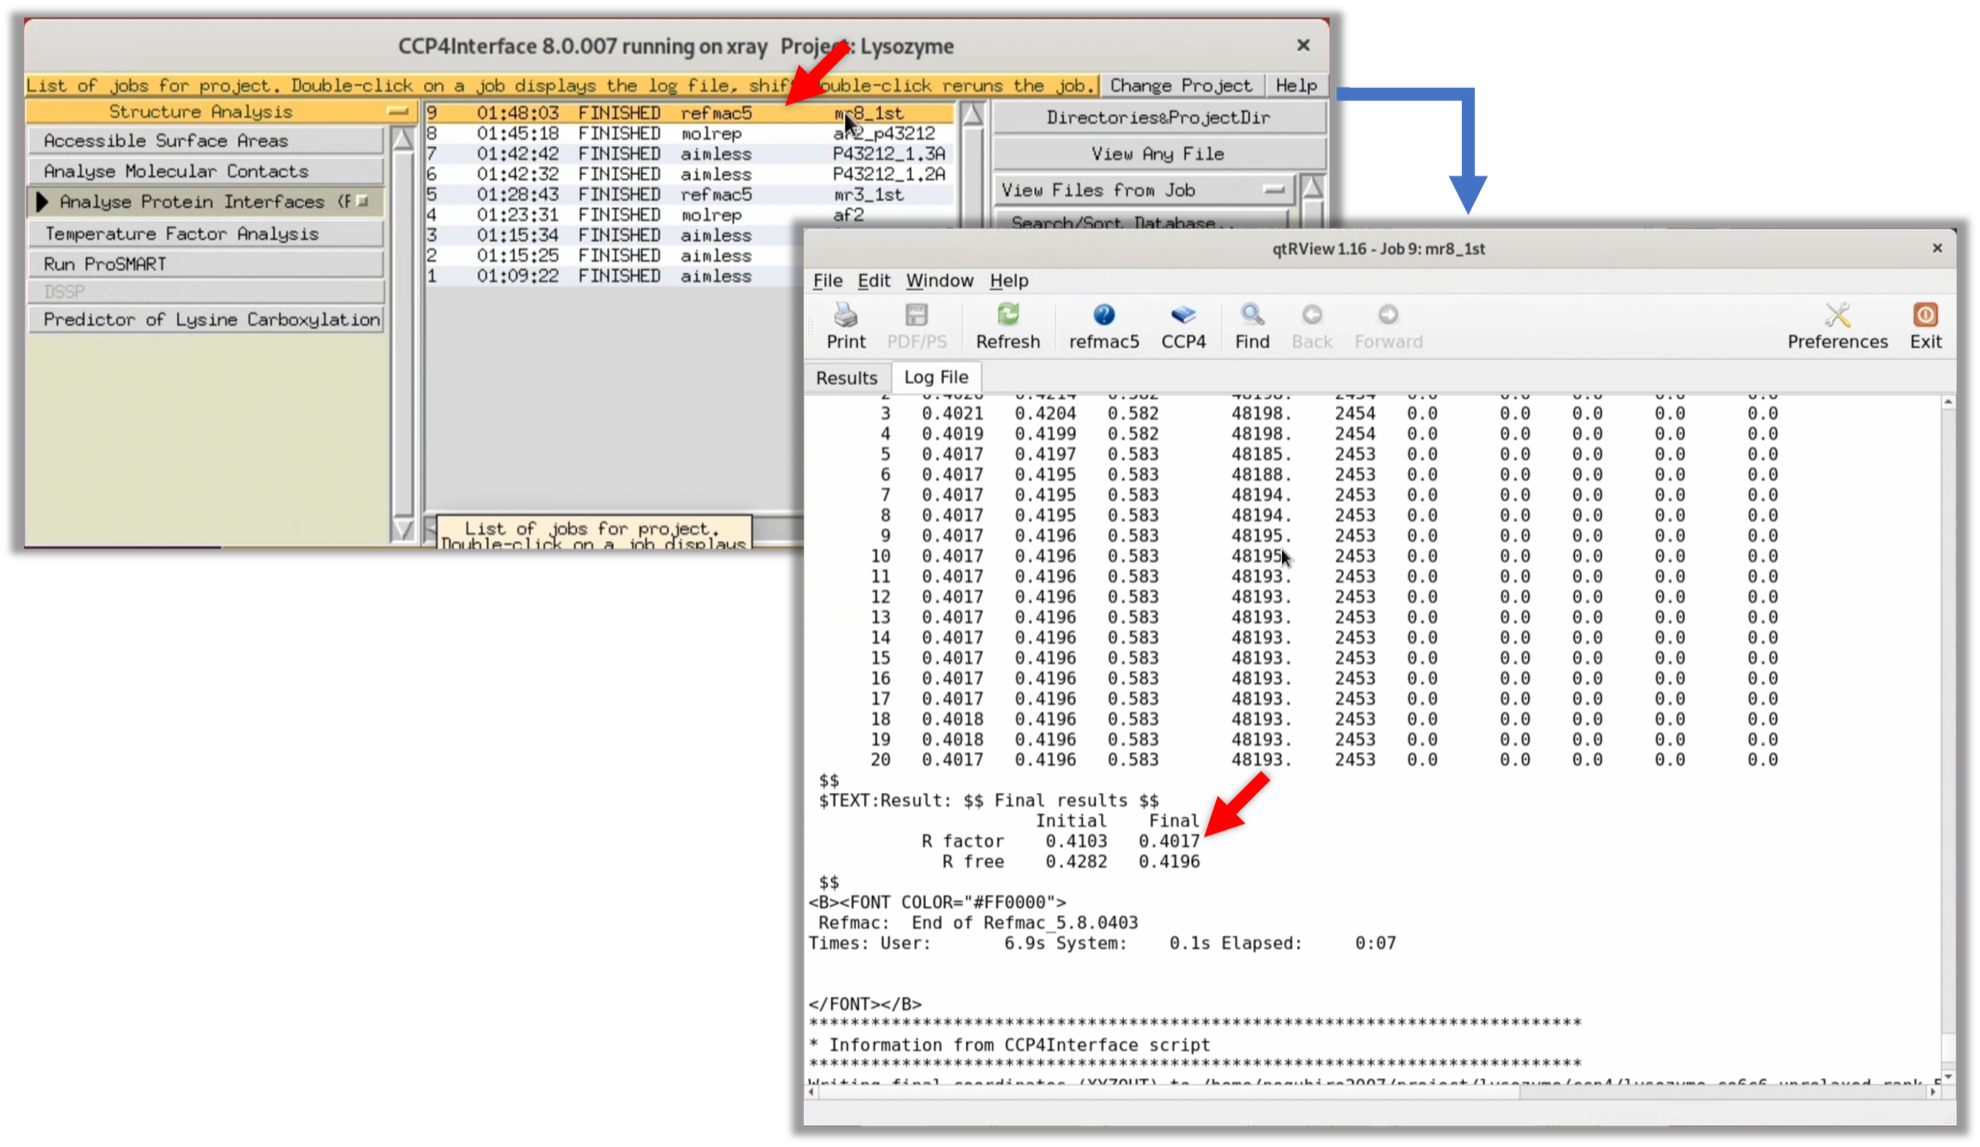
In this run, the R-factor and R-free values (the lower, the better the match between the model structure and the structure factor $F(hkl)$) after refinement were about 40-41%. While these are lower than the 50% that indicates complete randomness, they are still somewhat uncertain for determining whether the initial phase is correct.
Like in Step 3.2.1, launch Coot from Refmac's Log Viewer and check the electron density map $\rho (xyz)$.
When displaying the whole protein model, look at the difference in electron density between the solvent space between adjacent Lysozymes and the Lysozyme itself (video: 1:02 ~). Even when changing the visualization threshold of the electron density map $\rho (xyz)$ in the video, it can be seen that the electron density maps of the two are distinguished more clearly than when in space group P41212. Therefore, it can be concluded that a high-quality initial phase has been obtained.
Even if you can't make a distinction by visually examining the electron density map ρ(xyz), you can proceed to the structure refinement step and judge based on the values of the R-factor/R-free.
The author has uploaded the results of the Molrep and Refmac processes for the space group P43212 on GitHub. Please feel free to refer to these results.
Reference
Conclusion
In this third tutorial of Protein X-ray Crystallography, we derived initial phases using AlphaFold2 and the Molecular Replacement method (MR method) from the structure factor F(hkl). In the final Step.4, we will conduct structure refinement and construct the model structure of Lysozyme.
Table of Contents
- Step.0 The flow of structure determination
- Step.1 Installing analytical software
- Step.2 Checking diffraction images and calculating structure factors
- Step.3 Finding initial phases(This article)
- Step.4 Structure refinement and validation
-
For the sake of clarity, the explanation is oriented differently from most textbooks and introductory articles. ↩