df.plot.scatterで作成した散布図の軸の始点を0にしたい
Q&A
Closed
解決したいこと
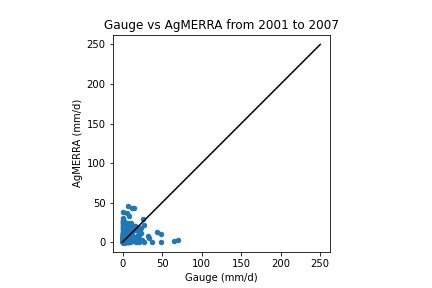
pythonで作成したPandas.DataFrameをdf.plot.scatterで散布図に変換したところ、下記の図のようになりました。
このグラフのx軸・y軸の始点をちょうど目盛りが0のところに設定したいです。
該当するソースコード
import pandas as pd
import matplotlib as mpl
import matplotlib.pyplot as plt

plt.figure()
df_all.plot.scatter(x='Gauge', y=SPP)
plt.xlim(0,250)
plt.ylim(0,250)
plt.plot([0,250],[0,250], color='black')
plt.axis('square')
plt.xlabel('Gauge (mm/d)')
plt.ylabel('AgMERRA (mm/d)')
plt.title(f'Gauge vs AgMERRA from 2001 to 2007')
plt.savefig('ScatterPlot.jpg')
plt.close('all')
自分で試したこと
plt.xlim(0,250)とし(y軸も同様)、軸の始点を0にしているのですが、思った通りの見た目になりませんでした。
0 likes

