スケジュール
- 1日目 要件定義編
- 2日目 環境構築編
- 3日目 ドーナッツグラフ編
- 4日目 棒グラフ編
- 5日目 GraphQL編
- 6日目 GraphQL編2←今ここ
- 7日目 GraphQL編3
- 8日目 GraphQL編4
- 9日目 デプロイ編
前提条件
- node.js v8.3以上
- yarn or npmが入っている(Document見るとyarnの方が推奨とのこと)
- Gridsomeのプロジェクトを作成している
前回と同じくGraphQLのクエリを作成
今回は集計関数的なことをやりたかったのですが、うまく出来ず断念。
schemaで定義すればできるのかな?
https://qiita.com/NagaokaKenichi/items/d341dc092012e05d6606
ということで回りくどいですが、複数のクエリを定義してフロントエンド側の処理で集計することにしました。
src/pages/asset-allocation/index.vue
query{
  tickersLTS: allAssets(order: ASC,filter: {_18:{eq:"Long term stock"}}) {
    edges {
      node {
        _1
        _4
        _8
      }
    }
  }
  tickersSTS: allAssets(order: ASC,filter: {_18:{eq:"Short term stock"}}) {
    edges {
      node {
        _1
        _4
        _8
      }
    }
  }
  tickersBND: allAssets(order: ASC,filter: {_18:{eq:"Bond"}}) {
    edges {
      node {
        _1
        _4
        _8
      }
    }
  }
  tickersCOM: allAssets(order: ASC,filter: {_18:{eq:"Commodities"}}) {
    edges {
      node {
        _1
        _4
        _8
      }
    }
  }
  tickersCAS: allAssets(order: ASC,filter: {_18:{eq:"Cash"}}) {
    edges {
      node {
        _1
        _4
        _8
      }
    }
  }
}
もしくは定義したクエリで演算や集計処理ができれば便利なのですが、可能なのだろうか?もっとGraphQL勉強しなきゃなー。
前回と別ページで実装したドーナッツグラフ
src/pages/asset-allocation/index.vue
<template>
  <Layout>
    <h1>Asset allocation</h1>
    <Doughnut
        :labels="labels"
        :chartData="formatChartData([
            $page.tickersLTS.edges,
            $page.tickersSTS.edges,
            $page.tickersBND.edges,
            $page.tickersCOM.edges,
            $page.tickersCAS.edges
            ])">
    </Doughnut>
  </Layout>
</template>
<page-query>
query{
  tickersLTS: allAssets(order: ASC,filter: {_18:{eq:"Long term stock"}}) {
    edges {
      node {
        _1
        _4
        _8
      }
    }
  }
  tickersSTS: allAssets(order: ASC,filter: {_18:{eq:"Short term stock"}}) {
    edges {
      node {
        _1
        _4
        _8
      }
    }
  }
  tickersBND: allAssets(order: ASC,filter: {_18:{eq:"Bond"}}) {
    edges {
      node {
        _1
        _4
        _8
      }
    }
  }
  tickersCOM: allAssets(order: ASC,filter: {_18:{eq:"Commodities"}}) {
    edges {
      node {
        _1
        _4
        _8
      }
    }
  }
  tickersCAS: allAssets(order: ASC,filter: {_18:{eq:"Cash"}}) {
    edges {
      node {
        _1
        _4
        _8
      }
    }
  }
}
</page-query>
<script>
import Doughnut from "../../components/chart/Doughnut"
export default {
  components: {
    Doughnut
  },
  data() {
    return {
      labels: ['Long term stock', 'Short term stock', 'Bond', 'Commodities', 'Cash']
    }
  },
  methods: {
    formatChartData: function (types) {
      let chartData = [];
      types.forEach(function(type, key){
        const typeSum = type.map(item => item['node']['_4'] * item['node']['_8']).reduce((a,x) => a+=x,0);
        chartData.push(Math.floor(typeSum * 100) / 100);
      });
      return chartData;
    }
  },
  metaInfo: {
    title: 'Hello, world!'
  }
}
</script>

<style>
.home-links a {
  margin-right: 1rem;
}
</style>
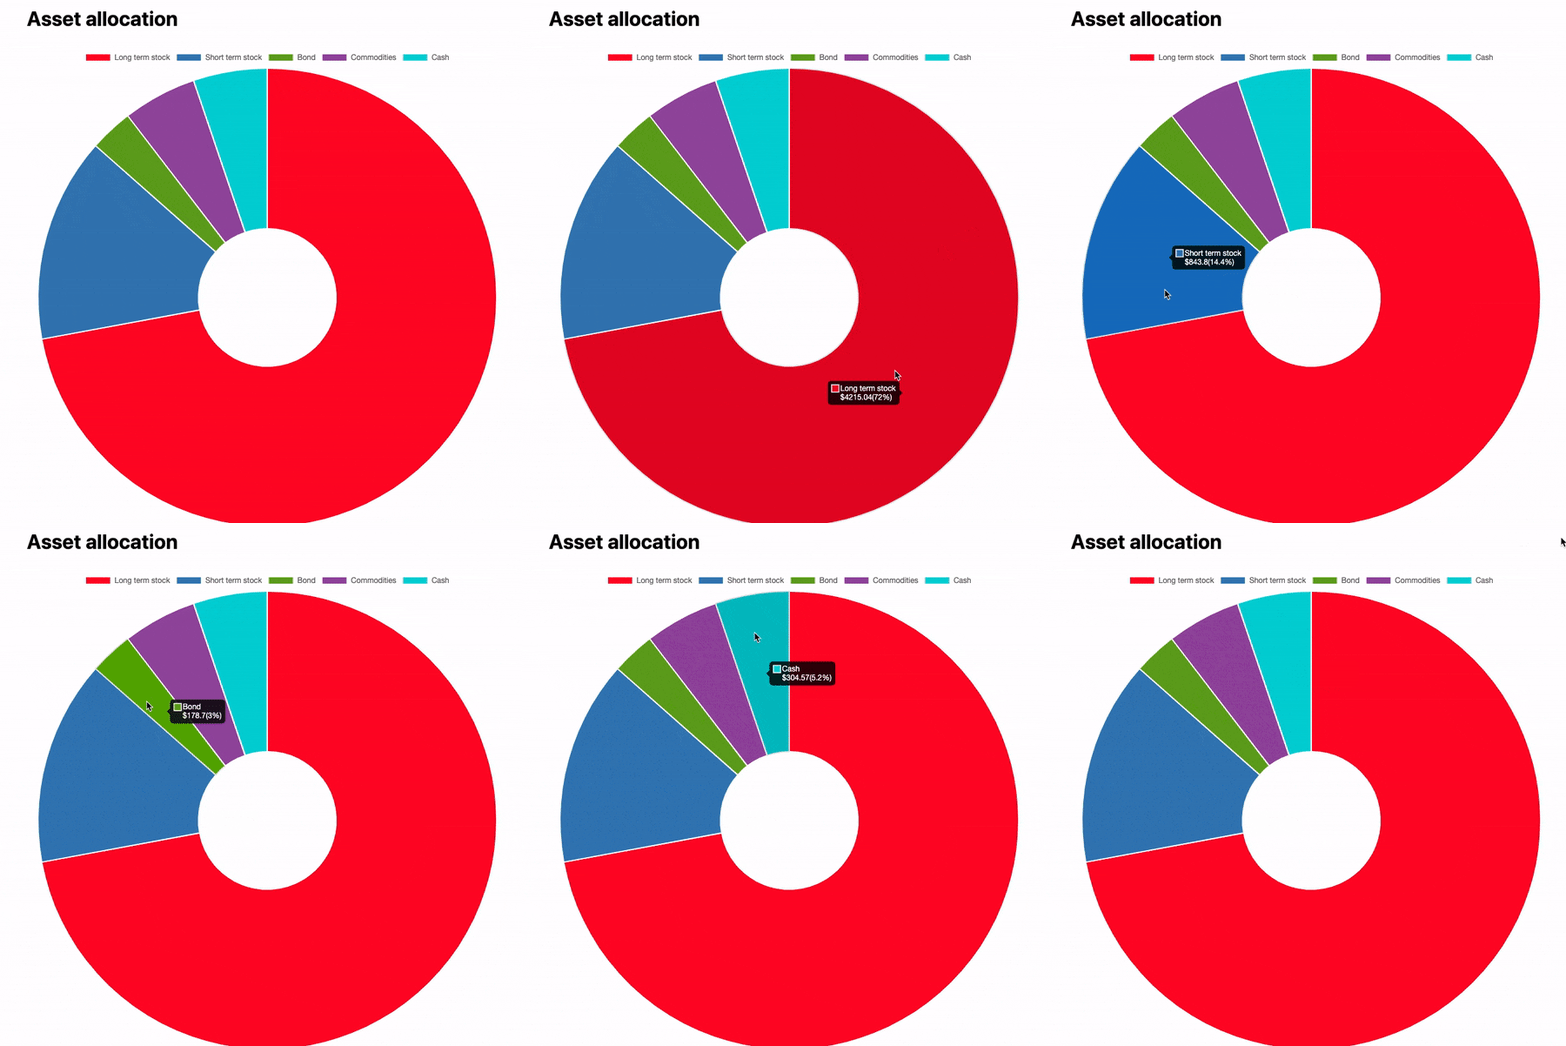
実際のグラフ

前回と同じCSVのデータですがうまくカテゴリごとに集計出来てます。
あとがき
今日の所感はGraphQLが
むずい。そもそもAPI向けのクエリ言語ってものが初挑戦なのでもっとdocument見てからじゃないと、ノリで作り始めるのは大変だなーと思いました。
今日は疲れたのでもののけ姫を見に行ってこよー。