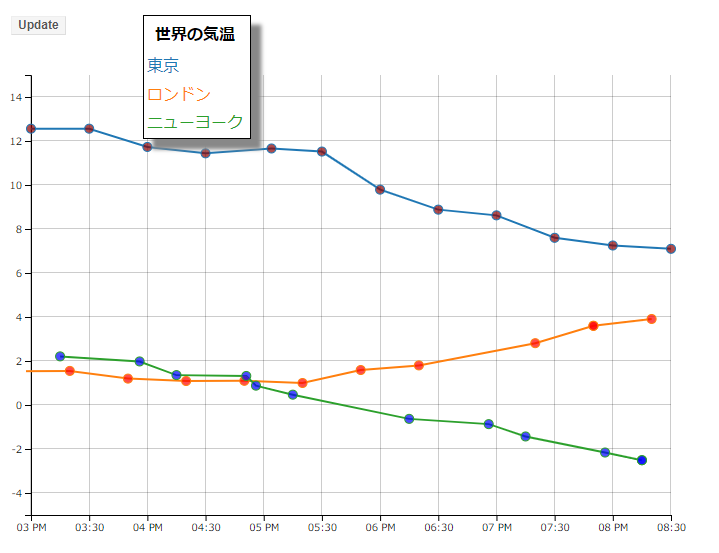
D3.jsで、以下のようなグラフを描くプログラムを作ってみました。定期的に、東京、ロンドン、ニューヨークの3大都市の気温を取得しグラフを更新していきます。「OpenWeatherMap」のAPIを利用して気温データを取得します。
技術的なポイント:
- D3.jsでリアルタイムに更新するグラフを描く
- サーバ側にWebサーバとしてお手軽なFlask(Python)を採用する
- OpenWeatherMapのAPIをrequestsで叩く
- 取得した気温データはPostgreSQL(SQLAlchemy)に保存する
1.サーバ (Flask + PostgreSQL) の設定
サーバ側は、AWS(Chalice)を使えば良いのですが、しょぼい話ですが、私のAWSアカウントが無料枠を超えてしまっているようなので、今回は手元のCentos7サーバで、Flaskを立てます。
Flaskについての基本的なところは以下のサイトを参照してください。
「Flask - 公式サイト」
「View Decorators - @wrapsについての説明」
「Pythonのデコレータについて」
「PythonのFlaskで学ぶWebアプリケーション制作講座 第6章 〜セッション〜」
1-1.ライブラリのインストール
まず必要なライブラリをインストールしておきます。
pip install flask SQLAlchemy flask-sqlalchemy
pip install psycopg2
pip install psycopg2-binary    # 不要かも。
1-2.SQLAlchemyの設定
pythonのORMモジュールであるSQLAlchemyを使います。基本的な説明は以下のサイトを参照してください。
「Flask-SQLAlchemy - 公式サイト」
「Flask-SQLAlchemyの使い方」
「Flask by Example – Setting up Postgres, SQLAlchemy, and Alembic」
以下のように設定ファイルを作成します。flask_weatherというDBを利用する予定です。
SQLALCHEMY_DATABASE_URI = 'postgresql://postgres:postgres@localhost:5432/flask_weather'
SQLALCHEMY_TRACK_MODIFICATIONS = True
1-3.PostgreSQLの設定
PostgreSQL自体はインストール済みであることを前提とします。まだ、インストールしていない場合は、以下のサイトをご参照してください。
「PostgreSQL 10 を CentOS 7 に yum インストールする手順」
「CentOS7にErlangとElixir、Phoenixをインストールしてみる」
「centOS7 でpostgreSQLがアンインストールできない」
まずflask_weatherというDBを作成します。
sudo -u postgres psql -U postgres
postgres=# create database flask_weather;
Pythonインタープリタから、server.py(後で説明)を使ってテーブルを作成します。(Pythonってこういう使い方するんだ~。)
python
>>> from server import db
>>> db.create_all()
PostgreSQLの設定はこれで終わりです。最後に、忘れやすいので、PostgreSQLの設定を確認するために便利なコマンドを挙げておきます。PostgreSQLコマンドチートシート
sudo -u postgres psql
postgres=# \l                  # DB一覧
postgres=# \c flask_weather    # DB接続
flask_weather=# \z             # テーブル一覧
flask_weather=# \d entries     # テーブル定義
flask_weather=# select * from temp;  # テーブル表示
1-4.サーバプログラム server.pyの説明
server.pyは基本的には「OpenWeatherMap」のAPIを使って気温データを取得してDBに保存します。
Flaskアプリとして以下の3つのパスを定義します。
- "/" - トップページ。D3.jsアプリが動作する。
- "/weather_list/<length>" - D3.jsアプリがデータを取得するパス。length個のデータを要求
- "/weather" - cronから15分おきにアクセス。気温データを取得しDBに保存。前に取得した時間データが同じなら保存しない。
以下が全ソースです。
# server.py
from flask import Flask, render_template, jsonify
from flask_sqlalchemy import SQLAlchemy, get_debug_queries
import requests
import json, pprint

# APIキーの指定
apikey = "xxxxxxxxxxxxxxxxxxxxxxxxxxxxxxxx"

# 都市の一覧
cities = ["Tokyo,JP", "London,UK", "New York,US"]
# cnames = map(lambda str: str[:-3], cities) # render()の中に入れないとダメ
cnames = ["Tokyo", "London", "New York"]
# APIのテンプレート
api = "https://api.openweathermap.org/data/2.5/weather?q={city}&APPID={key}"

# 温度変換(ケルビン -> 摂氏)
k2c = lambda k: k - 273.15

# 前回の時間 - データ更新判定に利用
lastdt = [0,0,0]

app = Flask(__name__, static_folder="./build/static", template_folder="./build")

# SQLAlchemyのお決りの定義。テーブルとオブジェクトの関連付け
# ------------------------------------------------------
app.config.from_object('config')
db = SQLAlchemy(app)

class Temp(db.Model):
    id = db.Column(db.Integer, primary_key=True)
    city = db.Column(db.String(10))
    utime = db.Column(db.Integer)
    temp = db.Column(db.Float)

    def __init__(self, city, utime, temp):
        self.city = city
        self.utime = utime
        self.temp = temp

    def __repr__(self):
        return '<Temp %r>' % self.temp

# app.config.update(dict( #debug
#   SQLALCHEMY_RECORD_QUERIES = True,
# ))
# ------------------------------------------------------


# トップページ
@app.route("/")
def index():
    return render_template("index.html")

# ブラウザからデータを要求(Rest API)
@app.route("/weather_list/<length>")
def get_weather_list(length=1):
    global cnames
    print(cnames)
    resall = []
    for cname in cnames:
        print(cname)
        res = Temp.query.filter_by(city=cname).order_by(Temp.utime.desc()).limit(length).all()
        # info = get_debug_queries()[0] #debug
        # pprint.pprint(info) #debug

        res2 = []
        for r in res:
            res2.append( { "city":r.city, "dt":r.utime, "temp":r.temp} )
        pprint.pprint(res2)
        resall.append(res2)

    return jsonify(resall)

# cronからアクセス。気温データを取得してDBに保存(Rest API)
@app.route("/weather")
def get_weather():
    i = -1
    res = []

    for name in cities:
        i = i+1
        # APIのURL
        url = api.format(city=name, key=apikey)
        # APIにリクエストを送信
        r = requests.get(url)
        # JSON形式をデコード
        jdata = json.loads(r.text)
        if( lastdt[i] == int(jdata["dt"]) ):
            break
        else:
            res.append(jdata)

    if( len(res) == 3 ) :
        i = -1
        for kdata in res :
            i = i + 1
            lastdt[i] = int(kdata["dt"])
            temp = Temp( kdata["name"], lastdt[i], k2c(kdata["main"]["temp"]))
            db.session.add(temp)
            db.session.commit()

    return jsonify(res)

if __name__ == "__main__":
    app.debug = True
    app.run(host='0.0.0.0', port=8080)
2.クライアント(D3.js)の設定
2-1.ソースコードツリー
今回のサーバとクライアントのソースコードツリーです。
config.py
server.py
build  -  index.html
       |- static -  modal.html
                 |- js  - d3.js
                 |- css - styles.css
2-2.modal画面のHTML
都市名一覧を表示するmodal画面用のhtmlです。2列のテーブルですが、今のところ1列しか使っていません
<table>
    <tr>
        <th>世界の気温</th>
    </tr>
    <tr class="city"><td class="city">東京</td><td class="data"></td></tr>
    <tr class="city"><td class="city">ロンドン</td><td class="data"></td></tr>
    <tr class="city"><td class="city">ニューヨーク</td><td class="data"></td></tr>
</table>
2-3.index.html(D3.js)
以下がメインのD3.jsのプログラムです。ちょっと長いです。
<!DOCTYPE html>
<html>
<head>
    <meta charset="utf-8">
    <title>Line Chart</title>
    <link rel="stylesheet" type="text/css" href="/static/css/styles.css"/>
    <script type="text/javascript" src="/static/js/d3.js"></script>
    <style>
      #modal {
        position:fixed;
        left:150px;
        top:20px;
        z-index:1;
        background: white;
        border: 1px black solid;
        box-shadow: 10px 10px 5px #888888;
      }
    </style>
</head>
<body>
<script type="text/javascript">
// ********************************************************************
// **** D3.jsが扱うDOMツリー
// **
// ** svg
// **   g.axes
// **     g.x .axes       -- translate(xStart,yStart)
// **     g.y .axes       -- translate(xStart,yEnd)
// **   defs
// **   g.body            -- translate(xStart,yEnd)
// **     path.line
// **     path.line
// **     circle.dot(11個)
// **     circle.dot(11個)
// **
// ****   g.bodyのハミダシタlineやdotはclipPath(defs)で切り取られる
// ********************************************************************
    function lineChart() {
        var _chart = {};
        var _width = 700, _height = 500,
                _margins = {top: 30, left: 30, right: 30, bottom: 30},
                 _x, _y,
                _data = [],
                _colors = d3.scaleOrdinal(d3.schemeCategory10),
                _svg,
                _modal,
                _bodyG,
                _line;

        _chart.render = function () {
            if(_data[0].length < numberOfDataPoint) return;

            var startEnd = d3.extent(_data[0], d => d.x);
            // ** X軸のscale、時間軸
            _x = d3.scaleTime().domain(startEnd).range([0, quadrantWidth()])
            // ** y軸のscale,rangeがinvertedであることに注意
            _y = d3.scaleLinear().domain([min_y, max_y]).range([quadrantHeight(), 0])

            if (!_svg) {
                _svg = d3.select("body").append("svg")
                        .attr("height", _height)
                        .attr("width", _width);

                renderModal(); // ** 最初の1回だけ描画
                defineBodyClip(_svg);
            }
            renderAxes(_svg); // ** render()が呼ばれるごとに描画
            renderBody(_svg);
        };

        function renderModal() {
            d3.text("/static/modal.html", data => {
                if(!_modal) {
                    _modal = d3.select("body").append("div").attr("id", "modal");
                }
                _modal.html(data);

                d3.selectAll("tr.city")
                    .each(function (d,i) {
                        d3.select(this)
                            .style("color", function (d) {
                                return _colors(i);
                            })
                    })
            });
        };

        function renderAxes(svg) {
            svg.select("g.axes").remove()  // ** 前回のDOMをクリアー
            var axesG = svg.append("g")
                    .attr("class", "axes");

            renderXAxis(axesG);
            renderYAxis(axesG);
        }

        // ** X座標
        function renderXAxis(axesG){
            var xAxis = d3.axisBottom()
                    .scale(_x);

            axesG.append("g")
                    .attr("class", "x axis")
                    .attr("transform", function () {
                        return "translate(" + xStart() + "," + yStart() + ")";  // ** @左下
                    })
                    .call(xAxis);

            // ** y座標軸に平行なgrid line
            d3.selectAll("g.x g.tick")
                .append("line")
                    .classed("grid-line", true)
                    .attr("x1", 0)
                    .attr("y1", 0)
                    .attr("x2", 0)
                    .attr("y2", - quadrantHeight());
        }

        // ** Y座標
        function renderYAxis(axesG){
            var yAxis = d3.axisLeft()
                    .scale(_y);

            axesG.append("g")
                    .attr("class", "y axis")
                    .attr("transform", function () {
                        return "translate(" + xStart() + "," + yEnd() + ")";  // ** @左上  Invertedだから。
                    })
                    .call(yAxis);

             // ** x座標軸に平行なgrid line
             d3.selectAll("g.y g.tick")
                .append("line")
                    .classed("grid-line", true)
                    .attr("x1", 0)
                    .attr("y1", 0)
                    .attr("x2", quadrantWidth())
                    .attr("y2", 0);
        }

        // ** Bodyを切り取るRect(body-clip)を定義
        function defineBodyClip(svg) {
            var padding = 5;

            svg.append("defs")
                    .append("clipPath")
                    .attr("id", "body-clip")
                    .append("rect")
                    .attr("x", 0 - padding)
                    .attr("y", 0)
                    .attr("width", quadrantWidth() + 2 * padding)
                    .attr("height", quadrantHeight());
        }

        // ** Body描画
        function renderBody(svg) {
            if (!_bodyG)
                _bodyG = svg.append("g")
                        .attr("class", "body")
                        .attr("transform", "translate("
                            + xStart() + ","
                            + yEnd() + ")") // <-2E
                        .attr("clip-path", "url(#body-clip)");
// ** Rect(body-clip)でBodyを切り取る。点や線がはみ出したらキロ取る。
            renderLines();
            renderDots();
        }


// ** data = [d1, d2]
// ** d1 = [a1,b1,c1,..],  d2 = [a2,b2,c2,...]
// ** lineはdataレベルのbindであり、dotはd1,d2レベルのbindである。

         // ** line描画
        function renderLines() {
            _line = d3.line()
                            .x(function (d) { return _x(d.x); })
                            .y(function (d) { return _y(d.y); });

            var pathLines = _bodyG.selectAll("path.line")
                    .data(_data);
            pathLines
                    .enter()  // ** 2個のdata setで未バインドなもの
                        .append("path")
                    .merge(pathLines)  // ** enter + update
                        .style("stroke", function (d, i) {  // ** i はdata set番号
                            return _colors(i);
                        })
                        .attr("class", "line")
// ** transition()行は無くとも最終的なグラフ描画は変わらないが、
// ** transition()行でupdate時のdotの動作(前回->今回)がスムーズになる。
                    .transition()
                        .attr("d", function (d) { return _line(d); });
        }

        // ** Dot描画
        function renderDots() {
            _data.forEach(function (list, i) { // ** iはdata set番号
                var circle = _bodyG.selectAll("circle._" + i)
                        .data(list);

                circle.enter()
                        .append("circle")
                    .merge(circle)
                        .attr("class", "dot _" + i)
                        .style("stroke", function (d) {
                            return _colors(i);
                        })
// ** transition()行は無くとも最終的なグラフ描画は変わらないが、
// ** transition()行でupdate時のdotの動作(前回->今回)がスムーズになる。
                    .transition()
                        .attr("cx", function (d) { return _x(d.x); })
                        .attr("cy", function (d) { return _y(d.y); })
                        .attr("r", 4.5);
            });
        }

        function xStart() {
            return _margins.left;
        }
        function yStart() {
            return _height - _margins.bottom;
        }
        function xEnd() {
            return _width - _margins.right;
        }
        function yEnd() {
            return _margins.top;
        }
        function quadrantWidth() {
            return _width - _margins.left - _margins.right;
        }
        function quadrantHeight() {
            return _height - _margins.top - _margins.bottom;
        }
        _chart.width = function (w) {
            if (!arguments.length) return _width;
            _width = w;
            return _chart;
        };
        _chart.height = function (h) { // <-1C
            if (!arguments.length) return _height;
            _height = h;
            return _chart;
        };
        _chart.margins = function (m) {
            if (!arguments.length) return _margins;
            _margins = m;
            return _chart;
        };
        _chart.colors = function (c) {
            if (!arguments.length) return _colors;
            _colors = c;
            return _chart;
        };
        _chart.x = function (x) {
            if (!arguments.length) return _x;
            _x = x;
            return _chart;
        };
        _chart.y = function (y) {
            if (!arguments.length) return _y;
            _y = y;
            return _chart;
        };

        _chart.setData = function (data) {
            _data = []
            data.forEach(function(series,i) {
                var temp = []
                series.forEach( function(ds) {
                    temp.push({x: new Date(ds["dt"]*1000), y:ds["temp"]});
                } )
                _data.push(temp)
            } )
        }

        return _chart;
    }

    function update() {
        d3.json("http://www.mypress.jp:8080/weather_list/"+numberOfDataPoint, function(error, data) {
            chart.setData(data);
            chart.render();
        });
    }

    var numberOfSeries = 3,
        numberOfDataPoint = 11,
        min_y = -5,
        max_y = 15;

    var chart = lineChart()

    update();

    setInterval(function () {
        update();
    }, 1000*60*15);
</script>

<div class="control-group">
    <button onclick="update()">Update</button>
</div>
</body>
</html>
clippathについては以下のサイトを参考にしました。
「Clipped Paths in d3.js (AKA clipPath)」
http://www.d3noob.org/2015/07/clipped-paths-in-d3js-aka-clippath.html
今回は以上です。
付録:D3.js関連の過去記事
D3.jsで気温グラフを描く - Flask + PostgreSQL
D3.jsで日本地図を描くときの基本(geojson)
D3.jsで埼玉県地図を描くときの基本(topojson)
D3.jsで埼玉県の地図上に市町村ラベルを描く
React+D3.jsアプリ作成の基本
埼玉県の市町村別人口をD3.jsのツリーマップで表現してみる
D3.jsの enter-updata-exit パタンでLive Data表示