はじめに
シリーズの目次
- Part1: ベンチマークツールRallyを使ってみる
- Part2: Amzon EC2にクラスタを構築する
- Part3: ノード数/シャード数による性能比較
- Part4(今回): レプリカ数による性能比較
前回までPart3が終り、今回はPart4の「レプリカ数による性能比較」です。
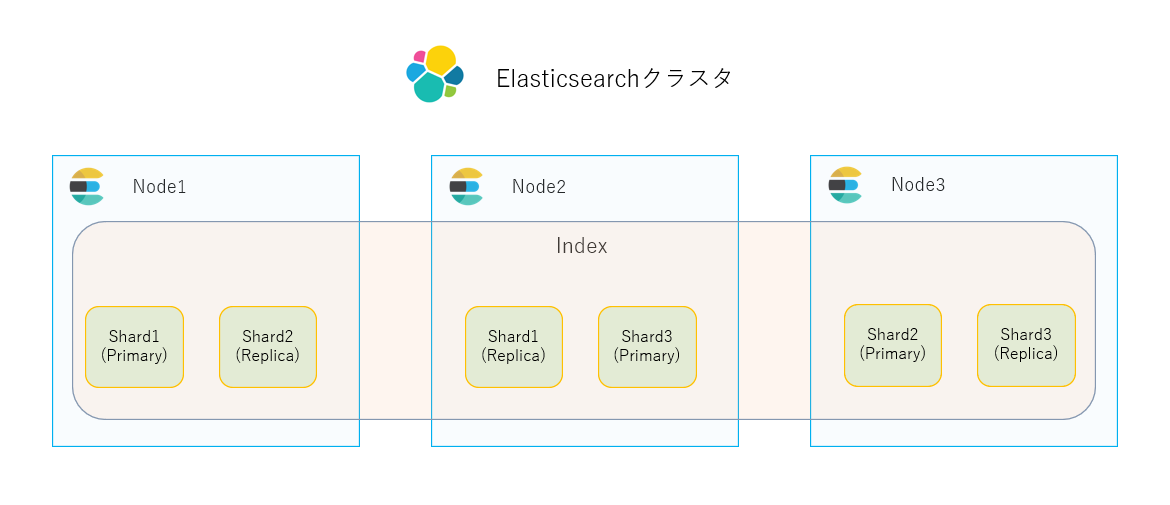
Elasticsearchクラスタ構成のおさらい(3ノードの例)
検証シナリオ
以下二つの構成に対して、Rallyベンチマークを実施し、性能比較します。
- 構成1: 2ノード/2シャード/レプリカなし
- 構成2: 2ノード/2シャード/レプリカあり
検証環境
-
Amazon EC2
- インスタンス数: 2台
- インスタンスタイプ:
t3.medium- CPU: 2コア
- メモリ: 4GB
- ストレージ: 8GiB, gp2
- OSイメージ
- Amazon Linux 2 Kernel 5.10 AMI 2.0.20230119.1 x86_64 HVM gp2
-
Elasticsearchクラスタ
- ノード数: 2
- 性能比較が目的ですので、2ノードクラスタを使用します(コスト削減のため)
- ※注意: 2ノードクラスタは耐障害性に乏しく、本番環境で使用すべきではありません
- ノード数: 2
構成1のベンチマーク手順: 2ノード/2シャード/レプリカなし
Elasticsearchを再起動
ノード1とノード2で下記コマンドを実行します。
sudo systemctl restart elasticsearch
vmstatコマンドで、リソース使用量を計測
15秒間隔で、CPU、Memory、Disk I/Oを計測します。
- ノード1
$ vmstat 15 |
  awk '{print strftime("%Y-%m-%d %H:%M:%S"), $0; fflush()}' |
  tee -a vmstat_node1_n2s2r0.log
- ノード2
$ vmstat 15 |
  awk '{print strftime("%Y-%m-%d %H:%M:%S"), $0; fflush()}' |
  tee -a vmstat_node2_n2s2r0.log
ノード1で、Rallyベンチマーク実行
- トラック: percolatorを使用
- ターゲットホストはノード1、ノード2:
--target-hosts=node1:9200,node2:9200 - シャード数は2:
number_of_shards:2 - レプリカ数は0:
number_of_replicas:0
$ esrally race --track=percolator --pipeline=benchmark-only
  --track-params="number_of_shards:2,number_of_replicas:0" --target-hosts=node1:9200,node2:9200
  --client-options="timeout:60,use_ssl:true,verify_certs:false,basic_auth_user:'elastic',basic_auth_password:'xxxxxx'"
  --kill-running-processes --report-file=result_n2s2r0.md
- ベンチマーク結果(Throughput(秒間処理量)を抜粋)
| Metric | Task | Value | Unit |
|---|---|---|---|
| Min Throughput | index | 10623.1 | docs/s |
| Mean Throughput | index | 22417.1 | docs/s |
| Median Throughput | index | 22907.3 | docs/s |
| Max Throughput | index | 33243.5 | docs/s |
| Min Throughput | percolator_with_content_president_bush | 20.73 | ops/s |
| Mean Throughput | percolator_with_content_president_bush | 23.51 | ops/s |
| Median Throughput | percolator_with_content_president_bush | 23.79 | ops/s |
| Max Throughput | percolator_with_content_president_bush | 25.99 | ops/s |
| Min Throughput | percolator_with_content_saddam_hussein | 48.8 | ops/s |
| Mean Throughput | percolator_with_content_saddam_hussein | 48.96 | ops/s |
| Median Throughput | percolator_with_content_saddam_hussein | 48.96 | ops/s |
| Max Throughput | percolator_with_content_saddam_hussein | 49.11 | ops/s |
| Min Throughput | percolator_with_content_hurricane_katrina | 49.6 | ops/s |
| Mean Throughput | percolator_with_content_hurricane_katrina | 49.66 | ops/s |
| Median Throughput | percolator_with_content_hurricane_katrina | 49.66 | ops/s |
| Max Throughput | percolator_with_content_hurricane_katrina | 49.71 | ops/s |
| Min Throughput | percolator_with_content_google | 17.09 | ops/s |
| Mean Throughput | percolator_with_content_google | 17.51 | ops/s |
| Median Throughput | percolator_with_content_google | 17.57 | ops/s |
| Max Throughput | percolator_with_content_google | 17.76 | ops/s |
| Min Throughput | percolator_no_score_with_content_google | 56.89 | ops/s |
| Mean Throughput | percolator_no_score_with_content_google | 56.89 | ops/s |
| Median Throughput | percolator_no_score_with_content_google | 56.89 | ops/s |
| Max Throughput | percolator_no_score_with_content_google | 56.89 | ops/s |
| Min Throughput | percolator_with_highlighting | 47.76 | ops/s |
| Mean Throughput | percolator_with_highlighting | 48.04 | ops/s |
| Median Throughput | percolator_with_highlighting | 48.04 | ops/s |
| Max Throughput | percolator_with_highlighting | 48.32 | ops/s |
| Min Throughput | percolator_with_content_ignore_me | 0.08 | ops/s |
| Mean Throughput | percolator_with_content_ignore_me | 0.08 | ops/s |
| Median Throughput | percolator_with_content_ignore_me | 0.08 | ops/s |
| Max Throughput | percolator_with_content_ignore_me | 0.09 | ops/s |
| Min Throughput | percolator_no_score_with_content_ignore_me | 15.01 | ops/s |
| Mean Throughput | percolator_no_score_with_content_ignore_me | 15.01 | ops/s |
| Median Throughput | percolator_no_score_with_content_ignore_me | 15.01 | ops/s |
| Max Throughput | percolator_no_score_with_content_ignore_me | 15.02 | ops/s |
クラスタの状態確認
$ curl -k https://elastic:elastic@localhost:9200/_cluster/health?pretty=true
{
  "cluster_name" : "mycluster",
  "status" : "green",
  "timed_out" : false,
  "number_of_nodes" : 2,
  "number_of_data_nodes" : 2,
  "active_primary_shards" : 3,
  "active_shards" : 5,
  "relocating_shards" : 0,
  "initializing_shards" : 0,
  "unassigned_shards" : 0,
  "delayed_unassigned_shards" : 0,
  "number_of_pending_tasks" : 0,
  "number_of_in_flight_fetch" : 0,
  "task_max_waiting_in_queue_millis" : 0,
  "active_shards_percent_as_number" : 100.0
}
クラスタのノード確認
$ curl -k https://elastic:elastic@localhost:9200/_cat/nodes?v
ip           heap.percent ram.percent cpu load_1m load_5m load_15m node.role   master name
172.31.1.200           69          85  50    1.01    0.99     0.67 cdfhilmrstw -      ip-172-31-1-200.ec2.internal
172.31.6.170           11          91   3    0.00    0.02     0.04 cdfhilmrstw *      ip-172-31-6-170.ec2.internal
シャードを確認
percolatorトラックで使用するqueriesインデクスのみ抜粋しています。
ドキュメント数は200万件、二つのシャードに均等に分散配置されています。
$ curl -k https://elastic:elastic@localhost:9200/_cat/shards?v
index            shard prirep state      docs   store ip           node
queries          0     p      STARTED  999798 57.2mb 172.31.1.200 ip-172-31-1-200.ec2.internal
queries          1     p      STARTED 1000202 57.9mb 172.31.6.170 ip-172-31-6-170.ec2.internal
vmstatコマンドを停止
二つのノードで実行中のvmstatコマンドを停止します。
構成2のベンチマーク手順: 2ノード/2シャード/レプリカあり
Elasticsearchを再起動
ノード1とノード2で下記コマンドを実行します。
sudo systemctl restart elasticsearch
vmstatコマンドで、リソース使用量を計測
15秒間隔で、CPU、Memory、Disk I/Oを計測します。
- ノード1
$ vmstat 15 |
  awk '{print strftime("%Y-%m-%d %H:%M:%S"), $0; fflush()}' |
  tee -a vmstat_node1_n2s2r1.log
- ノード2
$ vmstat 15 |
  awk '{print strftime("%Y-%m-%d %H:%M:%S"), $0; fflush()}' |
  tee -a vmstat_node2_n2s2r1.log
ノード1で、Rallyベンチマーク実行
- トラック: percolatorを使用
- ターゲットホストはノード1、ノード2:
--target-hosts=node1:9200,node2:9200 - シャード数は2:
number_of_shards:2 - レプリカ数は1:
number_of_replicas:1
$ esrally race --track=percolator --pipeline=benchmark-only
  --track-params="number_of_shards:2,number_of_replicas:1" --target-hosts=node1:9200,node2:9200
  --client-options="timeout:60,use_ssl:true,verify_certs:false,basic_auth_user:'elastic',basic_auth_password:'xxxxxx'"
  --kill-running-processes --report-file=result_n2s2r1.md
- ベンチマーク結果(Throughput(秒間処理量)を抜粋)
| Metric | Task | Value | Unit |
|---|---|---|---|
| Min Throughput | index | 6466.41 | docs/s |
| Mean Throughput | index | 16555.1 | docs/s |
| Median Throughput | index | 17158 | docs/s |
| Max Throughput | index | 25639.9 | docs/s |
| Min Throughput | percolator_with_content_president_bush | 19.59 | ops/s |
| Mean Throughput | percolator_with_content_president_bush | 21.05 | ops/s |
| Median Throughput | percolator_with_content_president_bush | 21.05 | ops/s |
| Max Throughput | percolator_with_content_president_bush | 22.51 | ops/s |
| Min Throughput | percolator_with_content_saddam_hussein | 49.57 | ops/s |
| Mean Throughput | percolator_with_content_saddam_hussein | 49.62 | ops/s |
| Median Throughput | percolator_with_content_saddam_hussein | 49.62 | ops/s |
| Max Throughput | percolator_with_content_saddam_hussein | 49.67 | ops/s |
| Min Throughput | percolator_with_content_hurricane_katrina | 49.26 | ops/s |
| Mean Throughput | percolator_with_content_hurricane_katrina | 49.36 | ops/s |
| Median Throughput | percolator_with_content_hurricane_katrina | 49.36 | ops/s |
| Max Throughput | percolator_with_content_hurricane_katrina | 49.46 | ops/s |
| Min Throughput | percolator_with_content_google | 16.93 | ops/s |
| Mean Throughput | percolator_with_content_google | 17.39 | ops/s |
| Median Throughput | percolator_with_content_google | 17.47 | ops/s |
| Max Throughput | percolator_with_content_google | 17.77 | ops/s |
| Min Throughput | percolator_no_score_with_content_google | 84.5 | ops/s |
| Mean Throughput | percolator_no_score_with_content_google | 84.5 | ops/s |
| Median Throughput | percolator_no_score_with_content_google | 84.5 | ops/s |
| Max Throughput | percolator_no_score_with_content_google | 84.5 | ops/s |
| Min Throughput | percolator_with_highlighting | 47.45 | ops/s |
| Mean Throughput | percolator_with_highlighting | 47.77 | ops/s |
| Median Throughput | percolator_with_highlighting | 47.77 | ops/s |
| Max Throughput | percolator_with_highlighting | 48.1 | ops/s |
| Min Throughput | percolator_with_content_ignore_me | 0.08 | ops/s |
| Mean Throughput | percolator_with_content_ignore_me | 0.08 | ops/s |
| Median Throughput | percolator_with_content_ignore_me | 0.08 | ops/s |
| Max Throughput | percolator_with_content_ignore_me | 0.09 | ops/s |
| Min Throughput | percolator_no_score_with_content_ignore_me | 15.01 | ops/s |
| Mean Throughput | percolator_no_score_with_content_ignore_me | 15.02 | ops/s |
| Median Throughput | percolator_no_score_with_content_ignore_me | 15.02 | ops/s |
| Max Throughput | percolator_no_score_with_content_ignore_me | 15.03 | ops/s |
クラスタの状態確認
$ curl -k https://elastic:elastic@node1:9200/_cluster/health?pretty=true
{
  "cluster_name" : "mycluster",
  "status" : "green",
  "timed_out" : false,
  "number_of_nodes" : 2,
  "number_of_data_nodes" : 2,
  "active_primary_shards" : 4,
  "active_shards" : 8,
  "relocating_shards" : 0,
  "initializing_shards" : 0,
  "unassigned_shards" : 0,
  "delayed_unassigned_shards" : 0,
  "number_of_pending_tasks" : 0,
  "number_of_in_flight_fetch" : 0,
  "task_max_waiting_in_queue_millis" : 0,
  "active_shards_percent_as_number" : 100.0
}
クラスタのノード確認
$ curl -k https://elastic:elastic@node1:9200/_cat/nodes?v
ip           heap.percent ram.percent cpu load_1m load_5m load_15m node.role   master name
172.31.6.170           55          86  21    0.02    0.05     0.27 cdfhilmrstw *      ip-172-31-6-170.ec2.internal
172.31.1.200           38          88  20    0.00    0.04     0.20 cdfhilmrstw -      ip-172-31-1-200.ec2.internal
シャードを確認
percolatorトラックで使用するqueriesインデクスのみ抜粋しています。
ドキュメント数は変わらず200万件、二つのシャードそれぞれのプライマリ(p)とレプリカ(r)が
二つのノードに均等に分散配置されています。
- ノード1: シャード1のレプリカ、シャード2のプライマリ
- ノード2: シャード1のプライマリ、シャード2のレプリカ
$ curl -k https://elastic:elastic@node1:9200/_cat/shards?v
index            shard prirep state      docs   store ip           node
queries          0     r      STARTED  998904 57.4mb 172.31.6.170 ip-172-31-6-170.ec2.internal
queries          0     p      STARTED  998904   57mb 172.31.1.200 ip-172-31-1-200.ec2.internal
queries          1     p      STARTED 1001096 57.2mb 172.31.6.170 ip-172-31-6-170.ec2.internal
queries          1     r      STARTED 1001096 57.7mb 172.31.1.200 ip-172-31-1-200.ec2.internal
vmstatコマンドを停止
二つのノードで実行中のvmstatコマンドを停止します。
二つの構成の性能を比較
- RallyベンチマークのレースIDを確認します
二つの構成に対して実施したベンチマークのレースIDを控えておきます。
$ esrally list races

Recent races:

Race ID                               Race Timestamp    Track       Challenge            Car       ES Version    Revision                                  Rally Version    Track Revision    Team Revision    User Tags
------------------------------------  ----------------  ----------  -------------------  --------  ------------  ----------------------------------------  ---------------  ----------------  ---------------  -----------
e2403687-c0ce-4f21-b286-852bea910966  20230208T040013Z  percolator  append-no-conflicts  external  8.6.1         180c9830da956993e59e2cd70eb32b5e383ea42c  2.7.0            b2f887a
29a78535-db7b-4d98-8f3e-aa67c674ed40  20230208T031833Z  percolator  append-no-conflicts  external  8.6.1         180c9830da956993e59e2cd70eb32b5e383ea42c  2.7.0            b2f887a
- Rallyのcompareコマンドを使って、二つのレース結果を比較します
$ esrally compare --baseline={比較元となるraceid} --contender={比較先となるraceid} --report-file={結果レポート}
$ esrally compare --baseline=29a78535-db7b-4d98-8f3e-aa67c674ed40 --contender=e2403687-c0ce-4f21-b286-852bea910966 --report-file=compare_n1s1r0_n2s2r0.md
比較結果から、秒間処理量を示すThroughputのみ抜粋します。
| Metric | Task | Baseline | Contender | Diff | Unit | Diff % |
|---|---|---|---|---|---|---|
| Min Throughput | index | 7796.37 | 6466.41 | -1329.96 | docs/s | -17.06% |
| Mean Throughput | index | 18240.7 | 16555.1 | -1685.61 | docs/s | -9.24% |
| Median Throughput | index | 18730.3 | 17158 | -1572.37 | docs/s | -8.39% |
| Max Throughput | index | 27302.9 | 25639.9 | -1662.98 | docs/s | -6.09% |
| Min Throughput | percolator_with_content_president_bush | 17.8078 | 19.5935 | 1.78568 | ops/s | +10.03% |
| Mean Throughput | percolator_with_content_president_bush | 20.0201 | 21.053 | 1.03294 | ops/s | +5.16% |
| Median Throughput | percolator_with_content_president_bush | 20.1961 | 21.053 | 0.85692 | ops/s | +4.24% |
| Max Throughput | percolator_with_content_president_bush | 22.0563 | 22.5125 | 0.45622 | ops/s | +2.07% |
| Min Throughput | percolator_with_content_saddam_hussein | 48.7043 | 49.5674 | 0.86311 | ops/s | +1.77% |
| Mean Throughput | percolator_with_content_saddam_hussein | 48.857 | 49.618 | 0.76102 | ops/s | +1.56% |
| Median Throughput | percolator_with_content_saddam_hussein | 48.857 | 49.618 | 0.76102 | ops/s | +1.56% |
| Max Throughput | percolator_with_content_saddam_hussein | 49.0096 | 49.6686 | 0.65893 | ops/s | +1.34% |
| Min Throughput | percolator_with_content_hurricane_katrina | 49.3263 | 49.2615 | -0.06482 | ops/s | -0.13% |
| Mean Throughput | percolator_with_content_hurricane_katrina | 49.4193 | 49.3588 | -0.06053 | ops/s | -0.12% |
| Median Throughput | percolator_with_content_hurricane_katrina | 49.4193 | 49.3588 | -0.06053 | ops/s | -0.12% |
| Max Throughput | percolator_with_content_hurricane_katrina | 49.5123 | 49.4561 | -0.05625 | ops/s | -0.11% |
| Min Throughput | percolator_with_content_google | 9.09016 | 16.9269 | 7.83671 | ops/s | +86.21% |
| Mean Throughput | percolator_with_content_google | 9.24156 | 17.391 | 8.14948 | ops/s | +88.18% |
| Median Throughput | percolator_with_content_google | 9.2259 | 17.4746 | 8.2487 | ops/s | +89.41% |
| Max Throughput | percolator_with_content_google | 9.42384 | 17.7734 | 8.34961 | ops/s | +88.60% |
| Min Throughput | percolator_no_score_with_content_google | 97.5881 | 84.497 | -13.091 | ops/s | -13.41% |
| Mean Throughput | percolator_no_score_with_content_google | 97.5881 | 84.497 | -13.091 | ops/s | -13.41% |
| Median Throughput | percolator_no_score_with_content_google | 97.5881 | 84.497 | -13.091 | ops/s | -13.41% |
| Max Throughput | percolator_no_score_with_content_google | 97.5881 | 84.497 | -13.091 | ops/s | -13.41% |
| Min Throughput | percolator_with_highlighting | 48.8527 | 47.4501 | -1.40264 | ops/s | -2.87% |
| Mean Throughput | percolator_with_highlighting | 48.9988 | 47.7744 | -1.22434 | ops/s | -2.50% |
| Median Throughput | percolator_with_highlighting | 48.9988 | 47.7744 | -1.22434 | ops/s | -2.50% |
| Max Throughput | percolator_with_highlighting | 49.1448 | 48.0988 | -1.04603 | ops/s | -2.13% |
| Min Throughput | percolator_with_content_ignore_me | 0.0806263 | 0.0836496 | 0.00302 | ops/s | +3.75% |
| Mean Throughput | percolator_with_content_ignore_me | 0.081156 | 0.0841616 | 0.00301 | ops/s | +3.70% |
| Median Throughput | percolator_with_content_ignore_me | 0.0812006 | 0.0839102 | 0.00271 | ops/s | +3.34% |
| Max Throughput | percolator_with_content_ignore_me | 0.081277 | 0.0866074 | 0.00533 | ops/s | +6.56% |
| Min Throughput | percolator_no_score_with_content_ignore_me | 15.0302 | 15.0137 | -0.01652 | ops/s | -0.11% |
| Mean Throughput | percolator_no_score_with_content_ignore_me | 15.0413 | 15.0184 | -0.02287 | ops/s | -0.15% |
| Median Throughput | percolator_no_score_with_content_ignore_me | 15.0375 | 15.0172 | -0.02038 | ops/s | -0.14% |
| Max Throughput | percolator_no_score_with_content_ignore_me | 15.0569 | 15.0264 | -0.0305 | ops/s | -0.20% |
考察
- インデクシングのパフォーマンス
- 10%ほど性能落ちました(レプリカ作成による負荷増なのか)
- 検索のパフォーマンス
- 全体的に大きな性能差は見られません
- 但し、
percolator_with_content_googleだけが、90%ほど性能アップしました- 検索パターンによっては、レプリカも性能アップに寄与するのか(条件については宿題とさせてください)
- 対して、
percolator_no_score_with_content_googleは、10%ほど性能が落ちています
- vmstatのシステムリソースの計測結果
- CPUとMemoryは、二つの構成においてほぼ同じ
- Disk I/Oは、構成2(レプリカあり)が高い(レプリカ作成によるものか)
| 構成 | CPU使用率(peak) | Memory使用率(peak) | Disk I/O(インデクシング時のbo値) |
|---|---|---|---|
| 構成2(2ノード/2シャード/0レプリカ) | 30%(ノード1、ノード2それぞれ) | 60%(ノード1、ノード2それぞれ) | 3000(ノード1、ノード2それぞれ) |
| 構成2(2ノード/2シャード/1レプリカ) | 30%(ノード1、ノード2それぞれ) | 65%(ノード1、ノード2それぞれ) | 5000(ノード1、ノード2それぞれ) |
おわりに
Elasticsearchクラスタのレプリカ数による性能比較を行いました。
次回は、二つのノードでディスクを共有した場合(Disk I/O分散なし)の性能検証です。
お楽しみに。