はじめに
Elasticsearchクラスタ分散処理の性能検証を、数回に分けて行います。
シリーズの目次
- Part1(今回): ベンチマークツールRallyを使ってみる
- Part2: Amzon EC2にクラスタを構築する
- Part3: ノード数/シャード数による性能比較
- Part4: レプリカ数による性能比較
今回はPart1の[ベンチマークツールRallyを使ってみる]です。
Elasticsearch公式のベンチマークツールRallyについて、
その使用方法や実行結果などを理解してみます。
Elasticsearch(エラスティックサーチ)とは
- 全文検索サーバである、検索エンジンにApache Luceneを使用
- 転置インデックスを使用し、全文検索を高速に
- 分散配置により、検索性能と可用性のスケールアウトを実現
- クラスタ構成でデータを分散保存/処理
- REST APIを使ってJSONフォーマットの文書を扱う
- 他のシステムと親和性がよい
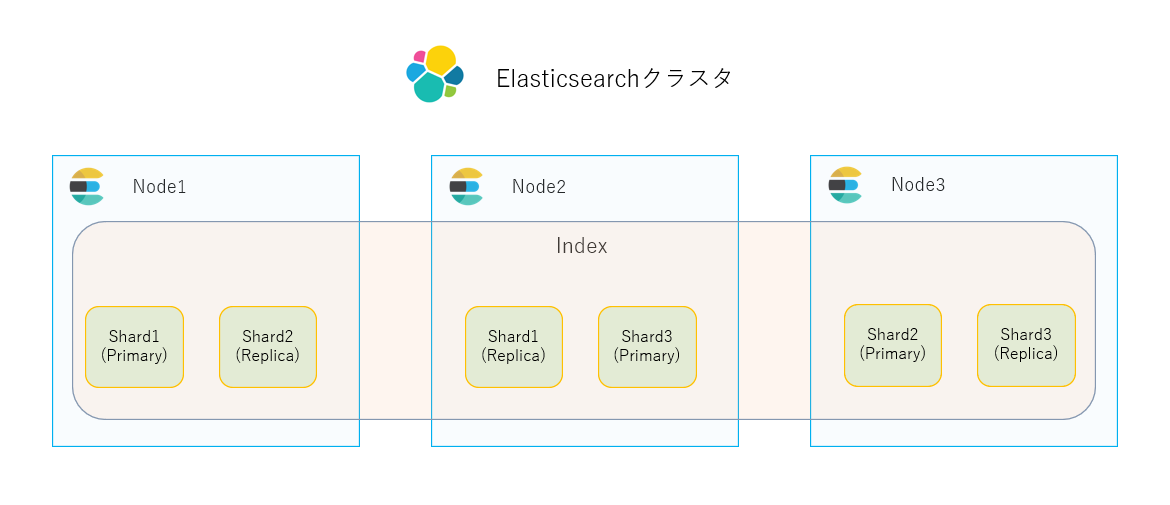
Elasticsearchクラスタ構成図
Elasticsearchの論理構成
用語
- インデックス
- ドキュメントの保存場所
- ドキュメント
- インデックスに格納する一つの文章単位(RDBのレコード相当)
- フィールド
- ドキュメント内のキー/バリューペア
- データ型が存在
- ドキュメント内のキー/バリューペア
- ドキュメントタイプ
- 全フィールドのデータ型(RDBのスキーマ相当)
- 1つのインデックスに一種類のドキュメントタイプのみ
- マッピング
- ドキュメントタイプの定義(RDBのテーブル定義相当)
論理構成
- インデックス
- ドキュメントタイプ(マッピング)
- ドキュメント1
- フィールド1
- フィールド2
- ドキュメント2
- フィールド1
- フィールド2
- ドキュメント1
- ドキュメントタイプ(マッピング)
Elasticsearchの物理構成
用語
- ノード
- Elasticsearchが稼働する各サーバ
- クラスタ
- 複数ノードが協調動作するグループ
- シャード
- インデックスのデータを分散して保持
- 実体はLuceneインデックスファイル
- 目的
- 複数ノードで並列検索により性能向上
- 冗長化による耐障害性(ノードダウンによるデータロスト防止)
- インデックス作成後には増やせない
- Aggregationなどの処理は、シャード単位の実行結果がマージされる
- インデックスのデータを分散して保持
- レプリカ
- シャードの複製である、冗長化のためプライマリとレプリカは異なるノードに配置
- 目的
- 可用性(個別ノードがダウンしても別ノードのコピーが存在するため)
- 検索性能向上の狙いも
- ディスクアクセスを並列化できなければ性能を向上できない
- インデックス作成後も増やせる
物理構成
- クラスタ
- ノード1
- インデックス1
- シャード1(プライマリ)
- シャード2(レプリカ)
- インデックス2
- シャード1(プライマリ)
- シャード2(レプリカ)
- インデックス1
- ノード2
- インデックス1
- シャード1(レプリカ)
- シャード2(プライマリ)
- インデックス2
- シャード1(レプリカ)
- シャード2(プライマリ)
- インデックス1
- ノード1
ベンチマークツールRallyとは
- Elastic社公式のPythonベースのElasticsearchベンチマークCLIツール(OSS)
- JSONで定義されたシナリオをベースにElasticsearchに対して負荷をかける
- Elasticsearchの異なるバージョン間でパフォーマンス比較可能
- 目的に応じたテストシナリオとデータを用意してくれる
- 負荷テスト結果を詳しく表示・記録してくれる
- おのずのベンチマーク結果を比較することができる
Rallyの実行方法
-
Rally実行方法を理解するためのクラスタ構成
- 検証には2ノードクラスタを使用
- 2ノードクラスタは耐障害性に乏しく、本番環境で使用すべきではありません
- 今回は性能比較が目的であるため、2ノードを使用します
- 検証には2ノードクラスタを使用
-
Rallyオプション説明
| オプション | 説明 | 備考 |
|---|---|---|
| track | 作成するtrack名 | 今回はpmcを使用 |
| track-path | 独自のtrackを使う場合pathを指定 | |
| target-hosts | 既存クラスタのホスト | |
| pipeline | Rallyを実行するpipelineを指定 | benchmark-onlyを指定するとElasticsearchをプロビジョニングせず既存クラスタを使用 |
| client-options | Rally内部で使用するElasticsearchクライアントのオプション | basic_auth_user、basic_auth_passwordにcredentialsの値を指定 |
| kill-running-processes | 実行中の別のベンチマークが存在したら強制終了 | |
| report-file | 結果レポートファイルを指定 | |
| track-params | trackにカスタム設定値を追加(シャード数やレプリカ数など) |
Rallyレースコマンドでベンチマーク実行
$ esrally race --track=pmc --pipeline=benchmark-only --track-params="number_of_shards:1,number_of_replicas:0" --target-hosts=node1:9200,node2:9200 --client-options="timeout:60,use_ssl:true,verify_certs:false,basic_auth_user:'elastic',basic_auth_password:'xxxxxx'" --kill-running-processes --report-file=result_pmc_1shards_0replicas.md

    ____        ____
   / __ \____ _/ / /_  __
  / /_/ / __ `/ / / / / /
 / _, _/ /_/ / / / /_/ /
/_/ |_|\__,_/_/_/\__, /
                /____/

[INFO] Race id is [3cf13582-56ac-44eb-9db6-ad809339b6f0]
[INFO] Racing on track [pmc], challenge [append-no-conflicts] and car ['external'] with version [8.5.3].

Running put-settings                                                           [100% done]
Running delete-index                                                           [100% done]
Running create-index                                                           [100% done]
Running check-cluster-health                                                   [100% done]
Running index-append                                                           [100% done]
Running refresh-after-index                                                    [100% done]
Running force-merge                                                            [100% done]
Running refresh-after-force-merge                                              [100% done]
Running wait-until-merges-finish                                               [100% done]
Running default                                                                [100% done]
Running term                                                                   [100% done]
Running phrase                                                                 [100% done]
Running articles_monthly_agg_uncached                                          [100% done]
Running articles_monthly_agg_cached                                            [100% done]
Running scroll                                                                 [100% done]

------------------------------------------------------
    _______             __   _____
   / ____(_)___  ____ _/ /  / ___/_________  ________
  / /_  / / __ \/ __ `/ /   \__ \/ ___/ __ \/ ___/ _ \
 / __/ / / / / / /_/ / /   ___/ / /__/ /_/ / /  /  __/
/_/   /_/_/ /_/\__,_/_/   /____/\___/\____/_/   \___/
------------------------------------------------------
... ...(スコアは後続の表をご参照)
----------------------------------
[INFO] SUCCESS (took 3464 seconds)
----------------------------------
各種メトリクス計測結果から、インデクシングや検索(Aggregation)の性能を確認できます。
| Metric | Task | Value | Unit |
|---|---|---|---|
| Cumulative indexing time of primary shards | 143.98 | min | |
| Min cumulative indexing time across primary shards | 143.98 | min | |
| Median cumulative indexing time across primary shards | 143.98 | min | |
| Max cumulative indexing time across primary shards | 143.98 | min | |
| Cumulative indexing throttle time of primary shards | 0 | min | |
| Min cumulative indexing throttle time across primary shards | 0 | min | |
| Median cumulative indexing throttle time across primary shards | 0 | min | |
| Max cumulative indexing throttle time across primary shards | 0 | min | |
| Cumulative merge time of primary shards | 118.239 | min | |
| Cumulative merge count of primary shards | 34 | ||
| Min cumulative merge time across primary shards | 118.239 | min | |
| Median cumulative merge time across primary shards | 118.239 | min | |
| Max cumulative merge time across primary shards | 118.239 | min | |
| Cumulative merge throttle time of primary shards | 13.7044 | min | |
| Min cumulative merge throttle time across primary shards | 13.7044 | min | |
| Median cumulative merge throttle time across primary shards | 13.7044 | min | |
| Max cumulative merge throttle time across primary shards | 13.7044 | min | |
| Cumulative refresh time of primary shards | 12.9731 | min | |
| Cumulative refresh count of primary shards | 56 | ||
| Min cumulative refresh time across primary shards | 12.9731 | min | |
| Median cumulative refresh time across primary shards | 12.9731 | min | |
| Max cumulative refresh time across primary shards | 12.9731 | min | |
| Cumulative flush time of primary shards | 41.337 | min | |
| Cumulative flush count of primary shards | 39 | ||
| Min cumulative flush time across primary shards | 41.337 | min | |
| Median cumulative flush time across primary shards | 41.337 | min | |
| Max cumulative flush time across primary shards | 41.337 | min | |
| Total Young Gen GC time | 1009.48 | s | |
| Total Young Gen GC count | 2305 | ||
| Total Old Gen GC time | 0 | s | |
| Total Old Gen GC count | 0 | ||
| Store size | 14.8967 | GB | |
| Translog size | 5.12227e-08 | GB | |
| Heap used for segments | 0 | MB | |
| Heap used for doc values | 0 | MB | |
| Heap used for terms | 0 | MB | |
| Heap used for norms | 0 | MB | |
| Heap used for points | 0 | MB | |
| Heap used for stored fields | 0 | MB | |
| Segment count | 33 | ||
| Total Ingest Pipeline count | 0 | ||
| Total Ingest Pipeline time | 0 | s | |
| Total Ingest Pipeline failed | 0 | ||
| Min Throughput | index-append | 177.63 | docs/s |
| Mean Throughput | index-append | 278.68 | docs/s |
| Median Throughput | index-append | 243.11 | docs/s |
| Max Throughput | index-append | 489.34 | docs/s |
| 50th percentile latency | index-append | 16903.1 | ms |
| 90th percentile latency | index-append | 48452.8 | ms |
| 99th percentile latency | index-append | 87295.3 | ms |
| 100th percentile latency | index-append | 101580 | ms |
| 50th percentile service time | index-append | 16903.1 | ms |
| 90th percentile service time | index-append | 48452.8 | ms |
| 99th percentile service time | index-append | 87295.3 | ms |
| 100th percentile service time | index-append | 101580 | ms |
| error rate | index-append | 26.4 | % |
| Min Throughput | default | 19.95 | ops/s |
| Mean Throughput | default | 19.96 | ops/s |
| Median Throughput | default | 19.96 | ops/s |
| Max Throughput | default | 19.96 | ops/s |
| 50th percentile latency | default | 10.6891 | ms |
| 90th percentile latency | default | 15.0844 | ms |
| 99th percentile latency | default | 18.6655 | ms |
| 100th percentile latency | default | 26.6355 | ms |
| 50th percentile service time | default | 9.36279 | ms |
| 90th percentile service time | default | 13.7502 | ms |
| 99th percentile service time | default | 17.1427 | ms |
| 100th percentile service time | default | 25.557 | ms |
| error rate | default | 0 | % |
| Min Throughput | term | 19.51 | ops/s |
| Mean Throughput | term | 19.58 | ops/s |
| Median Throughput | term | 19.58 | ops/s |
| Max Throughput | term | 19.63 | ops/s |
| 50th percentile latency | term | 11.5899 | ms |
| 90th percentile latency | term | 15.0642 | ms |
| 99th percentile latency | term | 20.0478 | ms |
| 100th percentile latency | term | 20.8242 | ms |
| 50th percentile service time | term | 10.4711 | ms |
| 90th percentile service time | term | 13.6763 | ms |
| 99th percentile service time | term | 18.6751 | ms |
| 100th percentile service time | term | 19.7146 | ms |
| error rate | term | 0 | % |
| Min Throughput | phrase | 19.72 | ops/s |
| Mean Throughput | phrase | 19.76 | ops/s |
| Median Throughput | phrase | 19.76 | ops/s |
| Max Throughput | phrase | 19.79 | ops/s |
| 50th percentile latency | phrase | 10.6717 | ms |
| 90th percentile latency | phrase | 40.9934 | ms |
| 99th percentile latency | phrase | 77.9175 | ms |
| 100th percentile latency | phrase | 101.01 | ms |
| 50th percentile service time | phrase | 9.20574 | ms |
| 90th percentile service time | phrase | 37.8214 | ms |
| 99th percentile service time | phrase | 77.1413 | ms |
| 100th percentile service time | phrase | 100.017 | ms |
| error rate | phrase | 0 | % |
| Min Throughput | articles_monthly_agg_uncached | 19.84 | ops/s |
| Mean Throughput | articles_monthly_agg_uncached | 19.87 | ops/s |
| Median Throughput | articles_monthly_agg_uncached | 19.87 | ops/s |
| Max Throughput | articles_monthly_agg_uncached | 19.88 | ops/s |
| 50th percentile latency | articles_monthly_agg_uncached | 22.3645 | ms |
| 90th percentile latency | articles_monthly_agg_uncached | 25.908 | ms |
| 99th percentile latency | articles_monthly_agg_uncached | 29.3467 | ms |
| 100th percentile latency | articles_monthly_agg_uncached | 33.5861 | ms |
| 50th percentile service time | articles_monthly_agg_uncached | 21.1526 | ms |
| 90th percentile service time | articles_monthly_agg_uncached | 24.4469 | ms |
| 99th percentile service time | articles_monthly_agg_uncached | 27.8936 | ms |
| 100th percentile service time | articles_monthly_agg_uncached | 31.9569 | ms |
| error rate | articles_monthly_agg_uncached | 0 | % |
| Min Throughput | articles_monthly_agg_cached | 20.01 | ops/s |
| Mean Throughput | articles_monthly_agg_cached | 20.01 | ops/s |
| Median Throughput | articles_monthly_agg_cached | 20.01 | ops/s |
| Max Throughput | articles_monthly_agg_cached | 20.01 | ops/s |
| 50th percentile latency | articles_monthly_agg_cached | 6.49327 | ms |
| 90th percentile latency | articles_monthly_agg_cached | 8.27489 | ms |
| 99th percentile latency | articles_monthly_agg_cached | 15.9853 | ms |
| 100th percentile latency | articles_monthly_agg_cached | 17.4464 | ms |
| 50th percentile service time | articles_monthly_agg_cached | 5.22505 | ms |
| 90th percentile service time | articles_monthly_agg_cached | 6.78718 | ms |
| 99th percentile service time | articles_monthly_agg_cached | 14.5646 | ms |
| 100th percentile service time | articles_monthly_agg_cached | 16.1821 | ms |
| error rate | articles_monthly_agg_cached | 0 | % |
| Min Throughput | scroll | 12.54 | pages/s |
| Mean Throughput | scroll | 12.57 | pages/s |
| Median Throughput | scroll | 12.57 | pages/s |
| Max Throughput | scroll | 12.63 | pages/s |
| 50th percentile latency | scroll | 639.052 | ms |
| 90th percentile latency | scroll | 673.042 | ms |
| 99th percentile latency | scroll | 746.731 | ms |
| 100th percentile latency | scroll | 862.632 | ms |
| 50th percentile service time | scroll | 635.773 | ms |
| 90th percentile service time | scroll | 669.574 | ms |
| 99th percentile service time | scroll | 743.627 | ms |
| 100th percentile service time | scroll | 860.13 | ms |
| error rate | scroll | 0 | % |
二つのレース間の差分比較
レース間の差分は以下のコマンドで確認できます。
$ esrally compare --baseline={比較元となるraceid} --contender={比較先となるraceid} --report-file={結果レポート}
おわりに
ElasticsearchクラスタのベンチマークツールRallyの使用方法を理解しました。
次回から、シャード数/レプリカ数を変えながら性能比較検証を実施予定です。
お楽しみに。