TensorBoardでTensorFlowの理解を早める
文系卒でDeep LearningどころかPythonも初めてだと、TensorFlowを理解するのが遅くてなかなか苦しいです。少しでも理解を早めるためにもTensorBoardを学習しました。複雑なディープラーニングの理解促進はもちろん、デバッグや処理最適化・再設計などいろんなことに使えます。いろいろな見える化ができるのですが、当記事は入門者に向けたGraph出力方法に絞って解説します(もっと広く深くできればいいのですが、そこまで筆者の理解が追いついていません![]() )。
)。
公式ガイド「TensorBoard: Visualizing Learning」がわかりにくかったので、かなり簡素化しています。
TensorBoardで処理を可視化するのサイトが素晴らしく、かなり参考にさせて頂きました。
環境:python3.5 tensorflow1.1とtensorflow1.21の両方で確認済
参考リンク
- TensorFlowをWindowsにインストール Python初心者でも簡単だった件
- 【入門者向け解説】TensorFlow基本構文とコンセプト
- 【入門者向け解説】TensorFlowチュートリアルMNIST(初心者向け)
- [TensorFlowチュートリアルMNIST(初心者向け)をTensorBoardで見える化]
(http://qiita.com/FukuharaYohei/items/2834cc054a8b8884e150)- 【TensorBoard入門:image編】TensorFlow画像処理を見える化して理解を深める
- 【TensorBoard入門:Projector編】TensorFlow処理をかっこよく見える化
- 【入門者向け解説】TensorFlowチュートリアルDeep MNIST
- TensorFlow APIメモ
- TensorFlow理解のために柏木由紀さん顔特徴を調べてみた【前編】
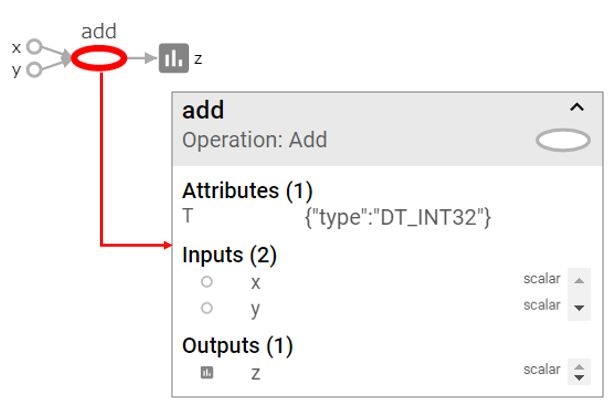
TensorBoard(Graph)の簡単なロジック
1+2 の式をGraphで見える化
こんな感じで定数の1+2を計算して、見える化します。正直、非常に簡単です。
import tensorflow as tf
sess = tf.InteractiveSession()

# TensorBoard情報出力ディレクトリ
log_dir = '/tmp/tensorflow/mnist/logs/simple01'

# 指定したディレクトリがあれば削除し、再作成
if tf.gfile.Exists(log_dir):
    tf.gfile.DeleteRecursively(log_dir)
tf.gfile.MakeDirs(log_dir)

# 定数で1 + 2
x = tf.constant(1, name='x')
y = tf.constant(2, name='y')
z = x + y

# このコマンドでzをグラフ上に出力
_ = tf.summary.scalar('z', z)

# SummaryWriterでグラフを書く(これより後のコマンドはグラフに出力されない)
summary_writer = tf.summary.FileWriter(log_dir , sess.graph)

# 実行
print(sess.run(z))

# SummaryWriterクローズ
summary_writer.close()
その後にTensorboardを起動します。筆者の環境はAnacondaで構築しているので、まずAnaconda NavigatorからTerminalを起動しています。
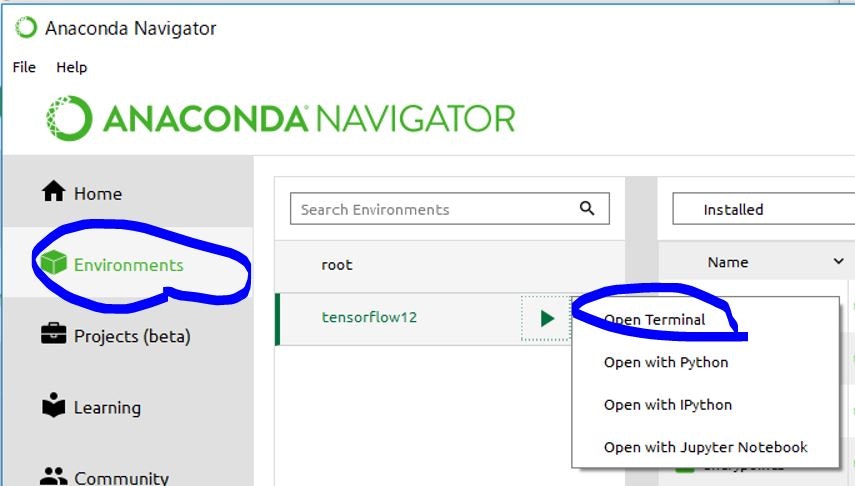
で、TerminalからTensorbaordをディレクトリを指定して起動します(Pythonプログラム内変数log_dirにディレクトリを格納しています)。
tensorboard --logdir=/tmp/tensorflow/mnist/logs/simple01
起動後にブラウザで http://localhost:6006/ を開くとTensorBoard画面が表示されます。
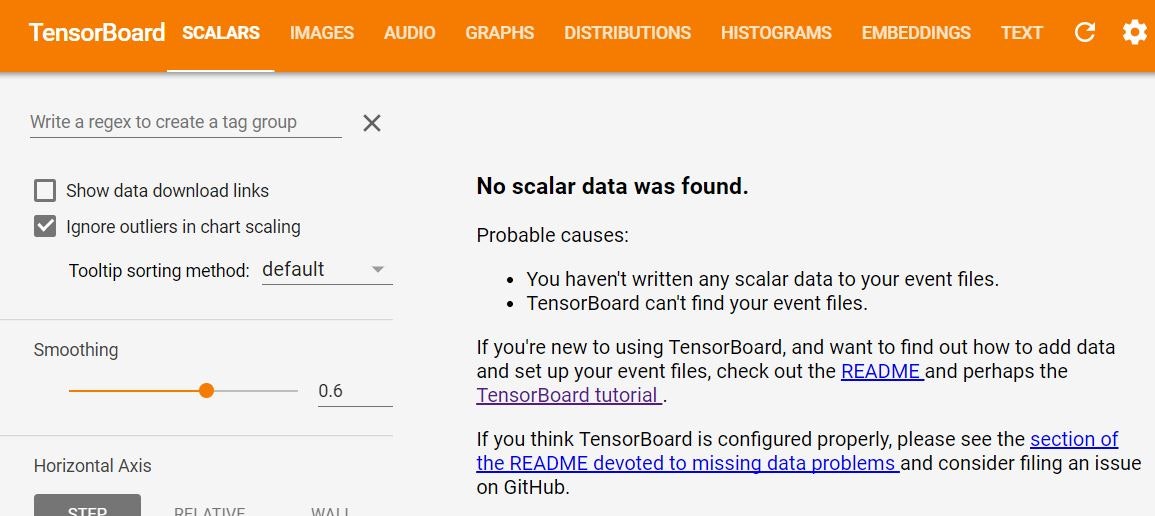
「No scalar data was found(データがないぞ)」と怒られますが、今回はscalarは出力しておらず、Graph出力のみとしているので問題ありません。画面上にあるメニューで「Graphs」を選ぶことで下図のGraphが出力されます。ここで1+2の計算式を見ることができました。
tf.name_scopeを使ってグルーピング
先程のソースコードにtf.name_scopeを加えるとグルーピングができます。
import tensorflow as tf
sess = tf.InteractiveSession()

# TensorBoard情報出力ディレクトリ
log_dir = '/tmp/tensorflow/mnist/logs/simple02'

# 指定したディレクトリがあれば削除し、再作成
if tf.gfile.Exists(log_dir):
    tf.gfile.DeleteRecursively(log_dir)
tf.gfile.MakeDirs(log_dir)

# add_scopeという名称でグルーピング
with tf.name_scope('add_scope'):

    # 定数で1 + 2
    x = tf.constant(1, name='x')
    y = tf.constant(2, name='y')
    z = x + y

    # このコマンドでzをグラフ上に出力
    _ = tf.summary.scalar('z', z)


# SummaryWriterでグラフを書く(これより後のコマンドはグラフに出力されない)
summary_writer = tf.summary.FileWriter(log_dir , sess.graph)

# 実行
print(sess.run(z))

# SummaryWriterクローズ
summary_writer.close()
結果
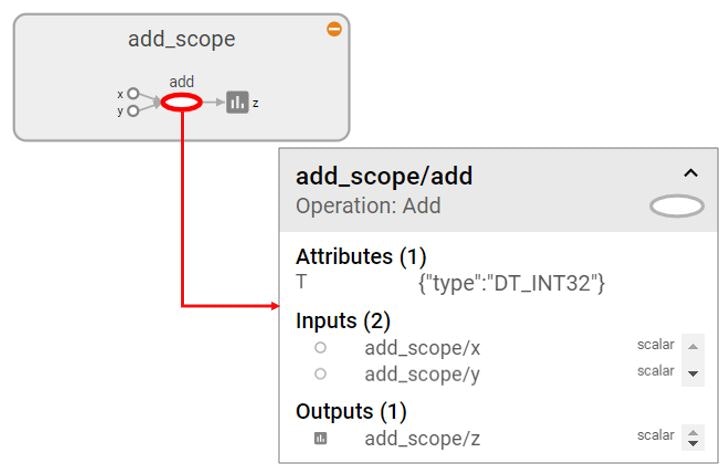
add_scopeという名称でグループ化(枠)ができています。計算が複雑な場合に、グループ化できないと見にく過ぎて厳しいです。
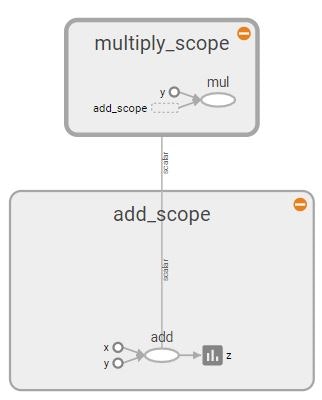
式の階層化
先程のソースコードにtf.name_scopeをさらに入れ子で追加して複数式の階層化をします。
import tensorflow as tf
sess = tf.InteractiveSession()

# TensorBoard情報出力ディレクトリ
log_dir = '/tmp/tensorflow/mnist/logs/simple02'

# 指定したディレクトリがあれば削除し、再作成
if tf.gfile.Exists(log_dir):
    tf.gfile.DeleteRecursively(log_dir)
tf.gfile.MakeDirs(log_dir)

# add_scopeという名称でグルーピング
with tf.name_scope('add_scope'):

    # 定数で1 + 2
    x = tf.constant(1, name='x')
    y = tf.constant(2, name='y')
    z = x + y

    # このコマンドでzをグラフ上に出力
    _ = tf.summary.scalar('z', z)

    # 上の結果に掛け算
    with tf.name_scope('multiply_scope'):
        zz = y * z

# SummaryWriterでグラフを書く(これより後のコマンドはグラフに出力されない)
summary_writer = tf.summary.FileWriter(log_dir , sess.graph)

# 実行
print(sess.run(z))

# SummaryWriterクローズ
summary_writer.close()
結果
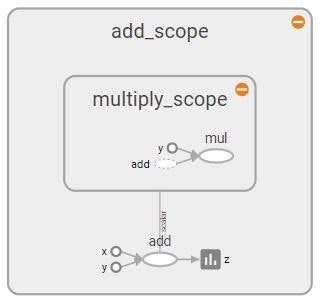
階層化してすっきりしました。
参考
ちなみに階層化ではなく、同列にするとこんな形で出力されます。