TensorFlowの初心者向けチュートリアルをTensorBoardで出力
TensorFlowの初心者向けチュートリアルMNIST For ML BeginnersをTensorBoardに出力して見える化しました。ですが、TensorBoardの見方(特にGraph以外)をほとんど理解していないのでコードと簡単な解説のみです。Deep Learningを実践していくと、非常に有用そうですが、そこまでのレベルに達していないので・・・
環境:python3.5 tensorflow1.1
参考リンク
- TensorFlowをWindowsにインストール Python初心者でも簡単だった件
- 【入門者向け解説】TensorFlow基本構文とコンセプト
- 【入門者向け解説】TensorFlowチュートリアルMNIST(初心者向け)
- TensorFlow APIメモ
- 【TensorBoard入門】TensorFlow処理を見える化して理解を深める
- 【TensorBoard入門:image編】TensorFlow画像処理を見える化して理解を深める
- 【TensorBoard入門:Projector編】TensorFlow処理をかっこよく見える化
- 【入門者向け解説】TensorFlowチュートリアルDeep MNIST
- TensorFlow理解のために柏木由紀さん顔特徴を調べてみた【前編】
コード
書いたコードは↓です。公式サイトの「TensorBoard: Visualizing Learning」を参考にしています。
import tensorflow as tf
sess = tf.InteractiveSession()

# MNISTデータ読込
from tensorflow.examples.tutorials.mnist import input_data
mnist = input_data.read_data_sets('MNIST_data', one_hot=True)

# TensorBoard情報出力ディレクトリ
log_dir = '/tmp/tensorflow/mnist/logs/mnist_beginner'

# 指定したディレクトリがあれば削除し、再作成
if tf.gfile.Exists(log_dir):
    tf.gfile.DeleteRecursively(log_dir)
tf.gfile.MakeDirs(log_dir)

# 変数を加工してTensorBoard出力する関数
def variable_summaries(var):

    # 変数Summaries
    with tf.name_scope('summaries'):
        mean = tf.reduce_mean(var)                      #Scalar出力(平均)
        tf.summary.scalar('mean', mean)
        with tf.name_scope('stddev'):
            stddev = tf.sqrt(tf.reduce_mean(tf.square(var - mean)))
        tf.summary.scalar('stddev', stddev)             #Scalar出力(標準偏差)
        tf.summary.scalar('max', tf.reduce_max(var))    #Scalar出力(最大値)
        tf.summary.scalar('min', tf.reduce_min(var))    #Scalar出力(最小値)
        tf.summary.histogram('histogram', var)          #ヒストグラム出力

# 回帰の計算
with tf.name_scope('layer'):
    with tf.name_scope('weights'):
        W = tf.Variable(tf.zeros([784,10]))
        variable_summaries(W)
    with tf.name_scope('biases'):
        b = tf.Variable(tf.zeros([10]))
        variable_summaries(b)
    with tf.name_scope('y'):
        y = tf.nn.softmax(tf.matmul(x, W) + b)
        tf.summary.histogram('y', y)

# クロスエントロピー
with tf.name_scope('cross_entropy'):
    with tf.name_scope('total'):
        cross_entropy = tf.reduce_mean(tf.nn.softmax_cross_entropy_with_logits(labels=y_, logits=y))
        tf.summary.scalar('cross_entropy', cross_entropy)

# 訓練
with tf.name_scope('train'):
    train_step = tf.train.GradientDescentOptimizer(0.5).minimize(cross_entropy)

# 正解
with tf.name_scope('accuracy'):
    with tf.name_scope('correct_prediction'):
        correct_prediction = tf.equal(tf.argmax(y,1),tf.argmax(y_,1))
    with tf.name_scope('accuracy'):
        accuracy = tf.reduce_mean(tf.cast(correct_prediction, tf.float32))
    tf.summary.scalar('accuracy', accuracy)

# 全Summariesを出力
merged = tf.summary.merge_all()
train_writer = tf.summary.FileWriter(log_dir + '/train', sess.graph) #訓練データ
test_writer  = tf.summary.FileWriter(log_dir + '/test')              #テストデータ

# 初期化
tf.global_variables_initializer().run()

for i in range(1000):
    batch_xs, batch_ys = mnist.train.next_batch(100)

#   10回ごとにテストし、正解率を出力
    if i % 10 == 0:  # Record summaries and test-set accuracy
        summary, acc = sess.run([merged, accuracy], feed_dict={x: mnist.test.images, y_:mnist.test.labels})
        test_writer.add_summary(summary, i)
        print('Accuracy at step %s: %s' % (i, acc))

#   訓練
    else:  # Record train set summaries, and train

#       訓練のうち1回/100回は、詳細訓練データを出力
        if i % 100 == 99:  # Record execution stats
            run_options  = tf.RunOptions(trace_level=tf.RunOptions.FULL_TRACE)
            run_metadata = tf.RunMetadata()
            summary, _   = sess.run([merged, train_step],
                              feed_dict={x: batch_xs, y_:batch_ys},
                              options=run_options,
                              run_metadata=run_metadata)
            train_writer.add_run_metadata(run_metadata, 'step%03d' % i)
            train_writer.add_summary(summary, i)
            print('Adding run metadata for', i)

        #通常の訓練
        else:
            summary, _ = sess.run([merged, train_step], feed_dict={x: batch_xs, y_:batch_ys})
            train_writer.add_summary(summary, i)

# Writerクローズ
train_writer.close()
test_writer.close()
TensorBoard起動
その後にTensorboardを起動します。筆者の環境はAnacondaで構築しているので、まずAnaconda NavigatorからTerminalを起動しています。
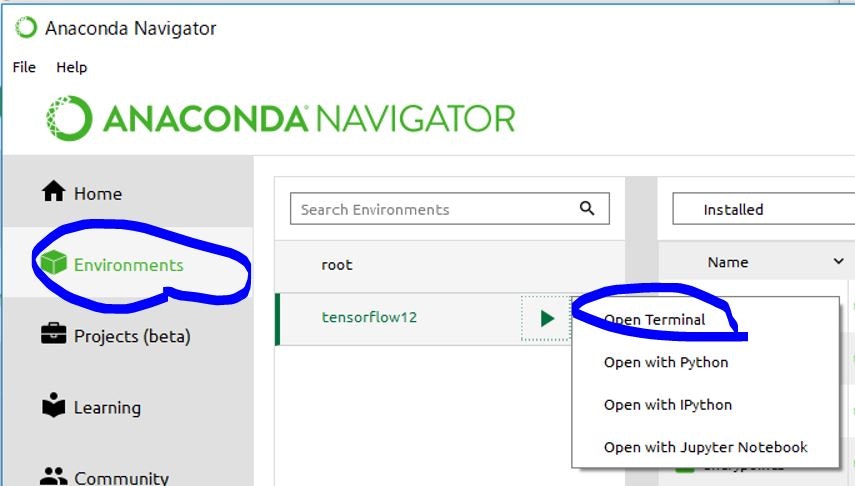
で、TerminalからTensorbaordをディレクトリを指定して起動します(Pythonプログラム内変数log_dirにディレクトリを格納しています)。
tensorboard --logdir=/tmp/tensorflow/mnist/logs/mnist_beginner
起動後にブラウザで http://localhost:6006/ を開くとTensorBoard画面が表示されます。
Graph
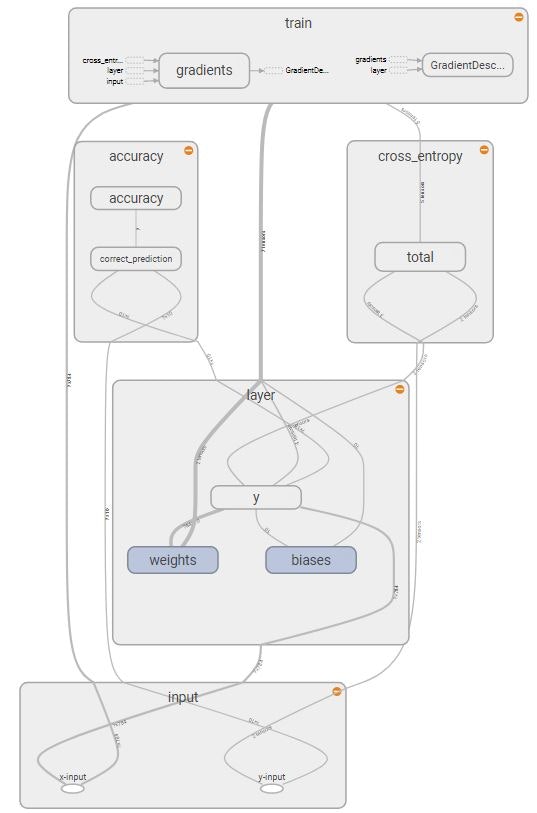
Computational Graphは下図の形で出力されます。入門記事では、シンプルな計算式だったのでグラフ化の必要性がなかったですが、このくらいの複雑さになると見やすいです。
Scalar(折れ線グラフ)
Scalar(折れ線グラフ)で正答率(accuracy)と交差エントロピー(クロスエントロピー)のステップごとの遷移が見られます。
青線が訓練データで、オレンジ線がテストデータです。
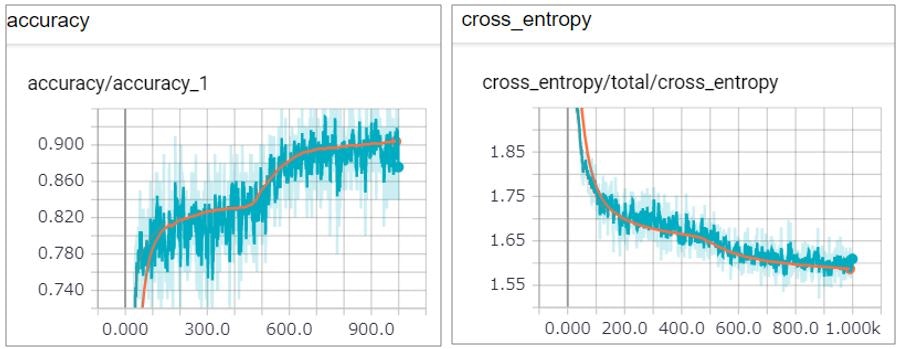
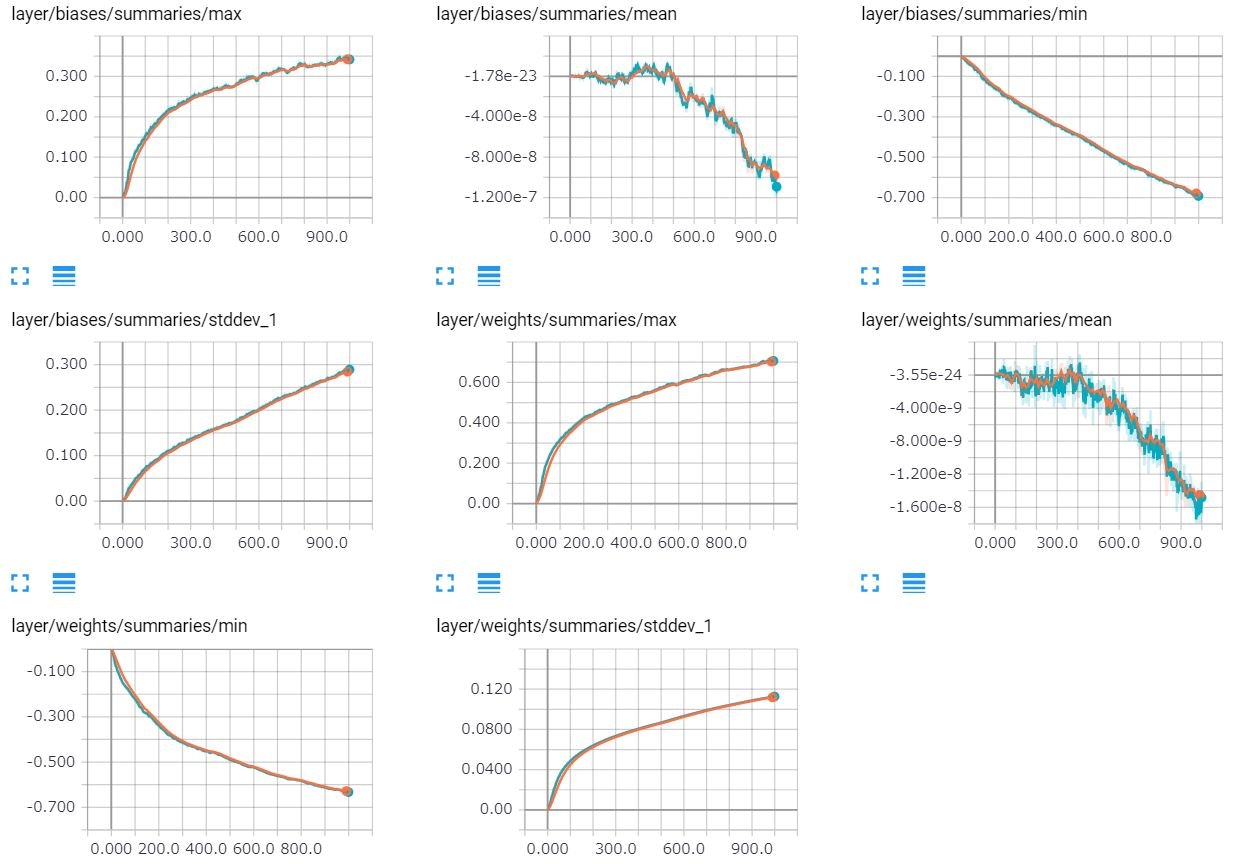
同様にバイアス(切片)や重み付けの値の標準偏差等の値の遷移も出力しています。
Distribution(分布)
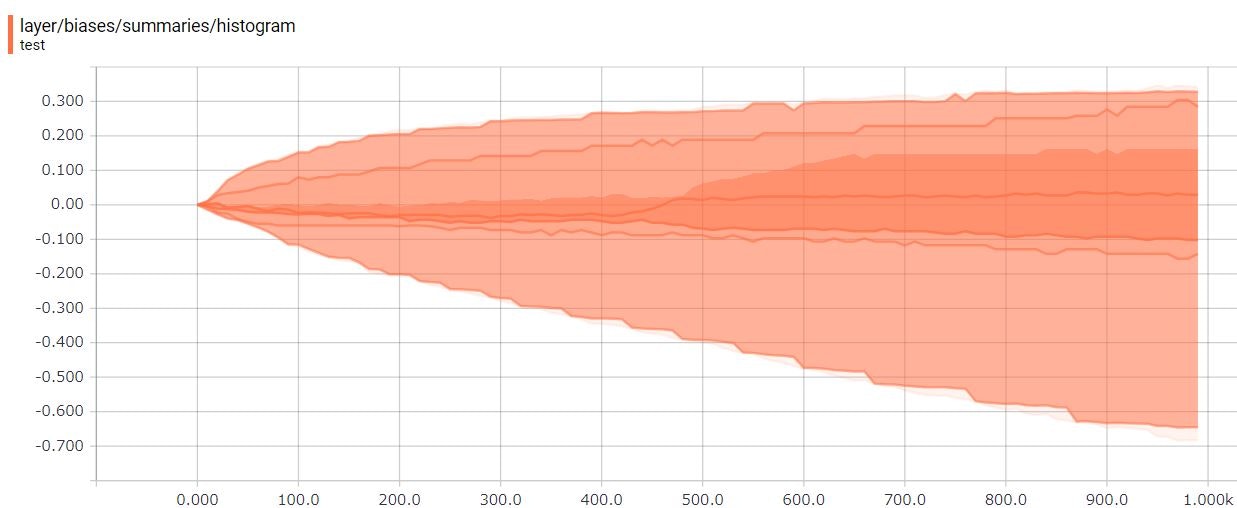
バイアスのDistribution(分布)を見てみましょう。0で初期化しているので0からスタートして、学習していくにつれ、バイアスのテンソルの値が変化していることがわかります。
Histogram(ヒストグラム)
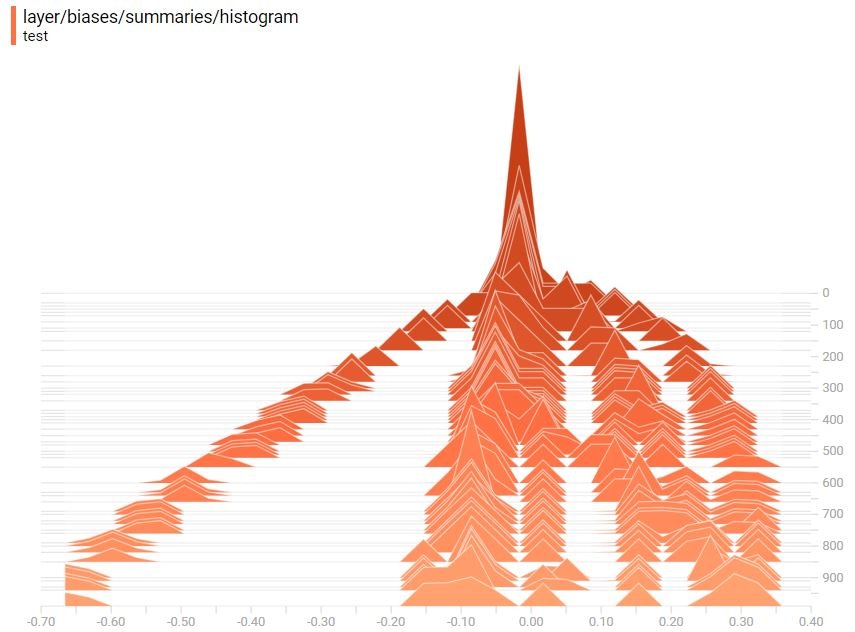
同じくバイアスのHistogram(ヒストグラム)を見てみます。3次元の度数分布です。Distribution(分布)で見たように0からスタートして、学習していくにつれ、バイアスのテンソルの値が変化しています。
