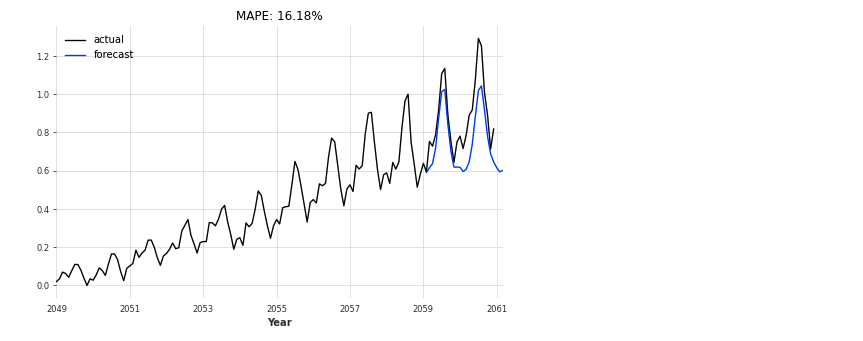
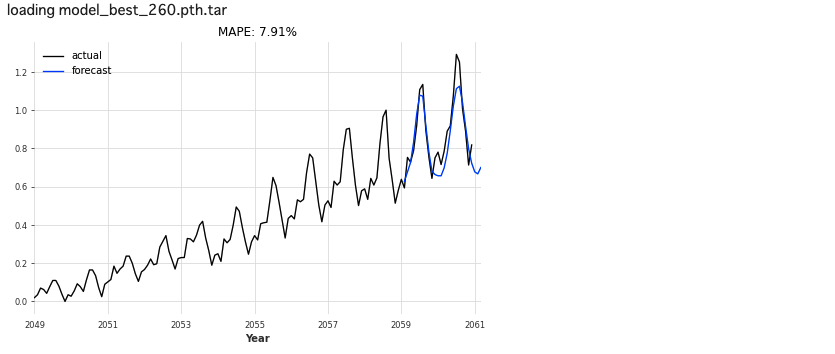
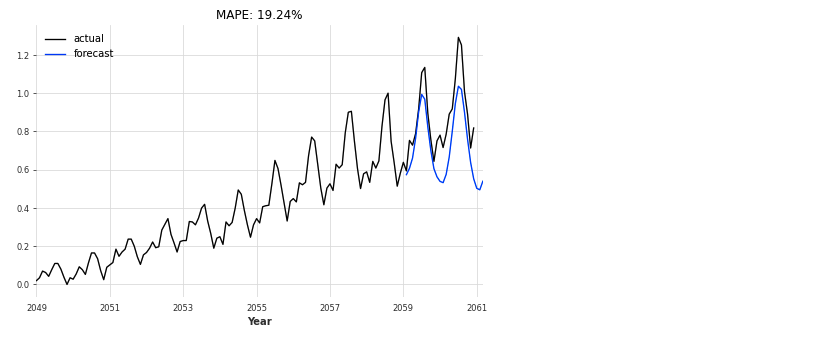
- 製造業出身のデータサイエンティストがお送りする記事
- 今回は時系列モデルを統一的なAPIで使用できるライブラリー(Darts)があったので使ってみました。
はじめに
過去に時系列解析に関する記事を整理しておりますので、興味ある方はそちらも参照して頂けますと幸いです。
Dartsとは
時系列モデルを分析する際は、様々なライブラリのAPIを理解して、それに合わせてデータ整形し、モデルを評価する必要がありました。
しかし、スイスの企業Unit8が2020年6月末に公開したDartsは上記のような課題を解決するライブラリです。簡単に言うと時系列データに関する様々なモデルをscikit-learnのように統一的に扱うことができます。
現在は下記モデルが対応しているようです。
- Exponential smoothing
- ARIMA & auto-ARIMA
- Facebook Prophet
- Theta method
- FFT (Fast Fourier Transform)
- Recurrent neural networks (vanilla RNNs, GRU, and LSTM variants)
- Temporal convolutional network
- Transformer
- N-BEATS
Dartsを使ってみた
ライブラリーのインストールは下記で簡単にできます。
pip install u8darts
まずは「AirPassengers」のデータを使って分析を行っていきます。
# 必要なライブラリーのインポート
import darts
from darts import TimeSeries
import pandas as pd
import numpy as np
import matplotlib.pyplot as plt
%matplotlib inline

from darts.metrics import mape, mase
from darts.utils.statistics import check_seasonality, plot_acf, plot_residuals_analysis

import warnings
warnings.filterwarnings("ignore")
import logging
logging.disable(logging.CRITICAL)

# https://stat.ethz.ch/R-manual/R-devel/library/datasets/html/AirPassengers.html
df = pd.read_csv('AirPassengers.csv')
# データの中身を確認
df.head()
次にDartsのTimeSeries型に変換します。
# DartsのTimeSeriesに変換
series = TimeSeries.from_dataframe(df, time_col='Month', value_cols='#Passengers')
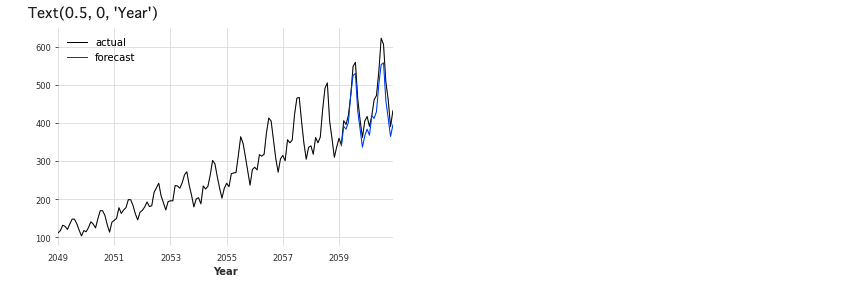
ExponentialSmoothing(指数平滑法)
初めに、HyndmanとAthanasopoulosによる指数平滑法を試してみます。今回は各手法の詳細は省きます。
# Jan-59以前と以後に分割
train, val = series.split_after(pd.Timestamp('Jan-59'))
from darts.models import ExponentialSmoothing

# モデル生成
model_es = ExponentialSmoothing()
# 学習
model_es.fit(train)
# 予測 (predictには予測数を入れることに注意)
historical_fcast_es = model_es.predict(len(val))
# 可視化
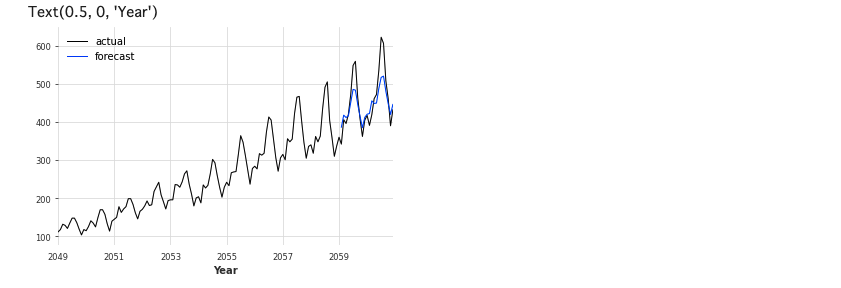
series.plot(label='actual', lw=1)
historical_fcast_es.plot(label='forecast', lw=1)
plt.legend()
plt.xlabel('Year')
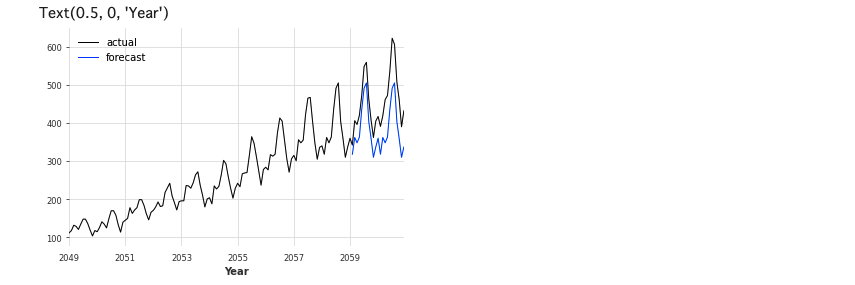
NaiveSeasonal
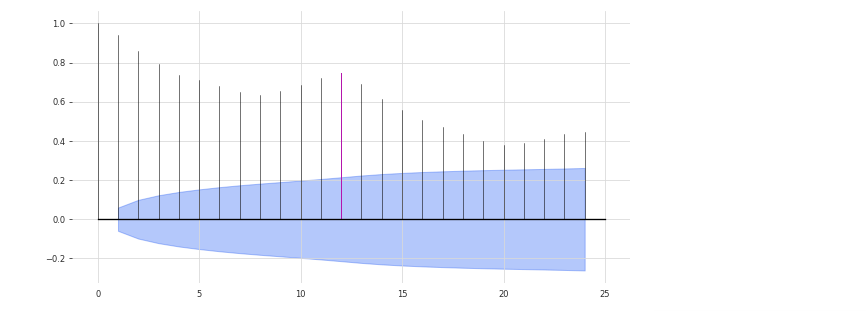
次にNaiveSeasonalと言う手法を試してみます。パラメータKが重要らしいので、適切に設定しないと上手く予測できないようです。
# 自己相関を求める
plot_acf(train, m = 12, alpha = .05)

# NaiveSeasonal
from darts.models import NaiveSeasonal
# モデル生成
seasonal_model = NaiveSeasonal(K=12)
# 学習
seasonal_model.fit(train)
# 予測
seasonal_forecast = seasonal_model.predict(len(val))
# 可視化
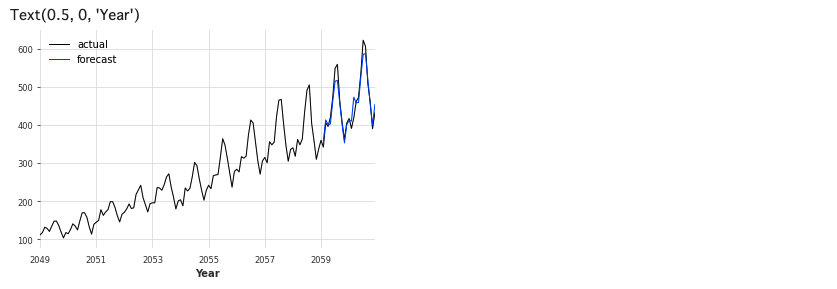
series.plot(label='actual', lw=1)
seasonal_forecast.plot(label='forecast', lw=1)
plt.legend()
plt.xlabel('Year')
12ヶ月周期を考慮したモデルを採用しております。
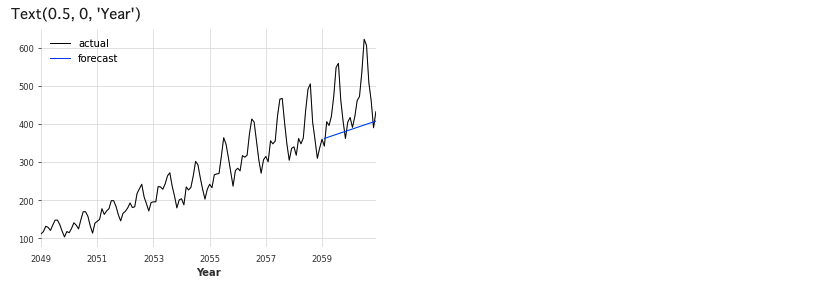
NaiveDrift
次は、NaiveDriftを使ってみます。
# NaiveDrift
from darts.models import NaiveDrift
# モデル生成
drift_model = NaiveDrift()
# 学習
drift_model.fit(train)
# 予測
drift_forecast = drift_model.predict(len(val))
# 可視化
series.plot(label='actual', lw=1)
drift_forecast.plot(label='forecast', lw=1)
plt.legend()
plt.xlabel('Year')
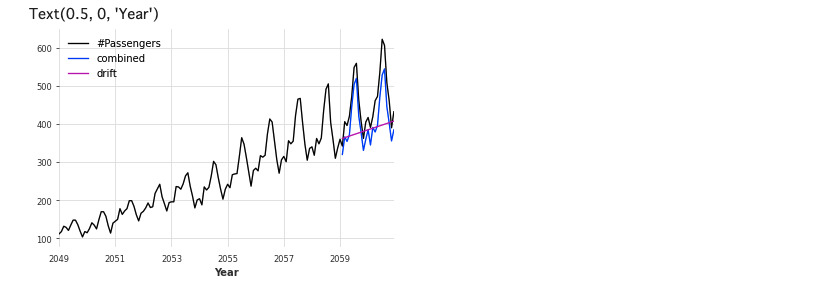
適切に予測できていないので、NaiveSeasonalとNaiveDriftを組み合わせたモデルを使ってみます。
combined_forecast = drift_forecast + seasonal_forecast - train.last_value()

series.plot()
combined_forecast.plot(label='combined')
drift_forecast.plot(label='drift')
plt.legend()
plt.xlabel('Year')
Prophet
次はFacebookが開発した時系列予測のオープンソースソフトウェア(OSS)ライブラリ「Prophet」です。詳細は割愛します。
# Prophet
from darts.models import Prophet
# モデル生成
model_P = Prophet()
# 学習
model_P.fit(train)
# 予測
prediction = model_P.predict(len(val))
# 可視化
series.plot(label='actual', lw=1)
prediction.plot(label='forecast', lw=1)
plt.legend()
plt.xlabel('Year')
Theta(シータ法)
次はHyndman & Billahの時系列予測手法「シータ法」です。
# Search for the best theta parameter, by trying 50 different values
# Theta
from darts.models import Theta
thetas = 2 - np.linspace(-10, 10, 50)

best_mape = float('inf')
best_theta = 0

for theta in thetas:
    model = Theta(theta)
    model.fit(train)
    pred_theta = model.predict(len(val))
    res = mape(val, pred_theta)

    if res < best_mape:
        best_mape = res
        best_theta = theta

# Theta
# モデル生成
best_theta_model = Theta(best_theta)
# 学習
best_theta_model.fit(train)
# 予測
pred_best_theta = best_theta_model.predict(len(val))
# 可視化
series.plot(label='actual', lw=1)
pred_best_theta.plot(label='forecast', lw=1)
plt.legend()
plt.xlabel('Year')
Transformer Model
2017年12月頃にGoogleチームにより発表され世間の注目を集めた、時系列データ処理に革新をもたらしたモデルです。
データの与え方を少し工夫する必要がありますが、これも簡単に使えます。
# Transformer Model
from darts.models import TransformerModel

# Normalize the time series
scaler = Scaler()
train_scaled = scaler.fit_transform(train)
val_scaled = scaler.transform(val)
series_scaled = scaler.transform(series)

N_EPOCHS = 1000
NR_EPOCHS_VALIDATION_PERIOD = 10

# Number of previous time stamps taken into account.
SEQ_LENGTH = 10
# number of output time-steps to predict
OUTPUT_LEN = 1
# Number of layers in encoder/decoder
NUM_LAYERS = 6

my_model = TransformerModel(
    batch_size = 32,
    input_length = SEQ_LENGTH,
    input_size = 1,
    output_length = OUTPUT_LEN,
    output_size = 1,
    n_epochs = N_EPOCHS,
    model_name = 'air_transformer',
    log_tensorboard=True,
    nr_epochs_val_period = NR_EPOCHS_VALIDATION_PERIOD,
    model = None,
    d_model = 64,
    nhead = 32,
    num_encoder_layers = 6,
    num_decoder_layers = 6,
    dim_feedforward = 2048,
    dropout = 0.1,
    activation = "relu",
    custom_encoder = None,
    custom_decoder = None,
    random_state=42,
)

my_model.fit(training_series=train_scaled, val_training_series=val_scaled, verbose=True)

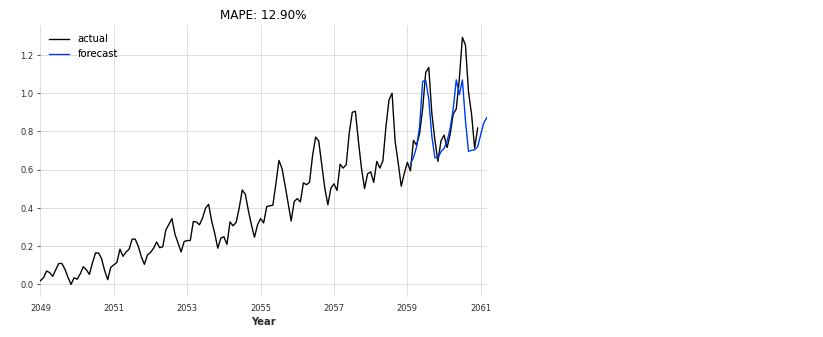
def eval_model(model, n, series, val_series):
    pred_series = model.predict(n=n)
    plt.figure(figsize=(8,5))
    series.plot(label='actual')
    pred_series.plot(label='forecast')
    plt.title('MAPE: {:.2f}%'.format(mape(pred_series, val_series)))
    plt.legend();

eval_model(my_model, 26, series_scaled, val_scaled)
LSTM
LSTM(long short-term memory:長短期記憶)とは、ニューラルネットワークの中間層の構造の一つで、自身の出力を、再帰的に入力するような構造を持ったものです。
# LSTM
# Number of previous time stamps taken into account.
SEQ_LENGTH = 12
# Number of features in last hidden state
HIDDEN_SIZE = 25
# number of output time-steps to predict
OUTPUT_LEN = 1
# Number of stacked rnn layers.
NUM_LAYERS = 1

LSTM_model = RNNModel(
    model='LSTM',
    output_length=OUTPUT_LEN,
    hidden_size=HIDDEN_SIZE,
    n_rnn_layers=NUM_LAYERS,
    input_length=SEQ_LENGTH,
    dropout=0.4,
    batch_size=16,
    n_epochs=400,
    optimizer_kwargs={'lr': 1e-3},
    model_name='Air_RNN',
    log_tensorboard=True,
    random_state=42
)

LSTM_model.fit(train_scaled, val_training_series=val_scaled, verbose=True)

eval_model(LSTM_model, 26, series_scaled, val_scaled)
bestLSTM_model = RNNModel.load_from_checkpoint(model_name='Air_RNN', best=True)
eval_model(bestLSTM_model, 26, series_scaled, val_scaled)
GRU
GRUは,LSTMの代替となる手法です。GRUのメリットは、LSTMと比較してパラメーター数が少ないので計算時間が抑えられるといった点があります。性能としてはLSTMと同程度らしいです。
# GRU
gru_model = RNNModel(
    model='GRU',
    output_length=OUTPUT_LEN*4,
    input_length=SEQ_LENGTH,
    hidden_size=HIDDEN_SIZE,
    n_rnn_layers=NUM_LAYERS,
    batch_size=64,
    n_epochs=1500,
    dropout=0.2,
    model_name='Air_GRU_out12',
    log_tensorboard=True,
    random_state=42
)

gru_model.fit(train_scaled, val_training_series=val_scaled, verbose=True)

eval_model(gru_model, 26, series_scaled, val_scaled)
さいごに
最後まで読んで頂き、ありがとうございました。
こんな便利なライブラリーがあるとは知りませんでした。PyCaretといい、世の中便利なライブラリーが多いですね。きちっと理論を理解し、自分でも実装できるようになる必要があるとは思いますが、製造現場で普及させるには簡単に使えることも重要かなと思っております。
訂正要望がありましたら、ご連絡頂けますと幸いです。

