はじめに
Databricks の Notebook から Azure Anomaly Detector の API を叩いて結果を可視化するところまでを行います。
連絡目次
- 導入/環境設定
- Collaborative Notebook でデータ可視化
- Anomaly Detector をデータ探索ツールとして使ってみる → 本稿
- 1つ目のモデル構築 (データの偏り 未考慮)
- 2つ目のモデル構築 (データの偏り 考慮)
Anomaly Detector とは
Anomaly Detector はマネージド型AIサービスとして提供されている Azure Cognitive Services の一つです。
- 時系列データセットから異常検出
- 教師なし学習
- 異常に対する感度を微調整可能
- APIでアプリケーションへ組み込み可能
- データ型や欠損値に対する制約がちょっと厳しい
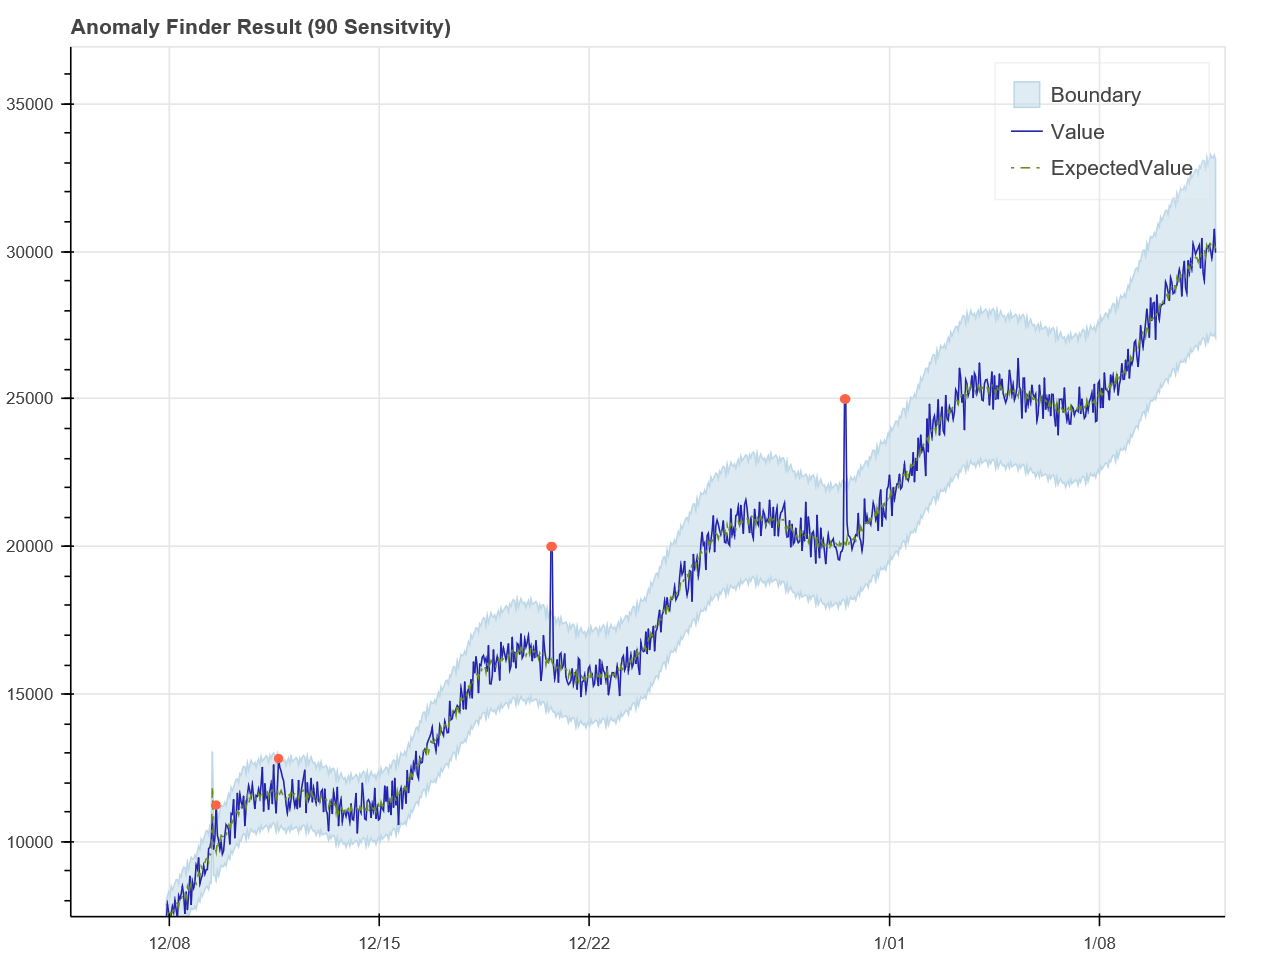
予測結果の可視化一例
X軸が時間、Y軸が数値。青の実線が投入したデータ。
解析の結果異常ではないと判定されたエリアが水色、異常値と判定されたデータは赤でプロットされている。
本連載の主題である異常検知モデルには利用していませんが、時系列データの特徴をさっと把握したいときに使えるかも、入力/出力ともにシンプルなので Detabricks の可視化機能と相性いいかも、ということで試してみました。
テストデータ生成
Anomaly Detector に投入する Body データは以下を満たす必要があります。
- UTC 形式のタイムスタンプ (カラム名 = timestamp)
- 数値 (異常検出対象。カラム名 = value)
今回は前記事で周期性を明確に見られた区間を抜粋し、 Step が前者、トランザクション数が後者になるようにデータを成型、テストデータとしました。
# step から時系列のカラム作成 1/6-17 のみ抜粋。タイプはTRANSFER
query1 = '''
SELECT
  CONCAT('2020-01-', LPAD(ceil(step / 24), 2, '0'), ' ', LPAD((step - 1) % 24, 2, '0'), ':00:00') as date_time_str
  , count(1) as value
FROM
  financial
WHERE
  type='TRANSFER' AND step < 409 AND step > 120
GROUP BY step
ORDER BY step
'''

agged_df = spark.sql(query1)
agged_df.createOrReplaceTempView("agged_view")

# タイムスタンプ作成
query2 = '''
SELECT
  CAST(date_time_str as timestamp) as timestamp
  , value
FROM
  agged_view
'''

agged_df2 = spark.sql(query2)
agged_df2.createOrReplaceTempView("agged_view2")

# リクエスト用データフレーム作成
agged_pd = agged_df2.select("*").toPandas()
agged_pd.loc[:, ["timestamp"]] = agged_pd["timestamp"].dt.strftime("%Y-%m-%dT%H:%M:%SZ")
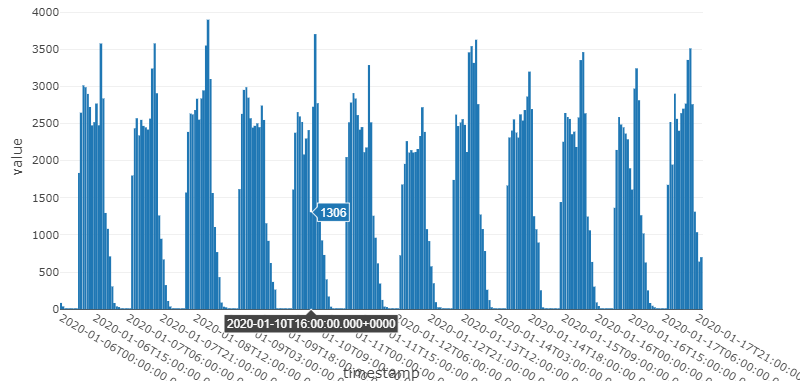
テストデータを棒グラフにしてみます。数値の吹き出しがある箇所でトランザクションの少ないことはすぐ分かりますが、他にも特筆すべきポイントがあるかもしれません。
SELECT * FROM agged_view2
環境変数設定
まず Anomaly Detector のリソースを作成します。 (こちらの記事が参考になります)
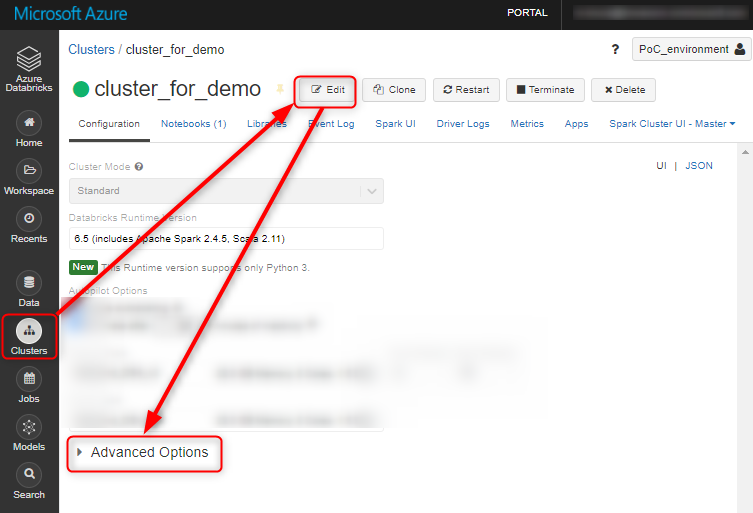
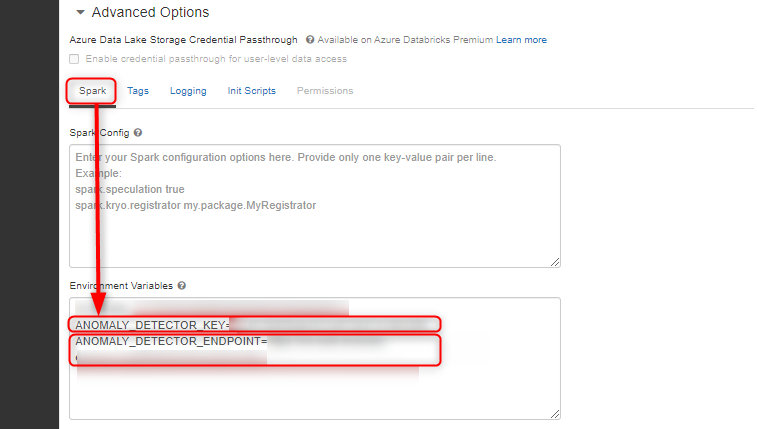
エンドポイント URL と API Key を取得したら、クラスタの環境変数に追加しておきます。(Notebook に平打ちするのはセキュリティ上よろしくない)
関数定義
パラメータや実行関数を定義します。
import pandas as pd
import json
import requests

url = "/anomalydetector/v1.0/timeseries/entire/detect"
endpoint = os.environ["ANOMALY_DETECTOR_ENDPOINT"]
subscription_key = os.environ["ANOMALY_DETECTOR_KEY"]

# 作成したデータフレームを json に変換
series = json.loads(agged_pd.to_json(orient="records"))

# 時系列データの粒度と異常値の感度を Bodyに入れる
body = {
  "series": series
  ,"granularity": "hourly"
  , "sensitivity": 50
}

def send_request(endpoint, url, subscription_key, request_data):
    headers = {'Content-Type': 'application/json', 'Ocp-Apim-Subscription-Key': subscription_key}
    response = requests.post(endpoint+url, data=json.dumps(request_data), headers=headers)
    return json.loads(response.content.decode("utf-8"))

def detect_batch(request_data):
    print("Detecting anomalies as a batch")
    # リクエスト送信、返り値を出力
    result = send_request(endpoint, url, subscription_key, request_data)
    print(json.dumps(result, indent=4))
    return result

    if result.get('code') is not None:
        print("Detection failed. ErrorCode:{}, ErrorMessage:{}".format(result['code'], result['message']))
    else:
        # データセット内の異常値を表示
        anomalies = result["isAnomaly"]
        print("Anomalies detected in the following data positions:")

        for x in range(len(anomalies)):
            if anomalies[x]:
                print (x, request_data['series'][x]['value'])
実行・結果可視化
API にデータを投げ、元のデータフレームと結合します。
results = detect_batch(body)
mgd_df = pd.concat([agged_pd, pd.DataFrame(results)], axis=1)
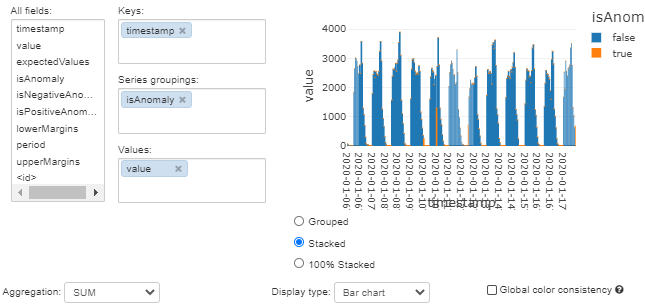
isAnomaly (予測結果。1=異常、0=通常) に絞ってグラフ化します。吹き出しの出ている箇所は目視では気が付きませんでしたが、確かに別の日の同じ時間に比べるとトランザクション数が低いように思われます。
display(mgd_df)
まとめ
私たちはグラフにするとなんとなく分かったような気になってしまう傾向があります。Anonaly Detector は先入観なしに時系列データを見てみたい時に便利かもしれませんね。次回は実際に決定木を用いてモデルを構築します。お楽しみに!
参考リンク
Anomaly Detector 公式トップページ
Anomaly Detector API の使用に関するベスト プラクティス
Cognitive Service: Anomaly Detector APIを試す
クイック スタート:Anomaly Detector REST API および Python を使用し、時系列データ内の異常を検出する
