pythonでmatplotlibを使った画像保存について
解決したいこと
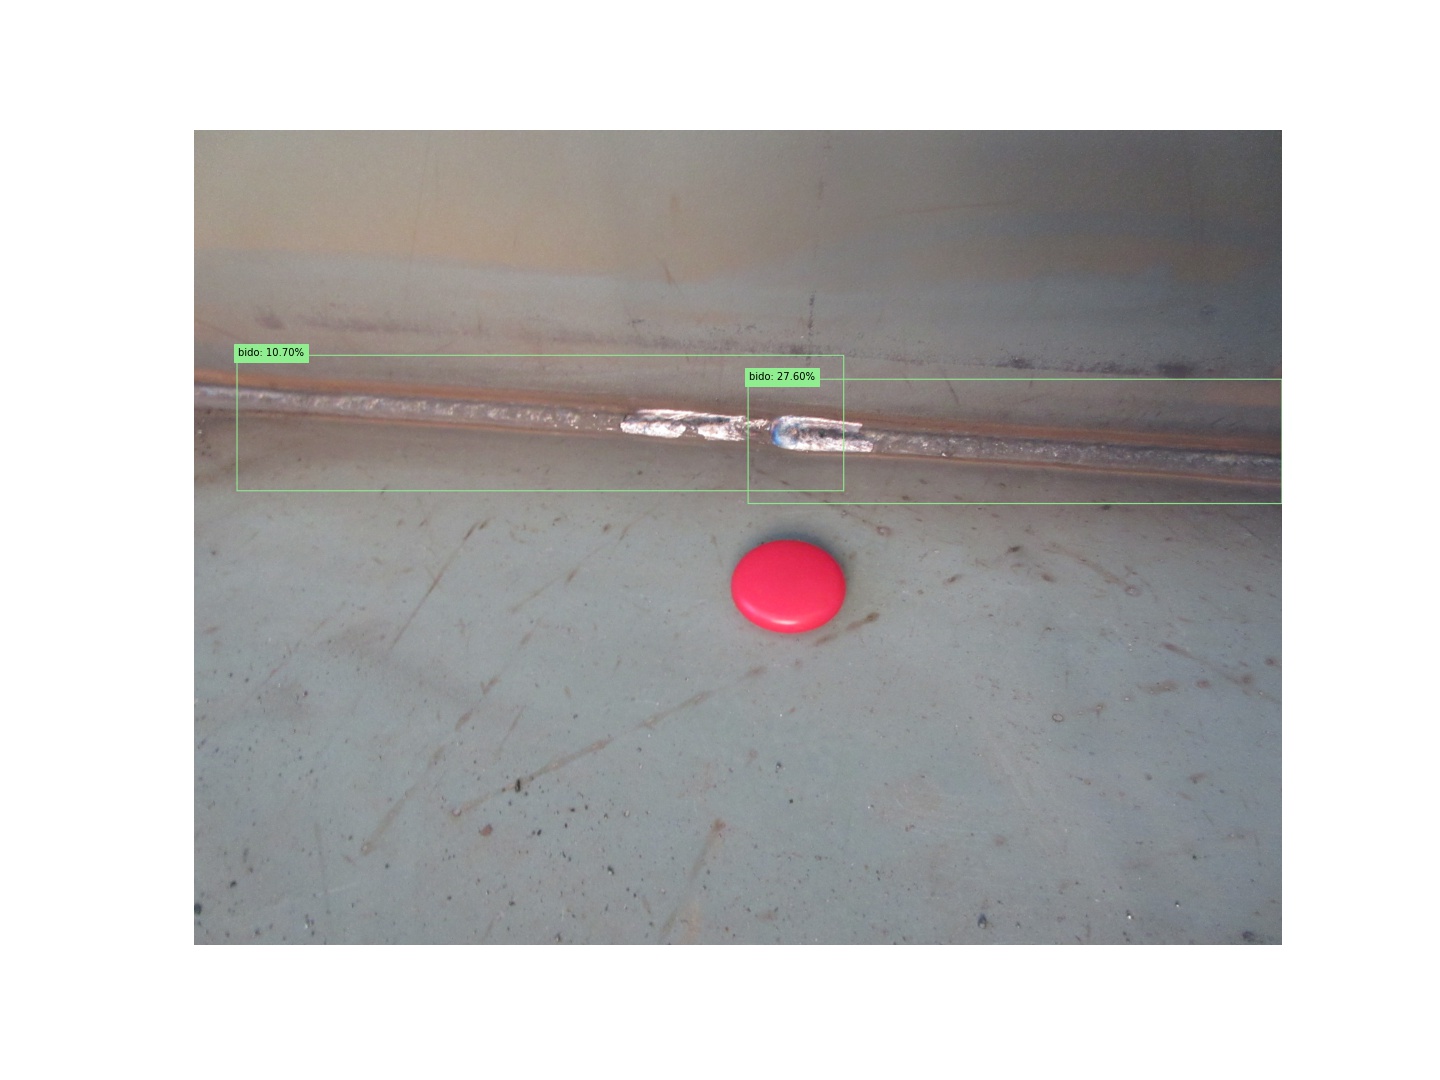
azureを使って検出した結果をmatplotlibを用いて描画し画像として保存しました。保存や描画はうまくできたのですが保存した画像が以下の通り余白がでてしまいました。余白の無い状態で保存する、もしくは余白を消したいのですがどうすればよいでしょうか。できたら余白無しで保存できる方法を教えていただきたいです。
該当するソースコード
project_id = 'project ID'
cv_key = 'key'
cv_endpoint = 'URL'

model_name = 'Iteration2'
print('Ready to predict using model {} in project {}'.format(model_name, project_id))

from azure.cognitiveservices.vision.customvision.prediction import CustomVisionPredictionClient
from msrest.authentication import ApiKeyCredentials
from matplotlib import pyplot as plt
from PIL import Image, ImageDraw, ImageFont
import numpy as np
import os
import cv2
%matplotlib inline
os.chdir("C:\\suzuki")

# Load a test image and get its dimensions
test_img_file = os.path.join('C:\\', 'CRT_NG', 'CRT_NG_03_003.JPG')
test_img = Image.open(test_img_file)
test_img_h, test_img_w, test_img_ch = np.array(test_img).shape

# Get a prediction client for the object detection model
credentials = ApiKeyCredentials(in_headers={"Prediction-key": cv_key})
predictor = CustomVisionPredictionClient(endpoint=cv_endpoint, credentials=credentials)

print('Detecting objects in {} using model {} in project {}...'.format(test_img_file, model_name, project_id))

# Detect objects in the test image
with open(test_img_file, mode="rb") as test_data:
    results = predictor.detect_image(project_id, model_name, test_data)

# Create a figure to display the results
fig = plt.figure(figsize=(20, 15))
plt.axis('off')

# Display the image with boxes around each detected object
draw = ImageDraw.Draw(test_img)
lineWidth = int(np.array(test_img).shape[1]/1000)
object_colors = {"bido": "lightgreen",}

for prediction in results.predictions:
    color = 'white' # default for 'other' object tags
    if (prediction.probability*100) > 10:
        if prediction.tag_name in object_colors:
            color = object_colors[prediction.tag_name]
        left = prediction.bounding_box.left * test_img_w
        top =  prediction.bounding_box.top * test_img_h
        height =  prediction.bounding_box.height * test_img_h
        width =  prediction.bounding_box.width * test_img_w
        points = ((left,top), (left+width,top), (left+width,top+height), (left,top+height),(left,top))
        draw.line(points, fill=color, width=lineWidth)
        plt.annotate(prediction.tag_name + ": {0:.2f}%".format(prediction.probability * 100),(left,top), backgroundcolor=color)
plt.imshow(test_img)
plt.savefig("test.jpg")
print(test_img_h)
0 likes
