今回の目標
前回、評価値について調べると書きましたが、その前に乱数によって有利不利が生まれるかどうかについて調べたいと思います。
ここから本編
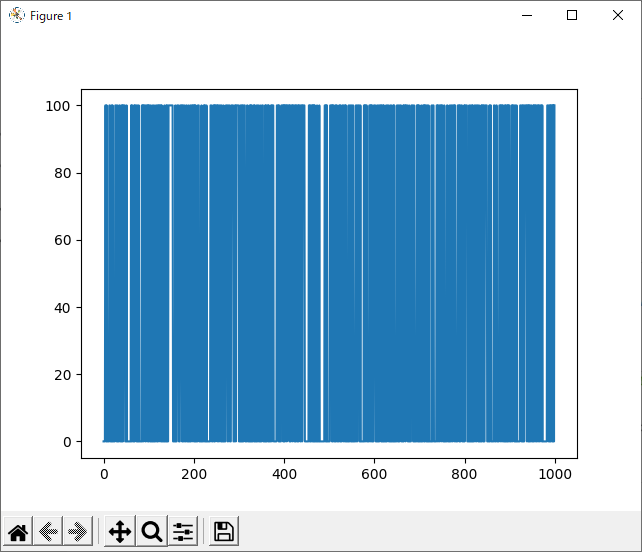
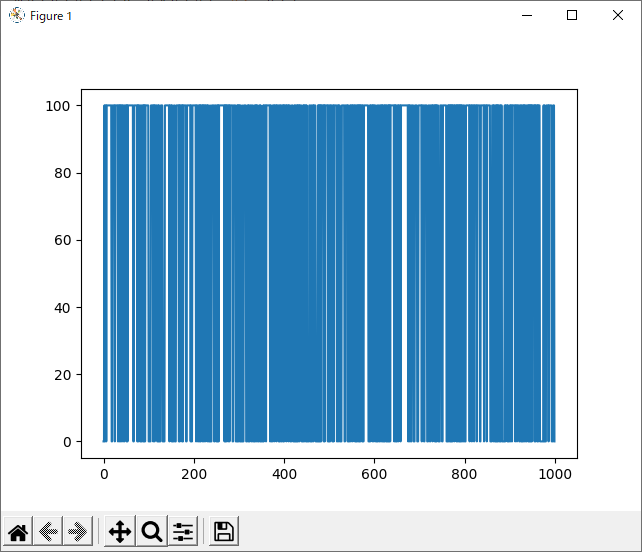
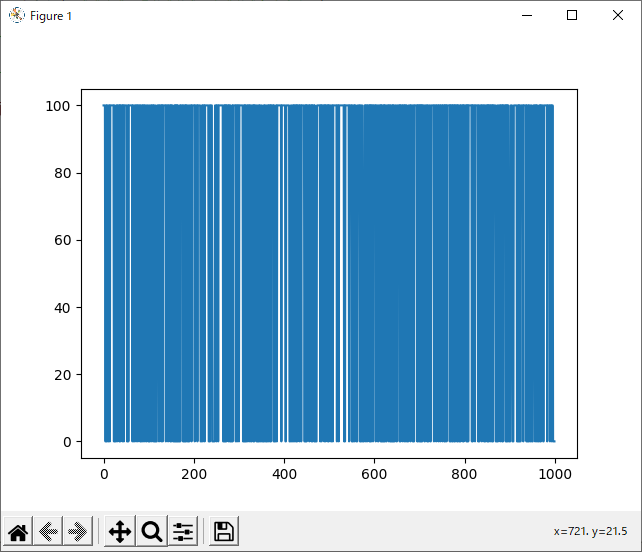
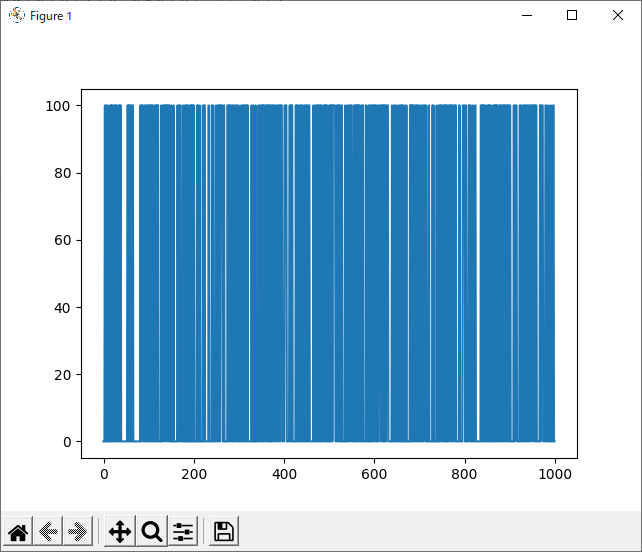
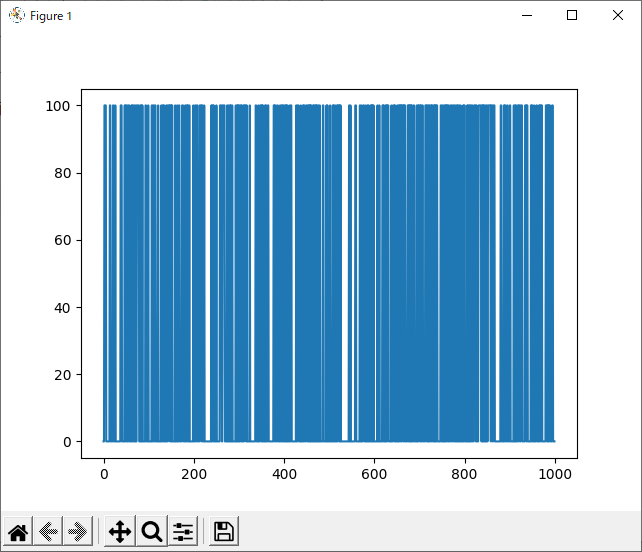
今回、srand関数の引数を0~999まで変化させ、それぞれで100試合ずつランダム同士の対戦を行い、それぞれの勝率を調べました。
ここで勝率とは、黒側が買った回数をいうこととします。引き分けあるいは白が勝った数はカウントしません。
実行ファイル
ヘッダファイルとソースファイルは今までと全く同じです。
オブジェクト指向便利。
やっていることとしては、上述したことがすべてなので追加説明はありません。
# include "osero_genetic.h"

const int child = 100;
const int entire = 1000;

int main(void){
    int win, win_sum;
    int i, j;
    osero_genetic * run;
    FILE * fp = fopen("data_rand_rand.csv", "w");

    fprintf(fp, "srand_num,win_per\n");

    for (i = 0; i < entire; i++){
        win_sum = 0;

        for (j = 0; j < child; j++){
            run = new osero_genetic(
                INT(PLAY_WAY::random),
                INT(PLAY_WAY::random)
            );
            run -> mode = 1;
            run -> player = 1, run -> computer = 0;
            run -> srand_num = i;
            win = INT(run -> play());

            if (win) win_sum++;
            delete run;
        }

        fprintf(fp, "%d,%d\n", i, win_sum);
    }

    fclose(fp);

    return 0;
}
実行結果
run_1hand_rand
続いて、1hand VS randomで試合を行いました。
評価値はすべて1で試してみました。
run_2hand_rand
さらに2hand VS randomで試合を行いました。
こちらも、評価値はすべて1で試してみました。
run_rand_1hand
run_rand_2hand
結局、どれが最適なのか
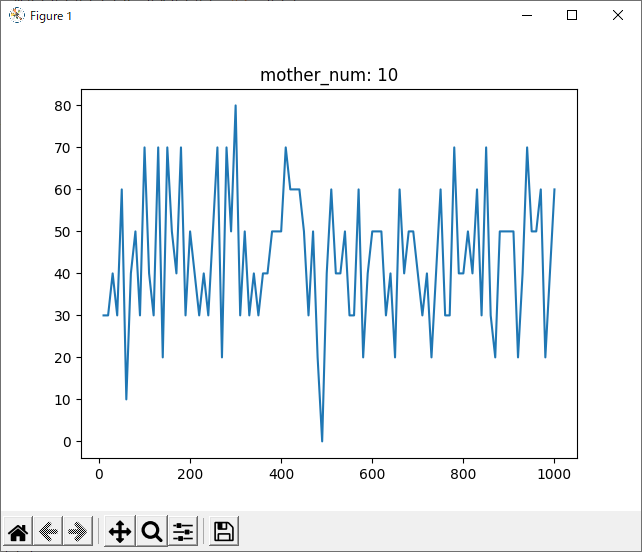
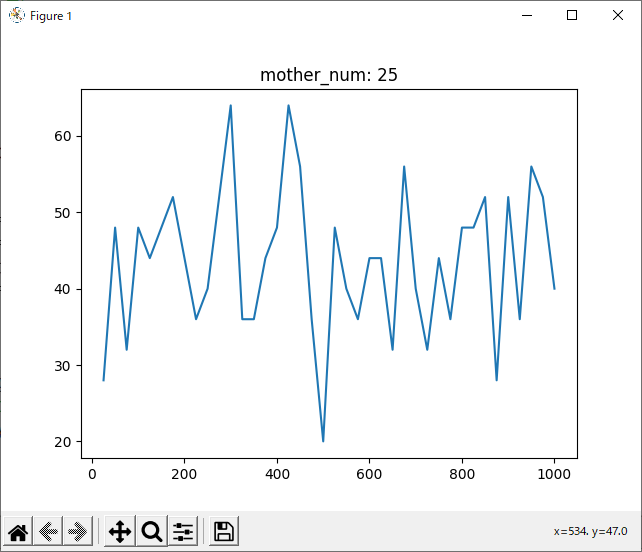
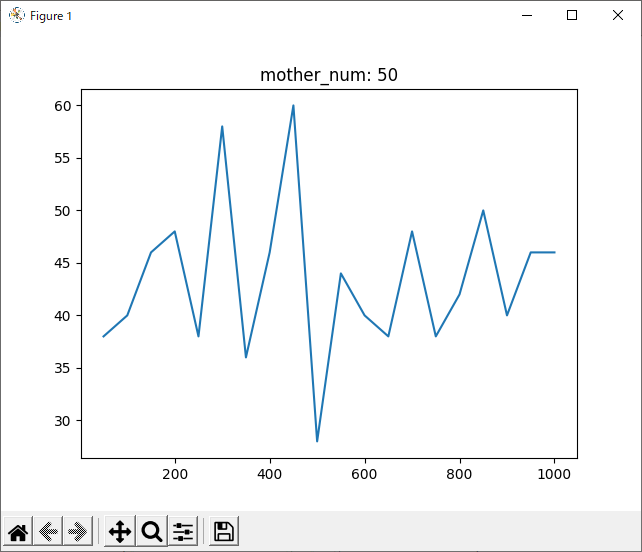
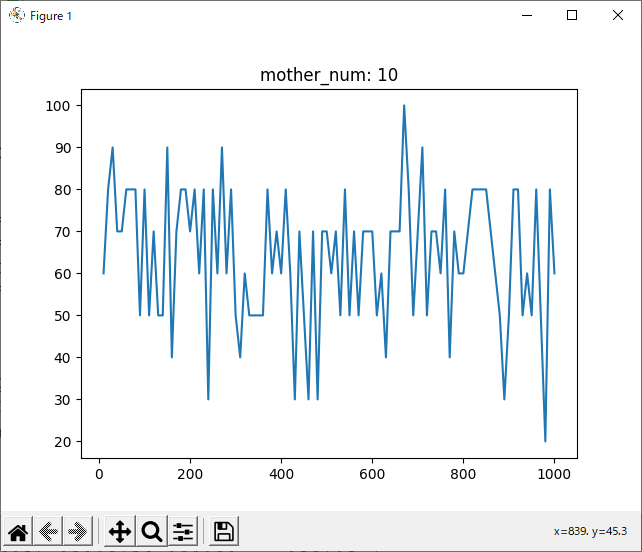
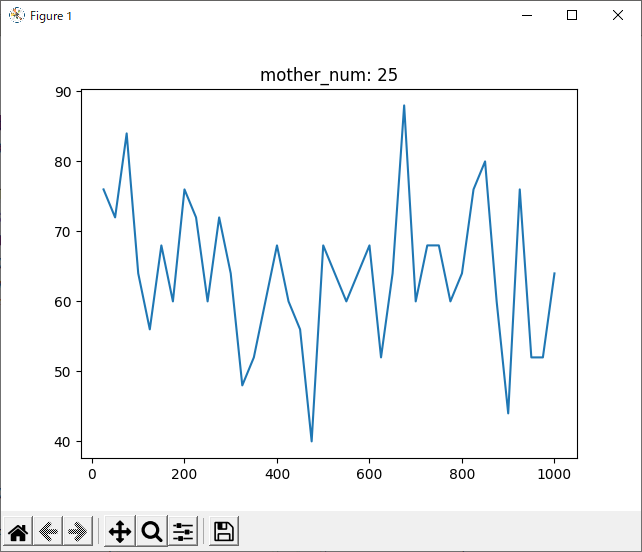
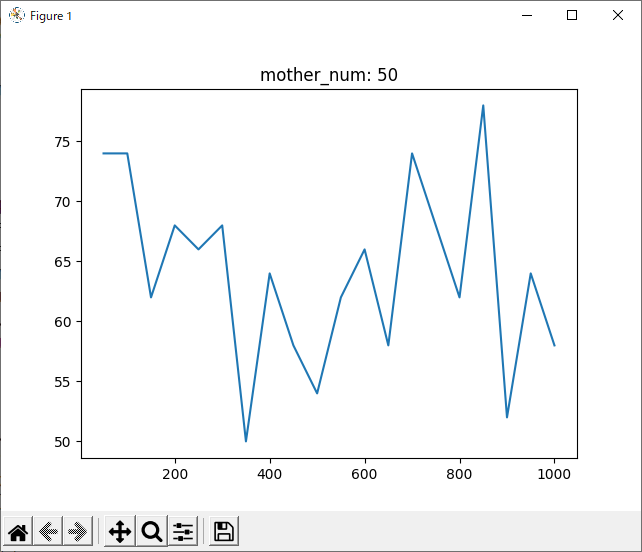
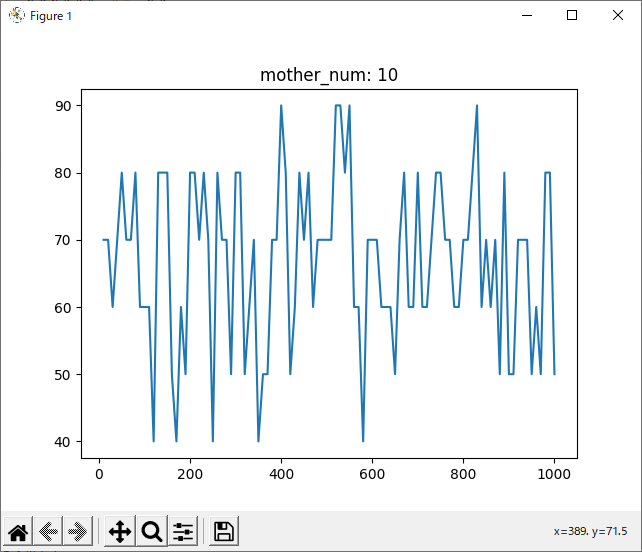
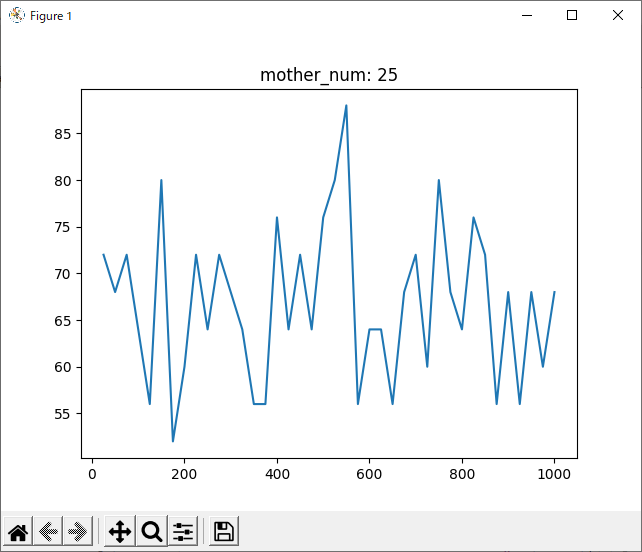
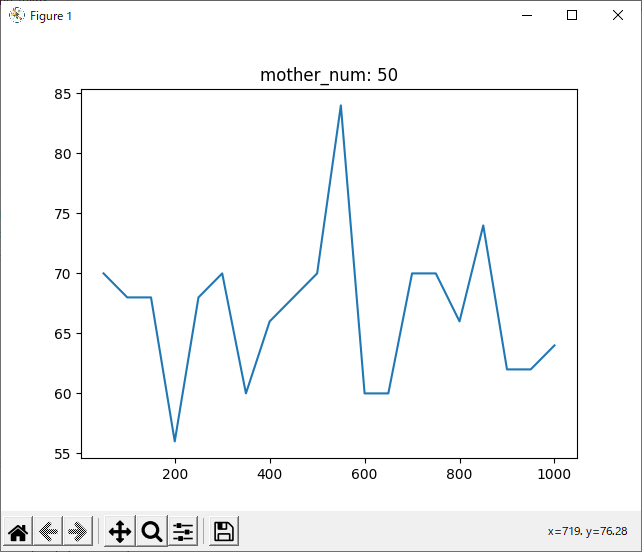
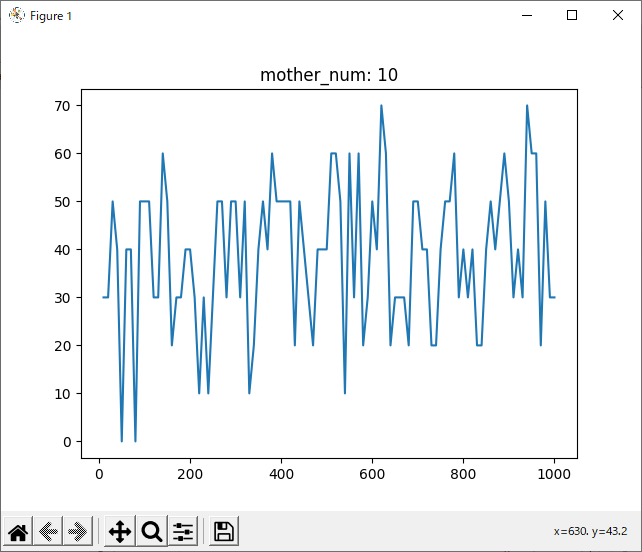
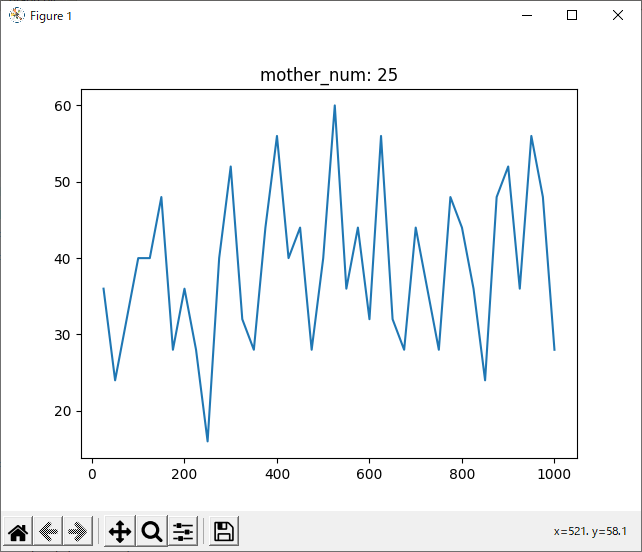
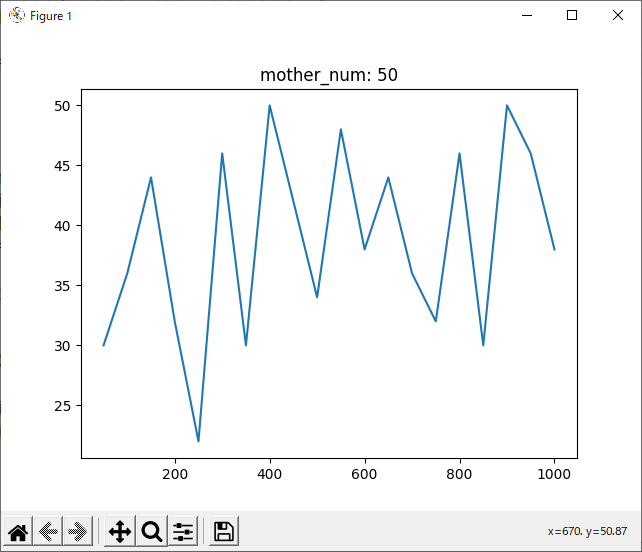
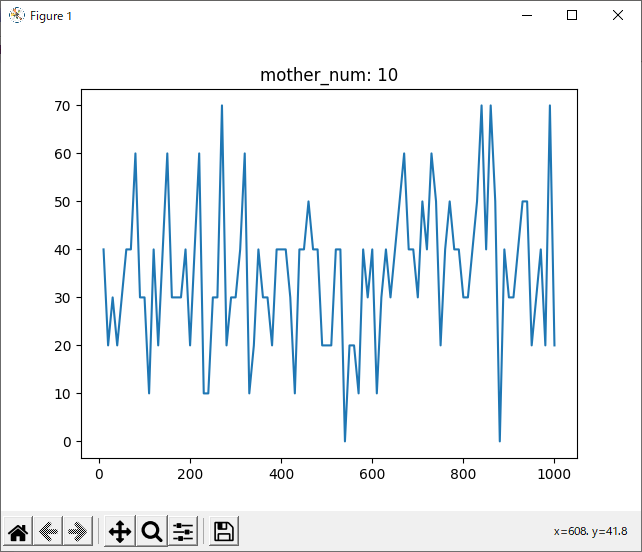
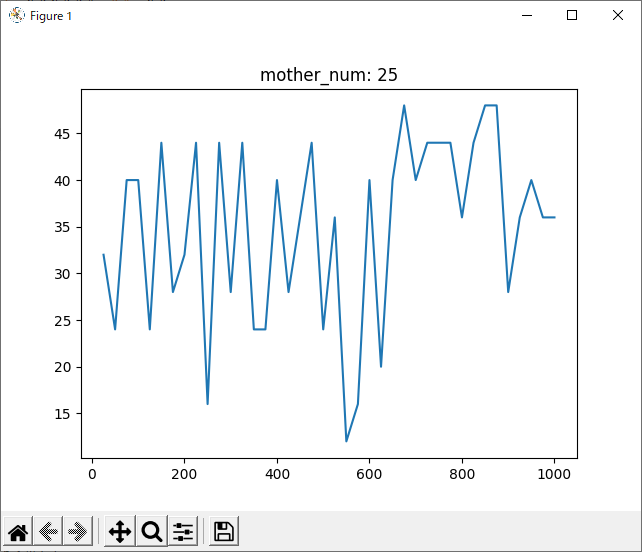
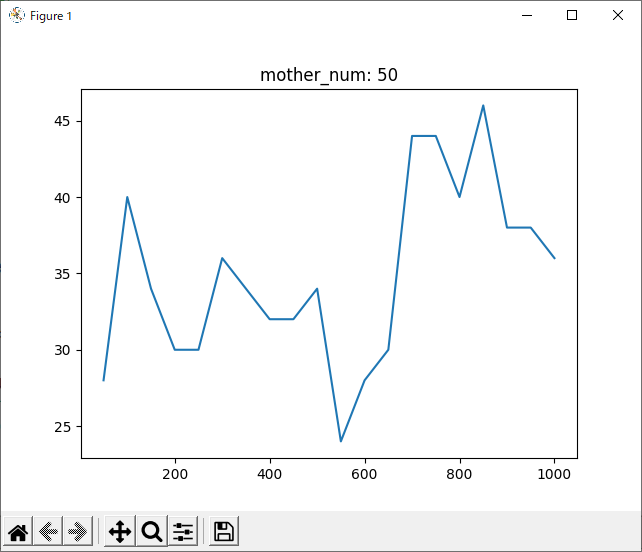
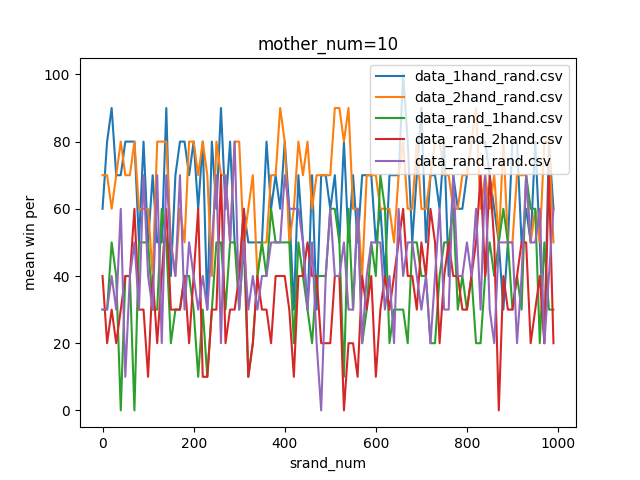
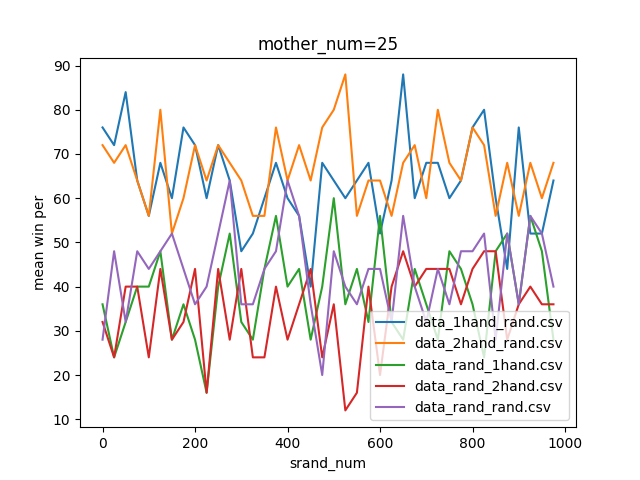
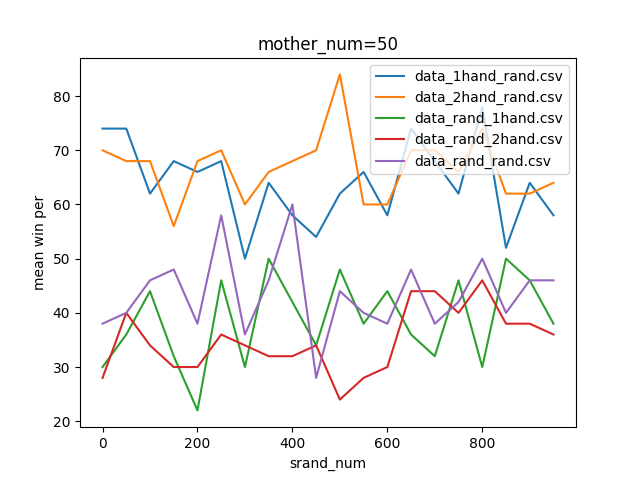
結果を見ると、どの試合も600付近で勝率が下がっているように見えます。しかしほとんどのグラフが波打っており、人間の目でははっきりと「これが最適!」とは言えません。
ということでまず、以下のプログラムを用いてすべてのデータをまとめてみました。
やっていることとしては、上の、それぞれの思考方法ごとに作ったmother_numを用いたグラフを一つにまとめているだけです。
import pandas as pd
import glob
import matplotlib.pyplot as plt
import numpy as np

pd.set_option("display.max_columns", 6)

########  all data ########

i = 0

for filename in glob.glob("data*.csv"):
    win_per = filename + "_win_per"
    if i == 0:
        df = pd.read_csv(filename)
        df.columns = ["srand_num", win_per]
        i = 1
    else:
        df_ele = pd.read_csv(filename)
        df_ele.columns = ["srand_num", win_per]
        df.loc[:, win_per] = df_ele[win_per]

df.to_csv("csvdata.csv")

########  part data  ########

mother_num = 10
df_custom = []
for_num = int((max(df["srand_num"]) + 1) / mother_num)
srand_num = []
mean = []

data = open("data/data.txt", "w")

for i in range(for_num):
    # get data
    num = i * mother_num
    df_custom.append(df[num:num + mother_num])

    # plot data
    srand_num.append(num)
    mean_ele = df_custom[i].mean()
    mean.append(list(mean_ele[1:]))

    # statistics data
#     df.to_csv("data/%4d_%4d.csv" % (num, num + mother_num))
    data.write("%4d_%4d:\n" % (num, num + mother_num))
    data.write(str(df_custom[i].describe()) + "\n\n")

data.close()

# plot

mean = np.array(mean)
mean = mean.T
fig = plt.figure()
i = 0
for filename in glob.glob("data*.csv"):
    plt.plot(srand_num, mean[i], label=filename)
    i += 1
plt.legend()
plt.title("mother_num=%d" % mother_num)
plt.xlabel("srand_num")
plt.ylabel("mean win per")
# plt.show()
plt.savefig("data/fig%d" % mother_num)
plt.clf()
plt.close()
結果がこちら。
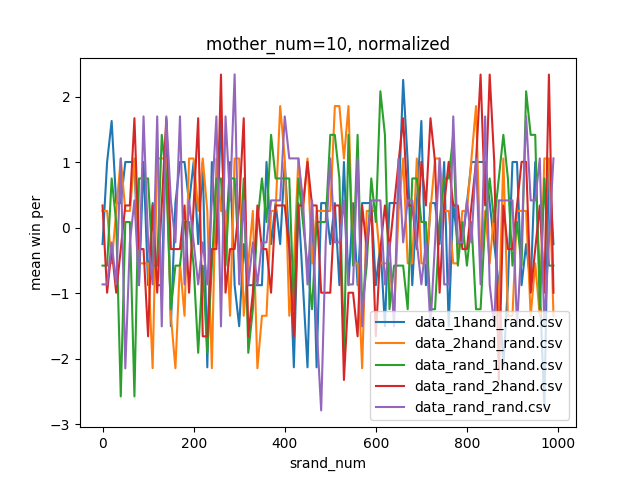
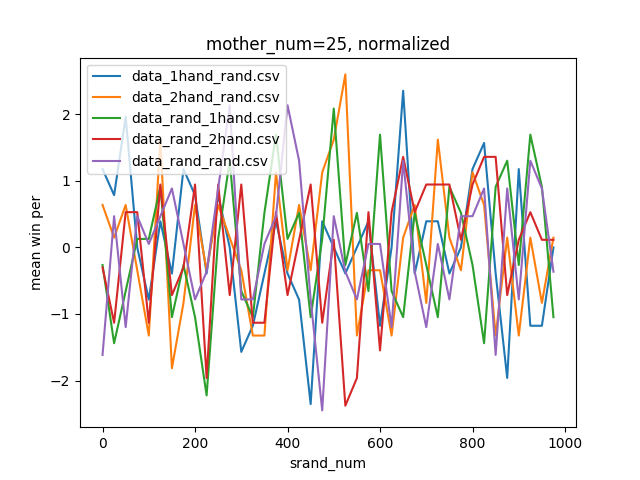
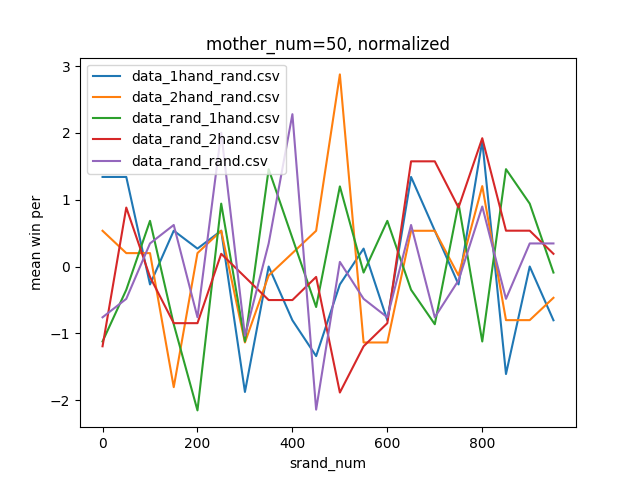
やっぱりよく分からないので、以下のプログラムを追加し各手法ごとに正規化したグラフを作ってみました。なお正規化のプログラムはこちらの記事の丸写しです。
# normalized plot

fig = plt.figure()
i = 0
for filename in glob.glob("data*.csv"):
    arr_mean = mean[i].mean()
    arr_std = np.std(mean[i])
    mean[i] = (mean[i] - arr_mean) / arr_std
    plt.plot(srand_num, mean[i], label=filename)
    i += 1
plt.legend()
plt.title("mother_num=%d, normalized" % mother_num)
plt.xlabel("srand_num")
plt.ylabel("mean win per")
# plt.show()
plt.savefig("data/fig%d, normalized" % mother_num)
plt.clf()
plt.close()
結果はこちら。
判断が難しいですが、mother_num=50, normalizedのグラフでもっとも0に近い値の多かった90~100がsrand関数の引数として最適だと思われます。
なお、本題ではないですが、データをよく見たらその勝利数は100か0かでした。よく考えれば、srand関数に与える引数が一定ですから当然のことです。今更ですがchild変数は1でもよかったですね。
フルバージョン
rand_test内にあります。
次回は
まさか乱数だけで一つの記事が書けてしまうとは思いませんでした。
次回は前回も書いた通り、前回求めた評価値の正しさについて検証したいと思います。
その後学習方法の改善を行います。
正しい評価値が算出されれば下積み編は終了し、機械学習にリベンジしたいと思います。
