「ゼロから作るDeep Learning」(斎藤 康毅 著 オライリー・ジャパン刊)を読んでいる時に、参照したサイト等をメモしていきます。 その18 ← → その19の2 → その20
犬猫判定はそこそこできるようになりましたが、正解率が90%に満たないまま、というのもナンだかなあ、という感じなので、本のP245に書いてある Data Augmentation をやってみようかと思います。
Data Augmentation
データの拡張で簡単にできそうなのが
反転
回転
移動
あたりでしょうか。
で、GradCAMで見た感じ、猫は背中を丸めた姿勢に反応、犬は鼻に反応しているようです。
ということは、
猫の画像を回転、反転したものを追加すれば、猫の識別精度があがるのではないか?
犬の画像の顔のあたりを拡大したら、犬の識別精度があがるのではないか?
なんてことが考えられます。
そこで、拡張データを追加すると、どう学習を強化するのか、検証してみたいと思います。
まず、訓練データとテストデータを作り直します
ここまで使っていたデータは、プログラムの動作を確認できればいいからと、相当いいかげんに作っています。テストデータ件数も100件だけしかありません。→自習メモ6の2
テストデータをランダムに1000件くらいはとっておきたい。
残りの訓練データについては、犬と猫の画像をマージしたあと、ランダムに並べ直す。
拡張データは、犬猫加工方法ごとに別に分けておき、学習の際に訓練データにマージして使い、効果を検証できるようにする。
検証では、全体の正解率だけでなく、犬の正解率、猫の正解率も検証する。
さらに、不正解の画像についてGradCAMでどこの特徴に反応しているかを確認する。
というような方針で、訓練データを作り直しました。
def rnd_list(motoarray, toridasi):
  # 0~元のnp配列のデータ件数までの整数リストを作成し
  # ランダムに並べ替えてから、
  # 指定した件数の整数のリストと残りの整数リストを返す
  import random
  import numpy as np

  kensuu , tate, yoko, channel = motoarray.shape
  moto = list(range(0, kensuu))
  random.shuffle(moto)
  sel = moto[0:toridasi]
  nokori=moto[toridasi:]
  return sel, nokori

def bunkatu(motoarray, toridasi, lblA):
  # np配列のデータを
  # 指定した件数のリストと残りのリストに
  # 分割する
  sel, nokori = rnd_list(motoarray, toridasi)

  tsl = []
  tsi = []
  trl = []
  tri = []
  for i in sel:
    imgA = dogimg[i]
    tsl.append(lblA)
    tsi.append(imgA)

  for i in nokori:
    imgA = dogimg[i]
    trl.append(lblA)
    tri.append(imgA)
  return tsl, tsi, trl, tri

def rnd_arry(tri, trl):
  # 画像の配列とラベルの配列を
  # ランダムに並べ替えた
  # リストにして返す
  sel, nokori = rnd_list(tri, 0)
  wtri = []
  wtrl = []
  for i in nokori:
    imgA = tri[i]
    lblA = trl[i]
    wtri.append(imgA)
    wtrl.append(lblA)
  return wtri, wtrl

# 訓練用とテスト用に分割し、犬と猫を統合する
bunkatusuu = 500
ctsl, ctsi, ctrl, ctri = bunkatu(catimg, bunkatusuu, 0)
dtsl, dtsi, dtrl, dtri = bunkatu(dogimg, bunkatusuu, 1)

tri=np.append(ctri, dtri, axis=0)
trl=np.append(ctrl, dtrl, axis=0)
tsi=np.append(ctsi, dtsi, axis=0)
tsl=np.append(ctsl, dtsl, axis=0)

# ランダムに並べ替えて
wtri, wtrl = rnd_arry(tri, trl)
wtsi, wtsl = rnd_arry(tsi, tsl)

# 保存する

dataset = {}
dataset['test_label']  = np.array(wtsl, dtype=np.uint8)
dataset['test_img']    = np.array(wtsi, dtype=np.uint8)
dataset['train_label'] = np.array(wtrl, dtype=np.uint8)
dataset['train_img']   = np.array(wtri, dtype=np.uint8)

import pickle

save_file = '/content/drive/My Drive/Colab Notebooks/deep_learning/dataset/catdog.pkl'
with open(save_file, 'wb') as f:
    pickle.dump(dataset, f, -1)
訓練データ23994件(犬11997、猫11997)、テストデータ1000件(犬500、猫500)
ができました。
これを入力にして、その18で作ったDeepConvNetで処理すると
Epoch 1/10
188/188 [==============================] - 373s 2s/step - loss: 0.7213 - accuracy: 0.5663
Epoch 2/10
188/188 [==============================] - 373s 2s/step - loss: 0.6378 - accuracy: 0.6290
Epoch 3/10
188/188 [==============================] - 373s 2s/step - loss: 0.5898 - accuracy: 0.6713
Epoch 4/10
188/188 [==============================] - 374s 2s/step - loss: 0.5682 - accuracy: 0.6904
Epoch 5/10
188/188 [==============================] - 373s 2s/step - loss: 0.5269 - accuracy: 0.7128
Epoch 6/10
188/188 [==============================] - 374s 2s/step - loss: 0.4972 - accuracy: 0.7300
Epoch 7/10
188/188 [==============================] - 372s 2s/step - loss: 0.4713 - accuracy: 0.7473
Epoch 8/10
188/188 [==============================] - 374s 2s/step - loss: 0.4446 - accuracy: 0.7617
Epoch 9/10
188/188 [==============================] - 373s 2s/step - loss: 0.4318 - accuracy: 0.7665
Epoch 10/10
188/188 [==============================] - 376s 2s/step - loss: 0.4149 - accuracy: 0.7755
32/32 - 4s - loss: 0.3811 - accuracy: 0.8420
正解率84.2% という結果に。
結果の内容を検証してみます
predictions = model.predict(x_test)

# 誤判定分の添え字をリストにする

gohantei = []
kensuu, w = predictions.shape
for i in range(kensuu):
  predictions_array = predictions[i]
  predicted_label = np.argmax(predictions_array)
  true_label = t_test[i]
  if predicted_label != true_label:
    gohantei.append(i)

print(len(gohantei))
158
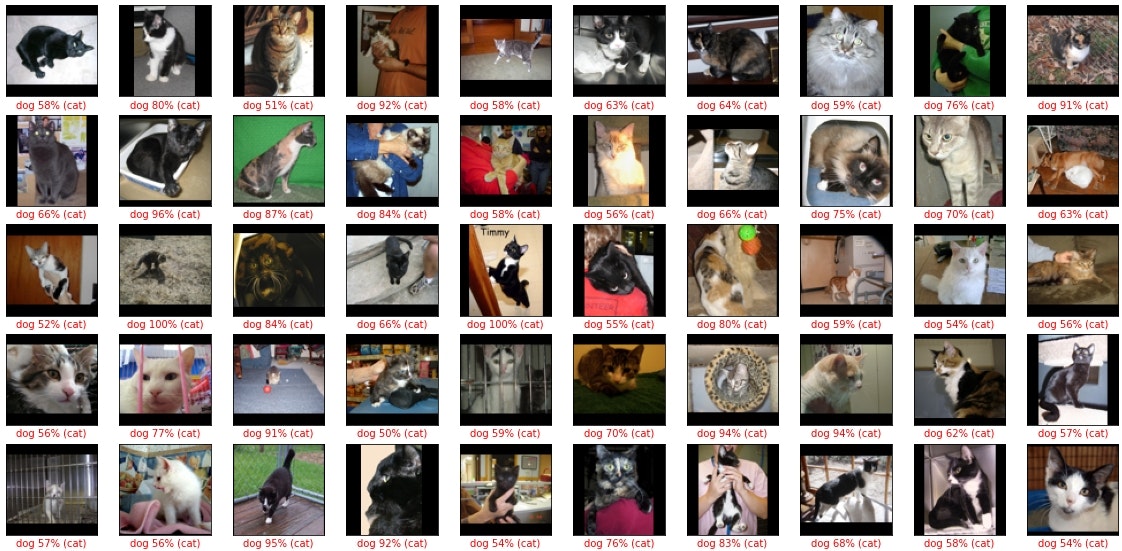
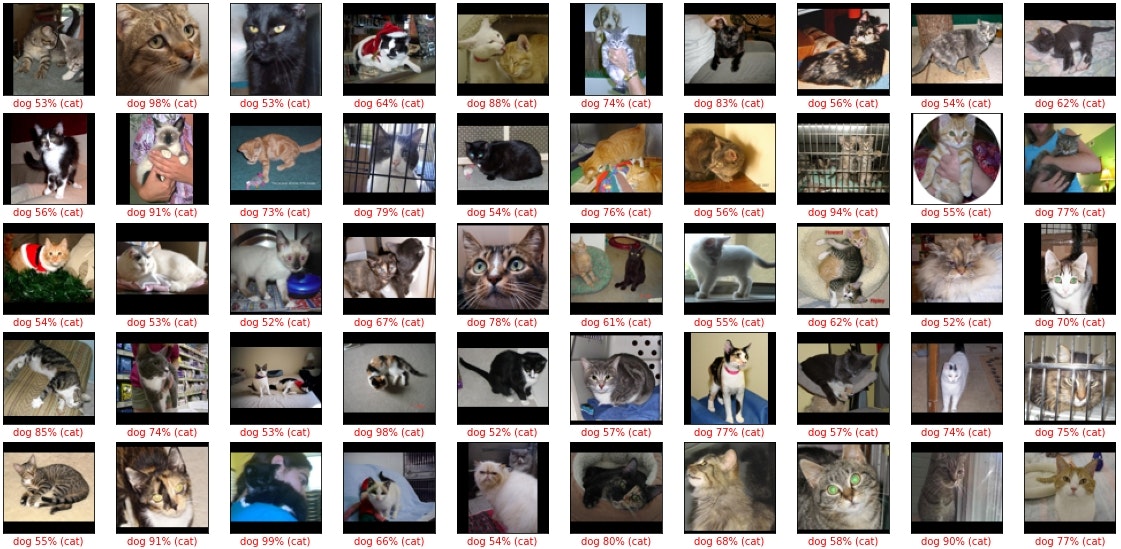
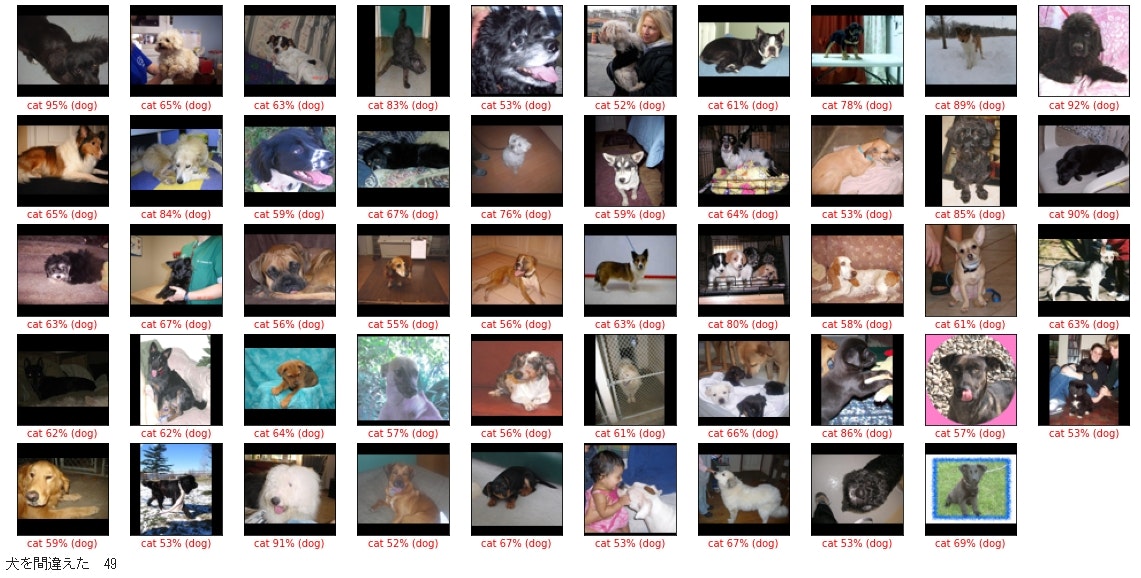
158件の誤判定がありました。
def plot_image(i, predictions, t_label, img):
    class_names = ['cat', 'dog']
    predictions_array = predictions[i]
    img = img[i].reshape((80, 80, 3))
    true_label = t_label[i]
    plt.grid(False)
    plt.xticks([])
    plt.yticks([])

    plt.imshow(img, cmap=plt.cm.binary)

    predicted_label = np.argmax(predictions_array)
    if predicted_label == true_label:
        color = 'blue'
    else:
        color = 'red'

    plt.xlabel("{} {:2.0f}% ({})".format(class_names[predicted_label],
                                    100*np.max(predictions_array),
                                    class_names[true_label]),
                                    color=color)

num_cols = 10
num_rows = int(len(gohantei) / num_cols ) + 1

plt.figure(figsize=(2*num_cols, 2.5*num_rows))
j = 0
for i in gohantei:
  inuneko = t_test[i]
  if inuneko == 0:
    plt.subplot(num_rows, num_cols, j+1)
    plot_image(i, predictions, t_test, x_test)
    j +=1
plt.show()
print("猫を間違えた ",j)

plt.figure(figsize=(2*num_cols, 2.5*num_rows))
j = 0
for i in gohantei:
  inuneko = t_test[i]
  if inuneko == 1:
    plt.subplot(num_rows, num_cols, j+1)
    plot_image(i, predictions, t_test, x_test)
    j +=1
plt.show()
print("犬を間違えた ",j)
誤判定の内訳は 猫109件 犬49件 でした。
猫が犬の倍以上誤判定になっています。
(追記)
正解率 = (猫を猫と判定した件数+犬を犬と判定)/全件数 = (391 + 451)/1000 = 84.2%
猫の適合率 = 猫を猫と判定/(猫を猫と判定+犬を猫と判定) = 391/(391 + 49) = 88.9%
猫の再現率 = 猫を猫と判定/実際の猫の件数 = 391/500 = 78.2%
犬の適合率 = 犬を犬と判定/(犬を犬と判定+猫を犬と判定) = 451/(451 + 109) = 80.5%
犬の再現率 = 犬を犬と判定/実際の犬の件数 = 451/500 = 90.2%
猫を犬と誤判定した件数が多いせいで、猫の再現率と犬の適合率が低くなっている。
そもそも、拡張データを追加することで学習が強化されるのか?
猫のデータを拡張して追加することで、猫の誤判定が減るかを確認してみます。
# 猫画像のみ取り出す
catdatalist = []
kensuu = len(dataset['train_img'])
for i in range(kensuu):
  label = dataset['train_label'][i]
  if label == 0:
    catdatalist.append(i)
print(len(catdatalist))
11997
# 猫の左右反転画像データセットを作成する
trl = []
tri = []
lbl = 0
for i in catdatalist:
  img = dataset['train_img'][i]
  img = img[:, ::-1, :]        # 左右を逆方向からスライシングしてセット
  trl.append(lbl)
  tri.append(img)

catdataset = {}
catdataset['train_label'] = np.array(trl, dtype=np.uint8)
catdataset['train_img']   = np.array(tri, dtype=np.uint8)

tri =np.append(dataset['train_img'], catdataset['train_img'], axis=0)
trl =np.append(dataset['train_label'], catdataset['train_label'], axis=0)
x_train = tri  / 255.0
t_train = trl
反転した猫データを追加した訓練データで学習させます。
model.fit(x_train, t_train, epochs=10, batch_size=128)
Epoch 1/10
282/282 [==============================] - 571s 2s/step - loss: 0.6604 - accuracy: 0.6783
Epoch 2/10
282/282 [==============================] - 569s 2s/step - loss: 0.5840 - accuracy: 0.7220
Epoch 3/10
282/282 [==============================] - 570s 2s/step - loss: 0.5407 - accuracy: 0.7511
Epoch 4/10
282/282 [==============================] - 572s 2s/step - loss: 0.5076 - accuracy: 0.7689
Epoch 5/10
282/282 [==============================] - 565s 2s/step - loss: 0.4808 - accuracy: 0.7860
Epoch 6/10
282/282 [==============================] - 566s 2s/step - loss: 0.4599 - accuracy: 0.7974
Epoch 7/10
282/282 [==============================] - 563s 2s/step - loss: 0.4337 - accuracy: 0.8115
Epoch 8/10
282/282 [==============================] - 565s 2s/step - loss: 0.4137 - accuracy: 0.8181
Epoch 9/10
282/282 [==============================] - 564s 2s/step - loss: 0.3966 - accuracy: 0.8256
Epoch 10/10
282/282 [==============================] - 565s 2s/step - loss: 0.3759 - accuracy: 0.8331
test_loss, test_acc = model.evaluate(x_test, t_test, verbose=2)
32/32 - 4s - loss: 0.3959 - accuracy: 0.8220
誤判定の件数は
178
猫を間違えた 28
犬を間違えた 150
反転データを入れてないときは
間違い 158件 猫を間違えた109件 犬を間違えた49件 でしたから
猫についてだけは、大きく精度が上がっています。
しかし、犬の誤判定が増え、全体の精度が落ちてしまいました。
と言う事は、「猫と正しく判定した」のではなくて、「猫と判定をする件数が増えた」と言うことなのだと考えられます。全データを「猫」と判定すれば、猫は100%の正解率になります。
データを追加することで、学習は強化されるようですが、副作用も大きいということでしょうか。
(追記)
正解率 = (猫を猫と判定した件数+犬を犬と判定)/全件数 = (472 + 350)/1000 = 82.2%
猫の適合率 = 猫を猫と判定/(猫を猫と判定+犬を猫と判定) = 472/(472 + 150) = 75.9%
猫の再現率 = 猫を猫と判定/実際の猫の件数 = 472/500 = 94.4%
犬の適合率 = 犬を犬と判定/(犬を犬と判定+猫を犬と判定) = 350/(350 + 28) = 92.6%
犬の再現率 = 犬を犬と判定/実際の犬の件数 = 350/500 = 70.0%
犬を猫と誤判定した件数が多いせいで、犬の再現率と猫の適合率が低くなっている。
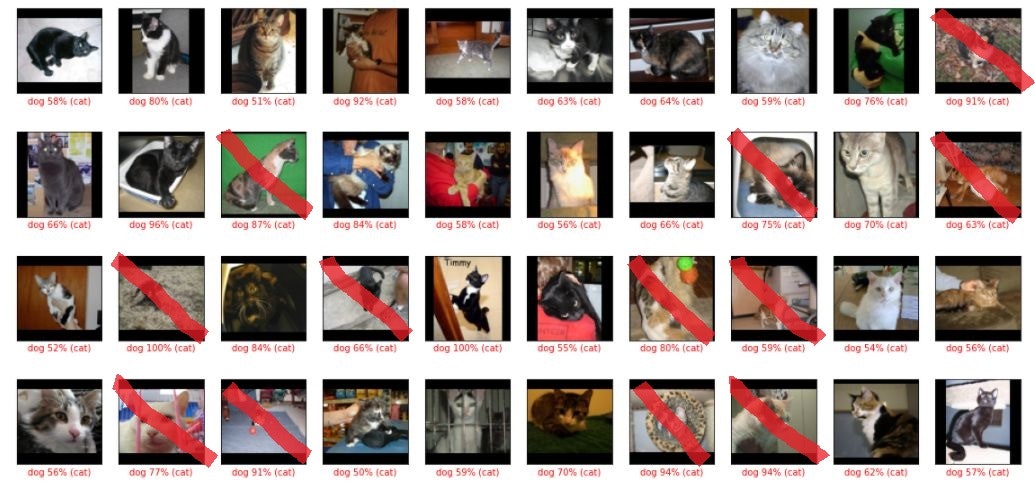
間違いから正解に変わった猫の画像と、正解から間違いに変わった犬画像をしらべてみた
間違いから正解に変わった猫画像 赤いマークをしているのは、2回目も間違いだったもの
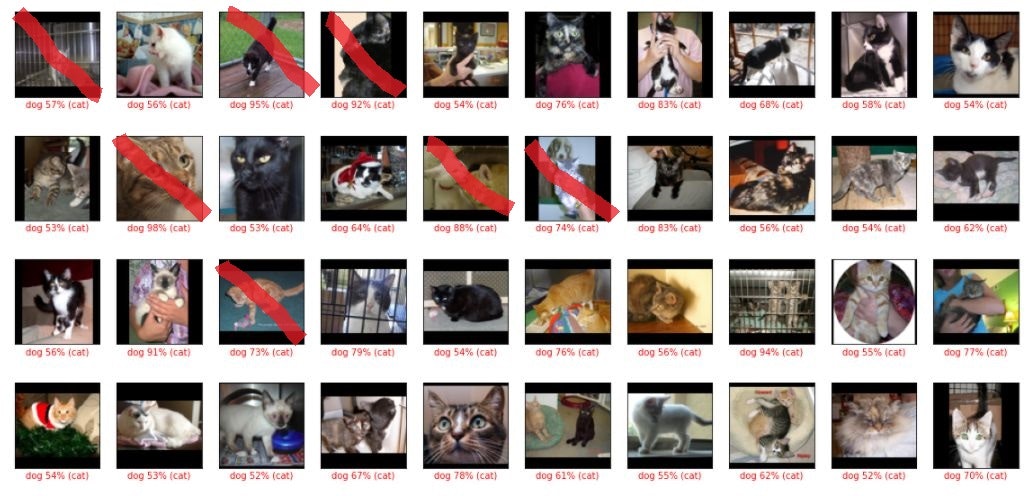
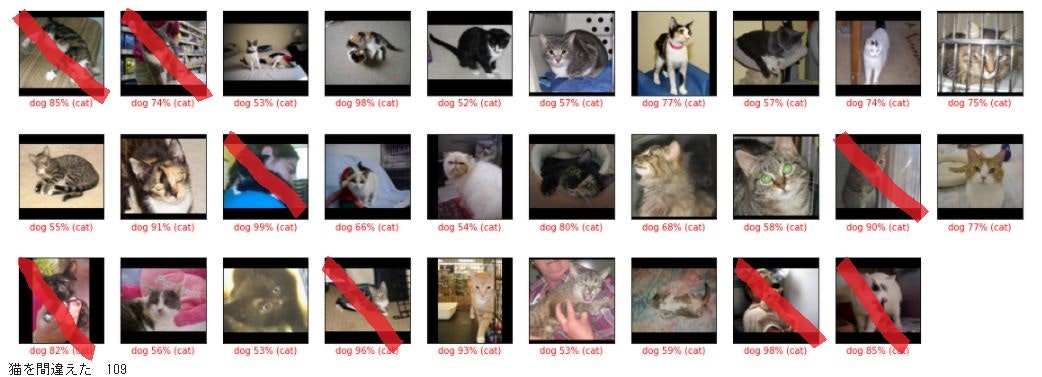
正解から間違いに変わった犬画像 黄色マークは1回目も間違いだったもの
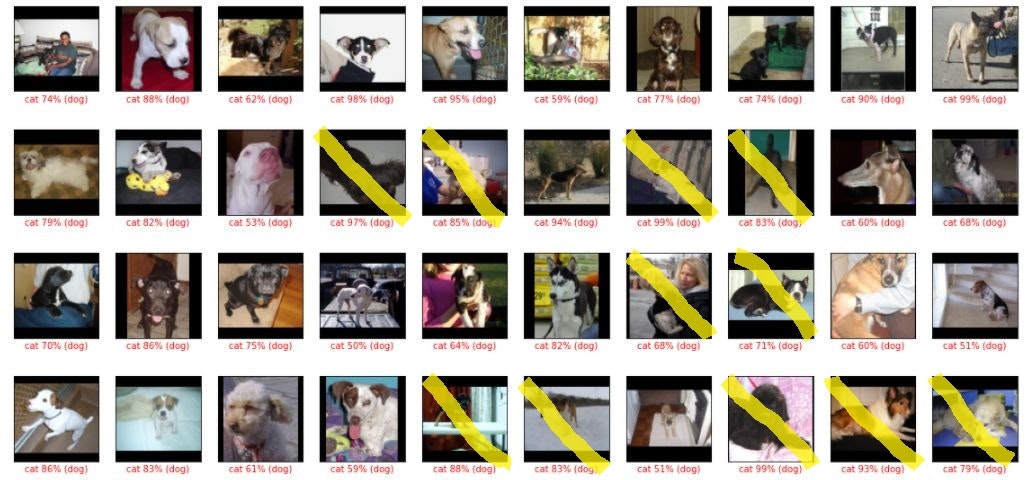
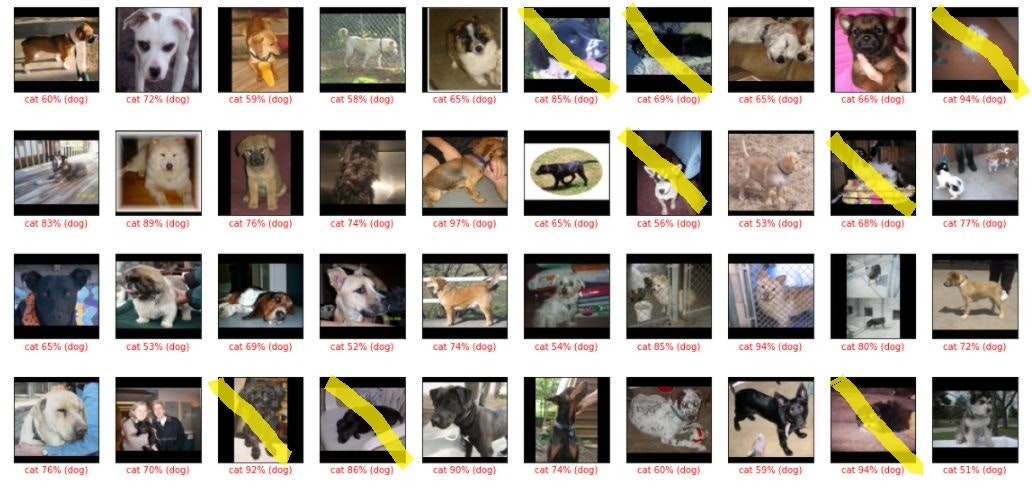
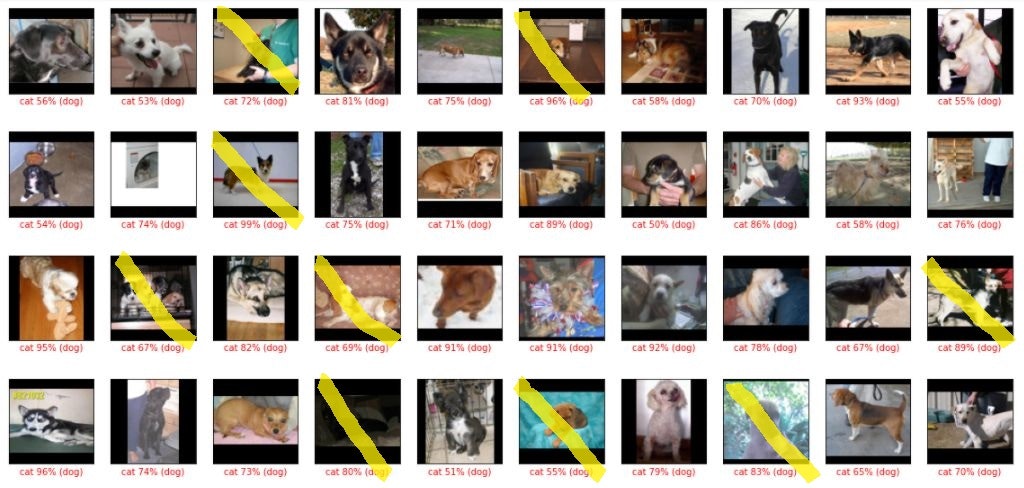
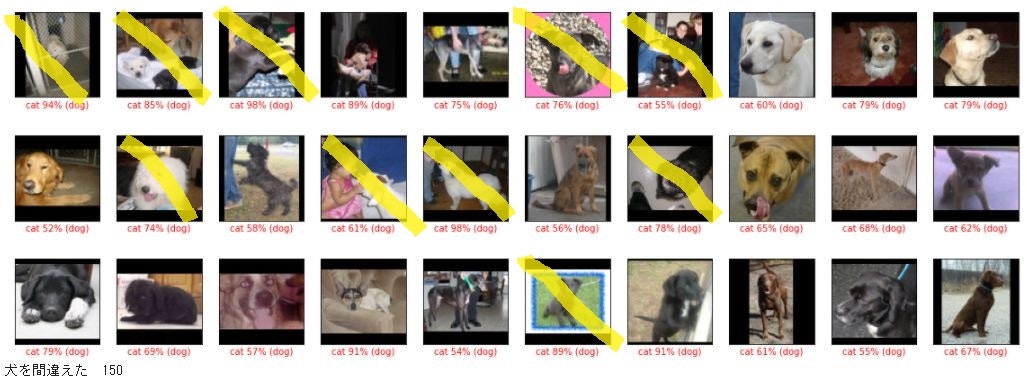
犬っぽいお座りをしている猫画像が正しく判定されるようになったけれど、ふつうにお座りしている犬画像まで「猫」と判定されるようになった感じ?
また、1回目では鼻だけで「犬」と判定していただろう、顔の大写しの画像が「猫」に判定されています。
うーむ。よーわからん。
では、犬の反転画像も追加して学習したらどうなるか? やってみました。
猫と犬の両方の反転画像を追加して学習してみた
つまり、訓練データ件数が倍になるということ。
結果は
32/32 - 4s - loss: 0.2186 - accuracy: 0.9090
正解率90%に向上。
誤判定91件 内、猫を犬と間違えた48件 犬を猫と間違えた43件
反転データを入れてないときは
間違い 158件 猫を間違えた109件 犬を間違えた49件 でしたから
猫を間違えた件数が半分になっています。
犬っぽいお座りをしている画像と、顔が大写しの画像が、間違いから正解に変わっているようです。
(追記)
正解率 = (猫を猫と判定した件数+犬を犬と判定)/全件数 = (452 + 457)/1000 = 90.9%
猫の適合率 = 猫を猫と判定/(猫を猫と判定+犬を猫と判定) = 452/(452 + 43) = 91.3%
猫の再現率 = 猫を猫と判定/実際の猫の件数 = 452/500 = 90.4%
犬の適合率 = 犬を犬と判定/(犬を犬と判定+猫を犬と判定) = 457/(457 + 48) = 90.5%
犬の再現率 = 犬を犬と判定/実際の犬の件数 = 457/500 = 91.4%
すべての率が90%を超えた。極端な偏りがない判定になっているということか?
以上のことから、次のことが言えるかと。
・左右反転させた訓練データで、件数を倍に水増ししても、学習に使えるし、有効であること。
・今回の例のように2つに分類する場合、訓練データの件数は犬猫同じ件数にそろえたほうが偏りのない学習になること。猫の件数が多いと、猫についての過学習が起きたようです。
ただ、訓練データ件数が倍になったら、さすがのGoogle Colab もRAMがいっぱいになってクラッシュしてしまいます。
ということで、これ以上データを増やすのは難しそうなので、犬猫データの判別は、このへんで終わりにします。
Pillowで画像を加工してみた
左右反転以外にも、拡大、回転、移動させてみました。
import numpy as np
from PIL import Image
import matplotlib.pyplot as plt

def flip_img(img):
  return img[:, ::-1, :]

def cropp_img(img, r=1.2):
  imgr = Image.fromarray(img, 'RGB')
  h, w, c = img.shape
  wr = int(w * r)
  hr = int(h * r)
  ws = int((wr - w)/2)
  hs = int((hr - h)/2)
  imgr = imgr.resize((wr, hr))
  return np.array(imgr)[hs:(hs+h), ws:(ws+w), :]

def rotate_img(img, r=30): # 度数
  imgr = Image.fromarray(img, 'RGB')
  imgr =imgr.rotate(r)
  return np.array(imgr)

def trans_horiz_img(img, r=0.1):
  h, w, c = img.shape
  imgr = Image.fromarray(img, 'RGB')
  imgr =imgr.rotate(0, translate=(w*r, 0))
  return np.array(imgr)

def trans_vert_img(img, r=0.1):
  h, w, c = img.shape
  imgr = Image.fromarray(img, 'RGB')
  imgr =imgr.rotate(0, translate=(0, h*r))
  return np.array(imgr)

def trans_img(img, rw=0.1, rh=0.1):
  h, w, c = img.shape
  imgr = Image.fromarray(img, 'RGB')
  imgr =imgr.rotate(0, translate=(w*rw, h*rh))
  return np.array(imgr)


img = dataset['train_img'][1] # np.array
imgC = cropp_img(img, 1.3)
imgF = flip_img(img)
imgR = rotate_img(img, 30)
imgH = trans_horiz_img(img,0.2)
imgV = trans_vert_img(img, -0.1)
imgT = trans_img(img, 0.1, 0.1)

fig = plt.figure(figsize=(20, 20))
im = fig.add_subplot(1, 8, 1)
im.imshow(img, cmap=plt.cm.binary)
im = fig.add_subplot(1, 8, 2)
im.imshow(imgC, cmap=plt.cm.binary)
im = fig.add_subplot(1, 8, 3)
im.imshow(imgF, cmap=plt.cm.binary)
im = fig.add_subplot(1, 8, 4)
im.imshow(imgR, cmap=plt.cm.binary)
im = fig.add_subplot(1, 8, 5)
im.imshow(imgH, cmap=plt.cm.binary)
im = fig.add_subplot(1, 8, 6)
im.imshow(imgV, cmap=plt.cm.binary)
im = fig.add_subplot(1, 8, 7)
im.imshow(imgT, cmap=plt.cm.binary)
pillowを使わずに画像を加工してみた
別の記事にまとめました→ その19の2
追記 Tensor Flow のサイトでも、同じような事をやっていました。
keras の ImageDataGenerator クラスを使うと、画像の読み込み、前処理がかんたんにできるようです。
image_gen_train = ImageDataGenerator(
                    rescale=1./255,
                    rotation_range=45, # 回転
                    width_shift_range=.15, # 水平シフト
                    height_shift_range=.15, # 垂直シフト
                    horizontal_flip=True, # 水平反転
                    zoom_range=0.5 # ズーム
                    )
パラメータ rescale=1./255 というのは、画像を変換する前に、 与えられた値(この場合は1./255)をデータに積算する、ということです。つまり、画像データを正規化しているわけです。
rotation_range: 整数.画像をランダムに回転する回転範囲.
width_shift_range: 浮動小数点数(横幅に対する割合).ランダムに水平シフトする範囲.
height_shift_range: 浮動小数点数(縦幅に対する割合).ランダムに垂直シフトする範囲.
horizontal_flip: 真理値.水平方向に入力をランダムに反転します.
zoom_range: 浮動小数点数または[lower,upper].ランダムにズームする範囲.浮動小数点数が与えられた場合,[lower, upper] = [1-zoom_range, 1+zoom_range]です.
train_dir = os.path.join(PATH, 'train')

batch_size = 128
epochs = 15
IMG_HEIGHT = 150
IMG_WIDTH = 150

train_data_gen = image_gen_train.flow_from_directory(batch_size=batch_size,
                                                     directory=train_dir,
                                                     shuffle=True,
                                                     target_size=(IMG_HEIGHT, IMG_WIDTH),
                                                     class_mode='binary')
flow_from_directoryメソッドで、拡張/正規化したデータのバッチを生成
batch_size: データのバッチのサイズ(デフォルト: 32).
directory: ディレクトリへのパス
shuffle: データをシャッフルするかどうか(デフォルト: True).
target_size: 整数のタプル(height, width).デフォルトは(256, 256).この値に全画像はリサイズされます
class_mode: "categorical"か"binary"か"sparse"か"input"か"None"のいずれか1つ.デフォルトは"categorical".返すラベルの配列のshapeを決定します:"categorical"は2次元のone-hotにエンコード化されたラベル,"binary"は1次元の2値ラベル,"sparse"は1次元の整数ラベル,"input"は入力画像と同じ画像になります(主にオートエンコーダで用いられます).Noneであれば,ラベルを返しません(ジェネレーターは画像のバッチのみ生成するため,model.predict_generator()やmodel.evaluate_generator()などを使う際に有用).class_modeがNoneの場合,正常に動作させるためにはdirectoryのサブディレクトリにデータが存在する必要があることに注意してください.
history = model.fit_generator(
    train_data_gen,
    steps_per_epoch=total_train // batch_size,
    epochs=epochs,
    validation_data=val_data_gen,
    validation_steps=total_val // batch_size
)
fit_generator メソッドを使用して、ネットワークを学習
メモの目次等はこちらから 読めない用語集
