【Rで球面幾何学】二辺形(Bilateral)と一辺形(One Side)?
ここで扱った円描画関数(Circle Function)Cos(θ)+Sin(θ)iの一般形Cos(θ)+Cos(θ-π/NoS)i(NoS=Number of Sides)には、その計算上現れる正方形(Square)上においてcos(θ)+sin(θ)iが成立しないという驚くべき側面が存在します。しかしご安心ください。ここに登場する正方形(Square)は、我々が良く見知っている、すなわち「デカルト座標系の世界(Cartesian Coordinate System Set)」において平方眼(Square Grid)や立方眼(Cubic Grid)を構成する正方形とは「ある種別物」なのです。
●数式Cos(θ)+Cos(θ-π/NoS)i(NoS=Number of Sides)に登場する正方形

c0<-seq(0,2*pi,length=60)
cx0<-cos(c0)
cy0<-sin(c0)
plot(cx0,cy0,asp=1,type="l",xlim=c(-1,1),ylim=c(-1,1),main="Square in Cos(θ) + Cos(θ-π/4)i",xlab="Real",ylab="Imaginal")

par(new=T) #上書き

 c1<-seq(0,2*pi,length=5)
cx1<-cos(c1)
cy1<-sin(c1)
plot(cx1,cy1,asp=1,type="l",xlim=c(-1,1), ylim=c(-1,1), main="",xlab="",ylab="")
# 塗りつぶし
polygon(cx1, #x
cy1, #y
density=c(30), #塗りつぶす濃度
angle=c(45),     #塗りつぶす斜線の角度
col=rgb(1,0,0))  #塗りつぶす色
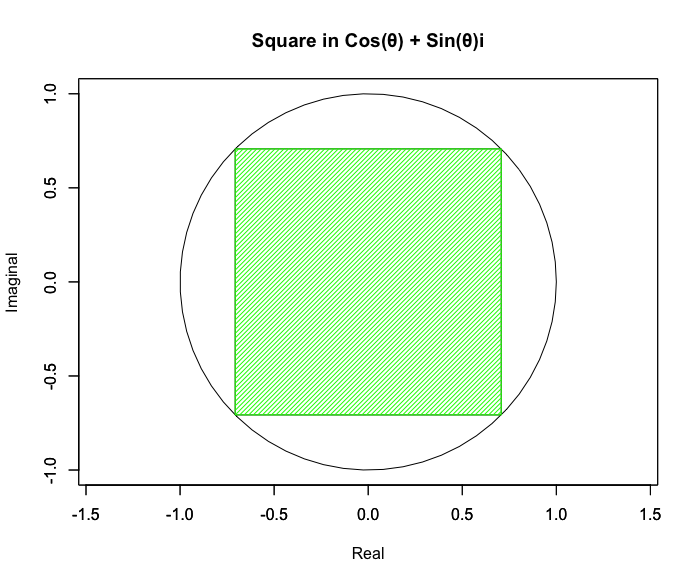
「デカルト座標系(Cartesian Coordinate System Set)」に登場する正方形

c0<-seq(0,2*pi,length=60)
cx0<-cos(c0)
cy0<-sin(c0)
plot(cx0,cy0,asp=1,type="l",xlim=c(-1,1),ylim=c(-1,1),main="Square in Cos(θ) + Sin(θ)i",xlab="Real",ylab="Imaginal")

par(new=T) #上書き

 c1<-seq(0,2*pi,length=5)+pi/4
cx1<-cos(c1)
cy1<-sin(c1)
plot(cx1,cy1,asp=1,type="l",xlim=c(-1,1), ylim=c(-1,1), main="",xlab="",ylab="")

polygon(cx1, #x
cy1, #y
density=c(30), #塗りつぶす濃度
angle=c(45),     #塗りつぶす斜線の角度
col=rgb(0,1,0))  #塗りつぶす色
【オイラーの多面体定理と正多面体】二次元上の多角形と三次元の多面体の往復
とりあえず、こういう概念(Concept)として導入(Introduce)しておきましょう。詳しい説明は後の投稿に回しますが、要するに以下の概念の導入によりこの問題は回避されるのです。
- Nos(Number of Side)=4の図形でCos(θ)+Sin(θ)iが成立するのは最初の1/4周期のみ。
- ところで回転する正多角形上で用いられる三角関数は辺ごとの区間でリセットされ、これが辺数だけ繰り返されるのが「自明の場合(Trivial Case)」である。
- そして正方形(正四辺形)の場合は原点から外角=内角=90度(π/2ラジアン)の範囲が抽出され4回繰り返されるが、その結果合成される波形が「たまたま」元波形Cos(θ)+Sin(θ)iのそれと合致する。
f0<-function(x){cos(x)}
plot(f0,col=rgb(0,0,1),xlim=c(0,2*pi),ylim=c(-1.5,1.5),main="Three square theorem",xlab="radian(π)",ylab="Amplitude")
par(new=T) #上書き
f1<-function(x){sin(x)}
plot(f1,col=rgb(0,1,0),xlim=c(0,2*pi),ylim=c(-1.5,1.5),main="",xlab="",ylab="")
par(new=T) #上書き
f2<-function(x){cos(x)+sin(x)}
plot(f2,col=rgb(1,0,0),xlim=c(0,2*pi),ylim=c(-1.5,1.5),main="",xlab="",ylab="")
par(new=T) #上書き
f3<-function(x){cos(x)*sin(x)}
plot(f3,col=c(125,125,125),xlim=c(0,2*pi),ylim=c(-1.5,1.5),main="",xlab="",ylab="")
par(new=T) #上書き
f4<-function(x){cos(x)^2+sin(x)^2}
plot(f4,col=rgb(0,0,0),xlim=c(0,2*pi),ylim=c(-1.5,1.5),main="",xlab="",ylab="")

abline(v = pi/2)
legend("bottomright", legend=c("y=cos(θ)","y=sin(θ)","y=cos(θ)+sin(θ)","y=cos(θ)*sin(θ)","y=cos(θ)^2*sin(θ)^2"), lty=c(1,1,1,1,1), col=c(rgb(0,0,1),rgb(0,1,0),rgb(1,0,0),c(125,125,125),rgb(0,0,0)))
rad<-seq(0,pi/2,length=60)
f0<-function(x){cos(x)}
f0_y<-f0(rad)
plot(-1*f0_y,rad,type="l",col=rgb(0,0,1),xlim=c(-1*sqrt(2),0),ylim=c(0,pi/2),main="Side length sampling effect(1/4 Lotation)",xlab="Amplitude",ylab="radian(π)")
par(new=T) #上書き
f1<-function(x){sin(x)}
f1_y<-f1(rad)
plot(-1*f1_y,rad,type="l",col=rgb(0,1,0),xlim=c(-1*sqrt(2),0),ylim=c(0,pi/2),main="",xlab="",ylab="")
par(new=T) #上書き
f2<-function(x){cos(x)+sin(x)}
f2_y<-f2(rad)
plot(-1*f2_y,rad,type="l",col=rgb(1,0,0),xlim=c(-1*sqrt(2),0),ylim=c(0,pi/2),main="",xlab="",ylab="")
par(new=T) #上書き
f3<-function(x){cos(x)*sin(x)}
f3_y<-f3(rad)
plot(-1*f3_y,rad,type="l",col=rgb(0,1,1),xlim=c(-1*sqrt(2),0),ylim=c(0,pi/2),main="",xlab="",ylab="")
par(new=T) #上書き
f4<-function(x){sqrt(cos(x)^2+sin(x)^2)}
f4_y<-f4(rad)
plot(-1*f4_y,rad,type="l",col=rgb(0,0,0),xlim=c(-1*sqrt(2),0),ylim=c(0,pi/2),main="",xlab="",ylab="")
legend("bottomright", legend=c("y=cos(θ)","y=sin(θ)","y=cos(θ)+sin(θ)","y=cos(θ)*sin(θ)","y=(sqrt(cos(θ)+sin(θ)^2)"), lty=c(1,1,1,1,1), col=c(rgb(0,0,1),rgb(0,1,0),rgb(1,0,0),rgb(0,1,1),rgb(0,0,0)))
rad<-seq(0,pi/2,length=60)
f0<-function(x){cos(x)}
f0_y<-f0(rad)
plot(rad,f0_y*-1,type="l",col=rgb(0,0,1),xlim=c(0,pi/2),ylim=c(-1*sqrt(2),0),main="Side length sampling effect(2/4 Rotation)",xlab="radian(π)",ylab="Amplitude")
par(new=T) #上書き
f1<-function(x){sin(x)}
f1_y<-f1(rad)
plot(rad,f1_y*-1,type="l",col=rgb(0,1,0),xlim=c(0,pi/2),ylim=c(-1*sqrt(2),0),main="",xlab="",ylab="")
par(new=T) #上書き
f2<-function(x){cos(x)+sin(x)}
f2_y<-f2(rad)
plot(rad,f2_y*-1,type="l",col=rgb(1,0,0),xlim=c(0,pi/2),ylim=c(-1*sqrt(2),0),main="",xlab="",ylab="")
par(new=T) #上書き
f3<-function(x){cos(x)*sin(x)}
f3_y<-f3(rad)
plot(rad,f3_y*-1,type="l",col=rgb(0,1,1),xlim=c(0,pi/2),ylim=c(-1*sqrt(2),0),main="",xlab="",ylab="")
par(new=T) #上書き
f4<-function(x){sqrt(cos(x)^2+sin(x)^2)}
f4_y<-f4(rad)
plot(rad,f4_y*-1,type="l",col=rgb(0,0,0),xlim=c(0,pi/2),ylim=c(-1*sqrt(2),0),main="",xlab="",ylab="")
legend("bottomright", legend=c("y=cos(θ)","y=sin(θ)","y=cos(θ)+sin(θ)","y=cos(θ)*sin(θ)","y=(sqrt(cos(θ)+sin(θ)^2)"), lty=c(1,1,1,1,1), col=c(rgb(0,0,1),rgb(0,1,0),rgb(1,0,0),rgb(0,1,1),rgb(0,0,0)))
rad<-seq(0,pi/2,length=60)
f0<-function(x){cos(x)}
f0_y<-f0(rad)
plot(f0_y,rad,type="l",col=rgb(0,0,1),xlim=c(0,sqrt(2)),ylim=c(0,pi/2),main="Side length sampling effect(3/4 Lotation)",xlab="Amplitude",ylab="radian(π)")
par(new=T) #上書き
f1<-function(x){sin(x)}
f1_y<-f1(rad)
plot(f1_y,rad,type="l",col=rgb(0,1,0),xlim=c(0,sqrt(2)),ylim=c(0,pi/2),main="",xlab="",ylab="")
par(new=T) #上書き
f2<-function(x){cos(x)+sin(x)}
f2_y<-f2(rad)
plot(f2_y,rad,type="l",col=rgb(1,0,0),xlim=c(0,sqrt(2)),ylim=c(0,pi/2),main="",xlab="",ylab="")
par(new=T) #上書き
f3<-function(x){cos(x)*sin(x)}
f3_y<-f3(rad)
plot(f3_y,rad,type="l",col=rgb(0,1,1),xlim=c(0,sqrt(2)),ylim=c(0,pi/2),main="",xlab="",ylab="")
par(new=T) #上書き
f4<-function(x){sqrt(cos(x)^2+sin(x)^2)}
f4_y<-f4(rad)
plot(f4_y,rad,type="l",col=rgb(0,0,0),xlim=c(0,sqrt(2)),ylim=c(0,pi/2),main="",xlab="",ylab="")
legend("bottomright", legend=c("y=cos(θ)","y=sin(θ)","y=cos(θ)+sin(θ)","y=cos(θ)*sin(θ)","y=(sqrt(cos(θ)+sin(θ)^2)"), lty=c(1,1,1,1,1), col=c(rgb(0,0,1),rgb(0,1,0),rgb(1,0,0),rgb(0,1,1),rgb(0,0,0)))
c1<-seq(0,2*pi,length=120)
# x=-sin(θ),y=cos(θ)
plot(c1[1:30],cx[1:30],type="l",col=rgb(1,0,0),xlim=c(0,2*pi),ylim=c(-1,1),main="Synthesis of circular functions",xlab="x",ylab="y")
par(new=T)
plot(c1[1:30],cy[1:30],type="l",col=rgb(0,1,0),xlim=c(0,2*pi),ylim=c(-1,1),main="",xlab="",ylab="")
par(new=T)
# x=-sin(θ),y=cos(θ)
plot(c1[31:60],cx[31:60],type="l",col=rgb(1,0,1),xlim=c(0,2*pi),ylim=c(-1,1),main="",xlab="",ylab="")
par(new=T)
plot(c1[31:60],cy[31:60],type="l",col=rgb(1,0,0),xlim=c(0,2*pi),ylim=c(-1,1),main="",xlab="",ylab="")
par(new=T)
## -cos(θ) & -sin(θ)
plot(c1[61:90],cx[61:90],type="l",col=rgb(0,0,1),xlim=c(0,2*pi),ylim=c(-1,1),main="",xlab="",ylab="")
par(new=T)
plot(c1[61:90],cy[61:90],type="l",col=rgb(1,0,1),xlim=c(0,2*pi),ylim=c(-1,1),main="",xlab="",ylab="")
par(new=T)
# x=sin(θ),y=-cos(θ)
plot(c1[91:120],cx[91:120],type="l",col=rgb(0,1,0),xlim=c(0,2*pi),ylim=c(-1,1),main="",xlab="",ylab="")
par(new=T)
plot(c1[91:120],cy[91:120],type="l",col=rgb(0,0,1),xlim=c(0,2*pi),ylim=c(-1,1),main="",xlab="",ylab="")
# 補助線
abline(v=0,col=c(200,200,200))
abline(v=pi/2,col=c(200,200,200))
abline(v=pi,col=c(200,200,200))
abline(v=3*pi/2,col=c(200,200,200))
abline(v=2*pi,col=c(200,200,200))

 #凡例
legend("bottomright", legend=c("cos(θ)","sin(θ)","-cos(θ)","-sin(θ)"), lty=c(1,1,1,1), col=c(rgb(1,0,0),rgb(0,1,0),rgb(0,0,1),rgb(1,0,1)))
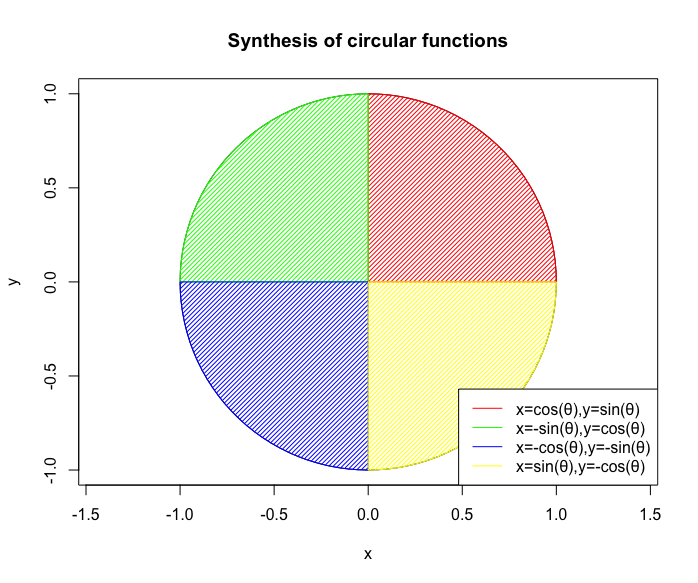
c0<-seq(0,pi/2,length=30)
cx=c(cos(c0),sin(-c0),-cos(c0),-sin(-c0))
cy=c(sin(c0),cos(-c0),-sin(c0),-cos(-c0))
plot(cx,cy,asp=1,type="l",main="Synthesis of circular functions",xlab="x",ylab="y")
# cos(θ) & sin(θ)
polygon(c(0,cx[1:30],0), #x
c(0,cy[1:30],0), #y
density=c(30), #塗りつぶす濃度
angle=c(45),     #塗りつぶす斜線の角度
col=rgb(1,0,0))  #塗りつぶす色

# sin(-θ) & cos(-θ)
polygon(c(0,cx[31:60],0), #x
c(0,cy[31:60],0), #y
density=c(30), #塗りつぶす濃度
angle=c(45),     #塗りつぶす斜線の角度
col=rgb(0,1,0))  #塗りつぶす色

# -cos(θ) & -sin(θ)
polygon(c(0,cx[61:90],0), #x
c(0,cy[61:90],0), #y
density=c(30), #塗りつぶす濃度
angle=c(45),     #塗りつぶす斜線の角度
col=rgb(0,0,1))  #塗りつぶす色

# -sin(-θ) & -cos(-θ)
polygon(c(0,cx[91:120],0), #x
c(0,cy[91:120],0), #y
density=c(30), #塗りつぶす濃度
angle=c(45),     #塗りつぶす斜線の角度
col=rgb(1,1,0))  #塗りつぶす色
# 凡例
legend("bottomright", legend=c("x=cos(θ),y=sin(θ)","x=-sin(θ),y=cos(θ)","x=-cos(θ),y=-sin(θ)","x=sin(θ),y=-cos(θ)"), lty=c(1,1,1,1), col=c(rgb(1,0,0),rgb(0,1,0),rgb(0,0,1),rgb(1,1,0)))
# MCtS=Multiplication Cos(θ) times Sin(θ)
MCtS<-function(theta){
c0<-seq(0,2*pi,length=60)
cx<-cos(c0)
cy<-sin(c0)
plot(cx,cy,asp=1,type="l",main="Multiplication Cos(θ) * Sin(θ)",ylab="Cos(θ)",xlab="Sin(θ)")
# 第一象限
polygon(c(0,cx[theta],cx[theta],0,0), #x
c(0,0,cy[theta],cy[theta],0), #y
density=c(30), #塗りつぶす濃度
angle=c(45),     #塗りつぶす斜線の角度
col=rgb(1,0,0))  #塗りつぶす色

# 第二象限
polygon(c(0,cx[theta+15],cx[theta+15],0,0), #x
c(0,0,cy[theta+15],cy[theta+15],0), #y
density=c(30), #塗りつぶす濃度
angle=c(45),     #塗りつぶす斜線の角度
col=rgb(0,1,0))  #塗りつぶす色

# 第三象限
polygon(c(0,cx[theta+30],cx[theta+30],0,0), #x
c(0,0,cy[theta+30],cy[theta+30],0), #y
density=c(30), #塗りつぶす濃度
angle=c(45),     #塗りつぶす斜線の角度
col=rgb(0,0,1))  #塗りつぶす色

# 第四象限
polygon(c(0,cx[theta+45],cx[theta+45],0,0), #x
c(0,0,cy[theta+45],cy[theta+45],0), #y
density=c(30), #塗りつぶす濃度
angle=c(45),     #塗りつぶす斜線の角度
col=rgb(1,1,0))  #塗りつぶす色

# 頂点に文字
text(cx[theta],cy[theta],"a",col=rgb(1,0,0))
text(cx[theta+15],cy[theta+15],"b",col=rgb(0,1,0))
text(cx[theta+30],cy[theta+30],"c",col=rgb(0,0,1))
text(cx[theta+45],cy[theta+45],"d",col=rgb(1,1,0))
}

# アニメーション
library("animation")
Time_Code=c(1:15)
saveGIF({
for (i in Time_Code){
  MCtS(i)
}
}, interval = 0.1, movie.name = "MCtS01.gif")
# 複素平面(球面)

Complex_plane<-function(x){

ifelse*1
theta <- c(seq(0, pi, length=180),seq(-pi, 0, length=180))
dr<-seq(0,2*pi,length=360)

theta00<- seq(1, -1, length=360)
theta01 <- c(theta[x:360],theta[1:x-1])
theta_cos<-cos(theta01)
theta_sin<-sin(theta01)
plot(cos(theta), sin(theta), xlim=c(-1,1), ylim=c(-1,1), type="l", main="Correlation coefficient",xlab="Real Expanse", ylab="Imaginal Expanse")
par(new=T)#上書き指定
plot(theta_cos,theta00,xlim=c(-1,1), ylim=c(-1,1), type="l",col=rgb(0,1,0),main="",xlab="", ylab="")

# cos(x)を塗りつぶす
polygon(theta_cos, #x
theta00, #y
density=c(30), #塗りつぶす濃度
angle=c(45),     #塗りつぶす斜線の角度
col=rgb(0,1,0))  #塗りつぶす色

# sin(x)を塗りつぶす
polygon(theta00, #x
theta_sin, #y
density=c(30), #塗りつぶす濃度
angle=c(45),     #塗りつぶす斜線の角度
col=rgb(0,0,1))  #塗りつぶす色


# 線を引く
segments(cos(dr[x]),sin(dr[x]),0,0,rgb(0,0,0))

# Cosθ+Sinθを塗りつぶす
polygon(c(0,cos(dr[x]),cos(dr[x]),0,0), #x
c(0,0,sin(dr[x]),sin(dr[x]),0), #y
density=c(30), #塗りつぶす濃度
angle=c(45),     #塗りつぶす斜線の角度
col=rgb(1,0,0))  #塗りつぶす色

# 凡例
# legend("bottomleft", legend=c("cos","sin", "cosθ & sinθ"), lty=c(1,1,1),col =c(rgb(0,1,0),rgb(0,0,1),rgb(0,1,1))
}

# アニメーションさせてみる。

library("animation")
Time_Code=c(1,15,30,45,60,75,90,105,120,135,150,165,180,195,210,225,240,255,270,285,300,315,330,345)
saveGIF({
for (i in Time_Code){
  Complex_plane(i)
}
}, interval = 0.1, movie.name = "TEST001.gif")
何の事はない、三角関数の微積分結果をマクローリン級数で再合成する円描画関数(Circle Function)Cos(θ)+Sin(θ)iの導出過程そのものですね。これが無限周期で繰り返されていると考えればいい訳です。
【初心者向け】三角関数と指数・対数関数の「巡回性」について。
【Rで球面幾何学】オイラーの公式とは、そもそも何か?
【Rで球面幾何学】オイラーの公式を導出したマクローリン級数の限界?
逆を言えばCos(θ)+Sin(θ)iが成立するのはあくまで二辺形と四辺形のみ。それ以外の辺数の多角形ではこの式の一般形たるCos(θ)+Cos(θ-π/NoS)i(NoS=Number of Sides)しか成立し得ないのです。

# RIC=内接円の角度(Radians of Inscribed Circle)
# Noc=角数(Number of corners)
RIC<-function(NoC){
f0<-function(x){cos(x)}
plot(f0,col=rgb(0,1,1),xlim=c(0,2*pi),ylim=c(-1,1),main="Radians of Inscribed Regular Polygons",xlab="radian(π)",ylab="Amplitude")
par(new=T) #上書き
f1<-function(x){cos(x-1/NoC*pi)}
plot(f1,col=rgb(0,0,1),xlim=c(0,2*pi),ylim=c(-1,1),main="",xlab="",ylab="")
abline(v =0)

for(i in 1:NoC){
abline(v =2*i/NoC*pi)
}
# 補助線
abline(h=1,col=rgb(1,0,0))
abline(h=cos(pi/NoC),col=rgb(0,1,0))

# サンプリング範囲を塗りつぶす
polygon(c(0,2/NoC*pi,2/NoC*pi,0,0), #x
c(1,1,cos(pi/NoC),cos(pi/NoC),1), #y
density=c(30), #塗りつぶす濃度
angle=c(45),     #塗りつぶす斜線の角度
col=c(200,200,200))  #塗りつぶす色

text01<-paste0("y=cos(θ-1/",NoC,"*pi)")
legend("bottomright", legend=c("y=cos(θ)",text01,"Radius of Unit Circle","Radius of Inscribed circle"), lty=c(1,1,1,1), col=c(rgb(0,1,1),rgb(0,0,1),rgb(1,0,0),rgb(0,1,0)))
}
# アニメーション
library("animation")
Time_Code=rep(2:16, each=3)
saveGIF({
for (i in Time_Code){
 RIC(i)
}
}, interval = 0.1, movie.name = "RIC01.gif")
# SC=サンプリングされた曲線(Sampling Curve)
# Noc=角数(Number of corners)
SC<-function(NoC){
f0<-function(x){cos(x-1/NoC*pi)}
plot(f0,col=rgb(0,0,1),xlim=c(0,2*pi/NoC),main="Sampling Curve",xlab="radian(π)",ylab="RadiusInscribed circle  of Unit circle")
par(new=T) #上書き
# 期待線
c0<-seq(0,2/NoC*pi,length=3)
c1<-c(cos(pi/NoC),1,cos(pi/NoC))
plot(c0,c1,col=rgb(0,0,0),type="o",xlim=c(0,2*pi/NoC),main="",xlab="",ylab="")

# 外接円=内接円による境界線
abline(h=1,col=rgb(1,0,0))
abline(h=cos(pi/NoC),col=rgb(0,1,0))
# 凡例
text01<-paste0("Cos(pi/",NoC,"*)/2")
legend("bottomright", legend=c("Expected line",text01,"Radius of Unit Circle","Radius of Inscribed circle"), lty=c(1,1,1,1), col=c(rgb(0,0,0),rgb(0,0,1),rgb(1,0,0),rgb(0,1,0)))

}

# アニメーション
library("animation")
Time_Code=rep(2:16, each=3)
saveGIF({
for (i in Time_Code){
 SC(i)
}
}, interval = 0.1, movie.name = "SC01.gif")
# DSC=サンプリング再生過程(Draw the Sampling Curve)
# NoC=角数(Number of corners)
DSC<-function(NoC){
# 期待線
c0<-seq(0,2*pi,length=NoC*2+1)
c1<-cos(pi/NoC)
for(i in 1:NoC-1){
c1=c(c1,1,cos(pi/NoC))
}
plot(c0,c1,type="o",xlim=c(0,2*pi),ylim=c(0,1),main="Draw the Sampling Curve",ylab='Circumference(radian)', xlab='Circle radius(Radian)')
# サンプリング線
par(new=T) #上書き
DN<-100 #分割数(Division Number)
R_time=seq(0,2*pi,length=NoC*DN)
Smp_time=seq(0,2/NoC*pi,length=DN)
f0<-function(x){cos(x-1/NoC*pi)}
S_data<-NULL
for(i in 1:NoC){
S_data<-c(S_data,f0(Smp_time))
}
plot(R_time,S_data,type="l",xlim=c(0,2*pi),ylim=c(0,1),col=rgb(0,0,1),main="",ylab="", xlab="")
# 外接円=内接円による境界線
abline(h=1,col=rgb(1,0,0))
abline(h=cos(pi/NoC),col=rgb(0,1,0))
# 凡例
text01<-paste0("Mj=1+Mn,Mn=cos(pi/",NoC,"*)/2")
legend("bottomright", legend=c("Expected line",text01), lty=c(1,1), col=c(rgb(0,0,0),rgb(0,0,1)))
}

# アニメーション
library("animation")
Time_Code=rep(2:16, each=3)
saveGIF({
for (i in Time_Code){
 DSC(i)
}
}, interval = 0.1, movie.name = "DSC01.gif")
# CCS=コサイン曲線のサンプリン(Cosine Curve Sampling)
# Noc=角数(Number of corners)
CCS<-function(NoC){
f0<-function(x){cos(x)}
plot(f0,col=rgb(0,1,1),xlim=c(0,2*pi),ylim=c(-1,1),main="Cosine Curve Sampling",xlab="radian(π)",ylab="Amplitude")
par(new=T) #上書き
f1<-function(x){cos(x-1/NoC*pi)}
plot(f1,col=rgb(0,0,1),xlim=c(0,2*pi),ylim=c(-1,1),main="",xlab="",ylab="")
par(new=T) #上書き

# 期待線
c0<-seq(0,2*pi,length=NoC*2+1)
c1<-cos(pi/NoC)
for(i in 1:NoC-1){
c1=c(c1,1,cos(pi/NoC))
}
plot(c0,c1,type="o",xlim=c(0,2*pi),ylim=c(-1,1),main="",ylab="", xlab="")
# サンプリング線
par(new=T) #上書き
DN<-100 #分割数(Division Number)
R_time=seq(0,2*pi,length=NoC*DN)
Smp_time=seq(0,2/NoC*pi,length=DN)
f0<-function(x){cos(x-1/NoC*pi)}
S_data<-NULL
for(i in 1:NoC){
S_data<-c(S_data,f0(Smp_time))
}
plot(R_time,S_data,type="l",xlim=c(0,2*pi),ylim=c(-1,1),col=rgb(0,0,1),main="",ylab="", xlab="")
# 補助線

abline(v =0)

for(i in 1:NoC){
abline(v =2*i/NoC*pi)
}
abline(h=1,col=rgb(1,0,0))
abline(h=cos(pi/NoC),col=rgb(0,1,0))

# サンプリング範囲を塗りつぶす
polygon(c(0,2/NoC*pi,2/NoC*pi,0,0), #x
c(1,1,cos(pi/NoC),cos(pi/NoC),1), #y
density=c(30), #塗りつぶす濃度
angle=c(45),     #塗りつぶす斜線の角度
col=c(200,200,200))  #塗りつぶす色
# 凡例
text01<-paste0("y=cos(θ-1/",NoC,"*pi)")
legend("bottomright", legend=c("y=cos(θ)",text01,"Radius of Unit Circle","Radius of Inscribed circle"), lty=c(1,1,1,1), col=c(rgb(0,1,1),rgb(0,0,1),rgb(1,0,0),rgb(0,1,0)))
}
# アニメーション
library("animation")
Time_Code=rep(2:16, each=3)
saveGIF({
for (i in Time_Code){
 CCS(i)
}
}, interval = 0.1, movie.name = "CCS01.gif")
ここまで事実関係が把握出来た時点で、以下続報…


