【Rで球面幾何学】指数関数や対数関数における「ネイピア数周期」の意味について。
今回の投稿の出発点はここ。
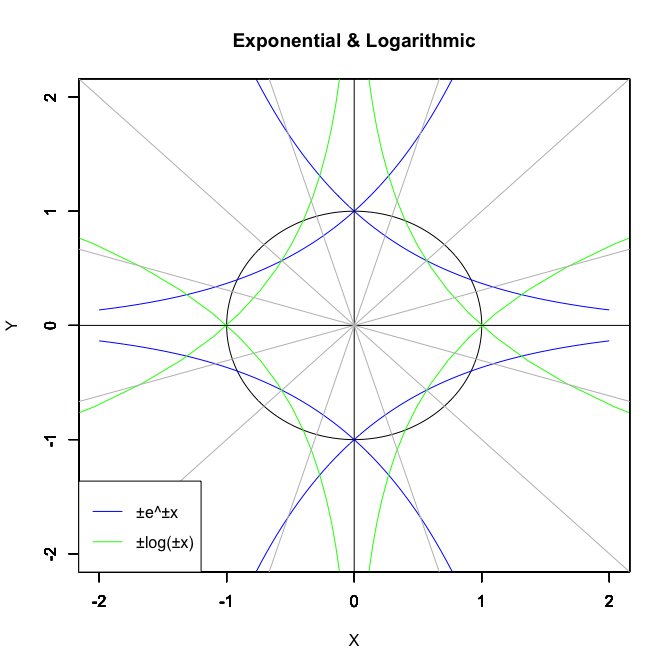
①自然指数関数e^Xi(exp(x*(0+1i)))あるいは1/e^Xi(exp(-1*(0+1i)))の場合
根を-1(1/root)から0(root/root)にかけて変化させる->下から上に円弧消失

根を0(root/root)から1(root)にかけて変化させる->上から下に円弧出現

②①の符号を逆転させた自然指数関数-e^Xiあるいは-1/e^Xi
根を-1(1/root)から0(root/root)にかけて変化させる->上から下に円弧消失

根を0(root/root)から1(root)にかけて変化させる->下から上に円弧出現

③自然対数関数log(Xi)あるいはlog(Xi,base=1/exp(1))
根を-1(1/root)から0(root/root)にかけて変化させる->左から右に円弧消失

根を0(root/root)から1(root)にかけて変化させる->右から左に円弧出現

④③の符号を逆転させた自然対数関数-log(Xi)あるいは-log(Xi,base=1/exp(1))
根を-1(1/root)から0(root/root)にかけて変化させる->右から左に円弧消失

根を0(root/root)から1(root)にかけて変化させる->左から右に円弧出現

そもそもこれらの関数はどうして円を描くのでしょうか? その秘密を読み解く為には「2乗すると-1になる」Xi(x*(0+1i))なる関数の特徴について見ていく必要がありそうです。
一次関数レベルの展開
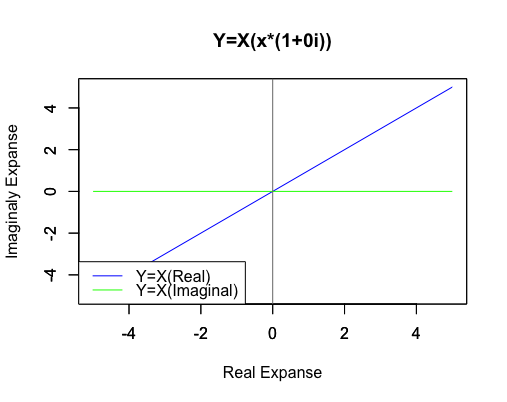
この段階ではまだ独特の性質の顕現はありません。
一次関数Y=Xi((x*(1+0i))
# タイトル定義
Main_title<-c("Y=X(x*(1+0i))")
x_title<-c("Real Expanse")
y_title<-c("Imaginaly Expanse")
# グラフのスケール決定
gs_x<-c(-5,5)
gs_y<-c(-5,5)
x0=c(-5:5)
# 関数1
f1_name<-c("Y=X(Real)")
f1<-function(x){x*(1+0i)}
y1<-Re(f1(x0))
# 関数2
f2_name<-c("Y=X(Imaginal)")
y2<-Im(f1(x0))
# グラフの色の決定
Black<-rgb(0,0,0)
Red<-rgb(1,0,0)
Magenta<-rgb(1,0,1)
Blue<-rgb(0,0,1)
Green<-rgb(0,1,0)
Cyan<-rgb(0,1,1)
Yellow<-rgb(1,1,0)
Gray<-"#777777"
# グラフ描画
plot(x0,y1,xlim=gs_x,ylim=gs_y,type="l",col=Blue, main=Main_title,xlab=x_title,ylab=y_title)
par(new=T)#上書き指定
plot(x0,y2,xlim=gs_x,ylim=gs_y,type="l",col=Green, main="",xlab="",ylab="")
# 基準線
# abline(h=0,,col=Gray)
abline(v=0,,col=Gray)
# 凡例描画
legend("bottomleft", legend=c(f1_name,f2_name),lty=c(1,1),col=c(Blue,Green))
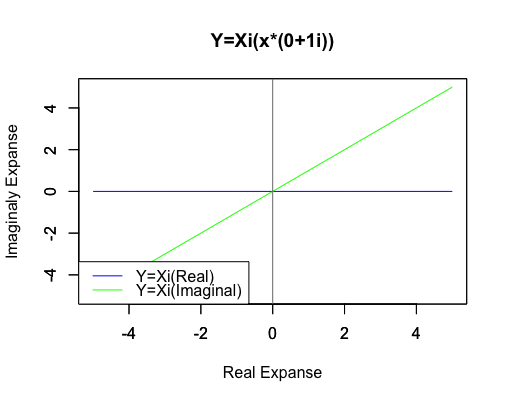
一次関数Y=Xi(x*(0+1i))
# タイトル定義
Main_title<-c("Y=Xi(x*(0+1i))")
x_title<-c("Real Expanse")
y_title<-c("Imaginaly Expanse")
# グラフのスケール決定
gs_x<-c(-5,5)
gs_y<-c(-5,5)
x0=c(-5:5)
# 関数1
f1_name<-c("Y=Xi(Real)")
f1<-function(x){x*(0+1i)}
y1<-Re(f1(x0))
# 関数2
f2_name<-c("Y=Xi(Imaginal)")
y2<-Im(f1(x0))
# グラフの色の決定
Black<-rgb(0,0,0)
Red<-rgb(1,0,0)
Magenta<-rgb(1,0,1)
Blue<-rgb(0,0,1)
Green<-rgb(0,1,0)
Cyan<-rgb(0,1,1)
Yellow<-rgb(1,1,0)
Gray<-"#777777"
# グラフ描画
plot(x0,y1,xlim=gs_x,ylim=gs_y,type="l",col=Blue, main=Main_title,xlab=x_title,ylab=y_title)
par(new=T)#上書き指定
plot(x0,y2,xlim=gs_x,ylim=gs_y,type="l",col=Green, main="",xlab="",ylab="")
# 基準線
# abline(h=0,,col=Gray)
abline(v=0,,col=Gray)
# 凡例描画
legend("bottomleft", legend=c(f1_name,f2_name),lty=c(1,1),col=c(Blue,Green))
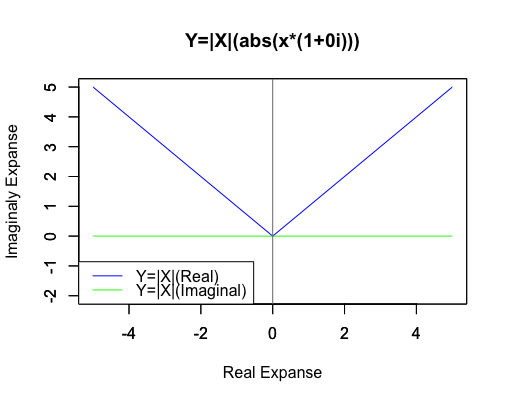
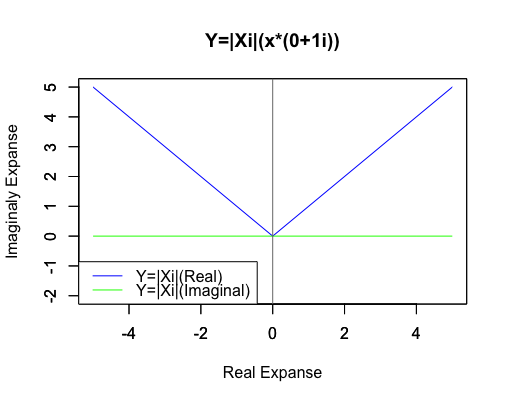
両関数の原点からの距離絶対値を求めると一致します。ここで絶対値(Absolute value)の概念(Concept)すなわち「その数から符号を除去したものが絶対値」という考え方をを導入(Intoroduce)しておきましょう。三平方の定理により(0,0)と(a,b)の距離はsqrt(a2+b2)で求められますが、特にもしくはb=0の場合に慣れ親しんでいる実数の絶対値の定義と一致します。
【初心者向け】ピタゴラスの定理あるいは三平方の定理からの出発
一次関数Y=|X|(abs(x*(1+0i)))
# タイトル定義
Main_title<-c("Y=|X|(abs(x*(1+0i)))")
x_title<-c("Real Expanse")
y_title<-c("Imaginaly Expanse")
# グラフのスケール決定
gs_x<-c(-5,5)
gs_y<-c(-2,5)
x0=c(-5:5)
# 関数1
f1_name<-c("Y=|X|(Real)")
f1<-function(x){abs(x*(1+0i))}
y1<-Re(f1(x0))
# 関数2
f2_name<-c("Y=|X|(Imaginal)")
y2<-Im(f1(x0))
# グラフの色の決定
Black<-rgb(0,0,0)
Red<-rgb(1,0,0)
Magenta<-rgb(1,0,1)
Blue<-rgb(0,0,1)
Green<-rgb(0,1,0)
Cyan<-rgb(0,1,1)
Yellow<-rgb(1,1,0)
Gray<-"#777777"
# グラフ描画
plot(x0,y1,xlim=gs_x,ylim=gs_y,type="l",col=Blue, main=Main_title,xlab=x_title,ylab=y_title)
par(new=T)#上書き指定
plot(x0,y2,xlim=gs_x,ylim=gs_y,type="l",col=Green, main="",xlab="",ylab="")
# 基準線
# abline(h=0,,col=Gray)
abline(v=0,,col=Gray)
# 凡例描画
legend("bottomleft", legend=c(f1_name,f2_name),lty=c(1,1),col=c(Blue,Green))
一次関数Y=|Xi|(x*(0+1i))
# タイトル定義
Main_title<-c("Y=|Xi|(x*(0+1i))")
x_title<-c("Real Expanse")
y_title<-c("Imaginaly Expanse")
# グラフのスケール決定
gs_x<-c(-5,5)
gs_y<-c(-2,5)
x0=c(-5:5)
# 関数1
f1_name<-c("Y=|Xi|(Real)")
f1<-function(x){abs(x*(0+1i))}
y1<-Re(f1(x0))
# 関数2
f2_name<-c("Y=|Xi|(Imaginal)")
y2<-Im(f1(x0))
# グラフの色の決定
Black<-rgb(0,0,0)
Red<-rgb(1,0,0)
Magenta<-rgb(1,0,1)
Blue<-rgb(0,0,1)
Green<-rgb(0,1,0)
Cyan<-rgb(0,1,1)
Yellow<-rgb(1,1,0)
Gray<-"#777777"
# グラフ描画
plot(x0,y1,xlim=gs_x,ylim=gs_y,type="l",col=Blue, main=Main_title,xlab=x_title,ylab=y_title)
par(new=T)#上書き指定
plot(x0,y2,xlim=gs_x,ylim=gs_y,type="l",col=Green, main="",xlab="",ylab="")
# 基準線
# abline(h=0,,col=Gray)
abline(v=0,,col=Gray)
# 凡例描画
legend("bottomleft", legend=c(f1_name,f2_name),lty=c(1,1),col=c(Blue,Green))
二次関数上における展開
ここで初めて「2乗すると-1になる」Xi(x*(1+0i))という数の特徴が表面化してくる訳です。
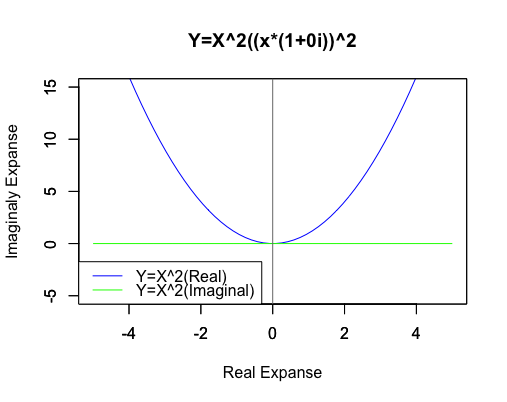
2次関数Y=X^2((x*(1+0i))^2)
# タイトル定義
Main_title<-c("Y=X^2((x*(1+0i))^2")
x_title<-c("Real Expanse")
y_title<-c("Imaginaly Expanse")
# グラフのスケール決定
gs_x<-c(-5,5)
gs_y<-c(-5,15)
x0=seq(-5,5,length=60)
# 関数1
f1_name<-c("Y=X^2(Real)")
f1<-function(x){(x*(1+0i))^2}
y1<-Re(f1(x0))
# 関数2
f2_name<-c("Y=X^2(Imaginal)")
y2<-Im(f1(x0))
# グラフの色の決定
Black<-rgb(0,0,0)
Red<-rgb(1,0,0)
Magenta<-rgb(1,0,1)
Blue<-rgb(0,0,1)
Green<-rgb(0,1,0)
Cyan<-rgb(0,1,1)
Yellow<-rgb(1,1,0)
Gray<-"#777777"
# グラフ描画
plot(x0,y1,xlim=gs_x,ylim=gs_y,type="l",col=Blue, main=Main_title,xlab=x_title,ylab=y_title)
par(new=T)#上書き指定
plot(x0,y2,xlim=gs_x,ylim=gs_y,type="l",col=Green, main="",xlab="",ylab="")
# 基準線
# abline(h=0,,col=Gray)
abline(v=0,,col=Gray)
# 凡例描画
legend("bottomleft", legend=c(f1_name,f2_name),lty=c(1,1),col=c(Blue,Green))
描画対象が曲線になった途端「解像度問題(どれくらい滑らかに描くか)」問題が急浮上してきますね。ここではとりあえず「-5から5の区間を60分割」路線で進めます。
2次関数Y=X^2((x*(1+0i))^2)の描画解像度
quadratic_function_01<-function(N0){

# タイトル定義
Main_title<-c("Y=X^2((x*(1+0i))^2")
x_title<-c("Real Expanse")
y_title<-c("Imaginaly Expanse")
# グラフのスケール決定
gs_x<-c(-5,5)
gs_y<-c(-5,15)
x0=seq(-5,5,length=N0)
# 関数1
f1_name<-c("Y=X^2(Real)")
f1<-function(x){(x*(1+0i))^2}
y1<-Re(f1(x0))
# 関数2
f2_name<-c("Y=X^2(Imaginal)")
y2<-Im(f1(x0))
# グラフの色の決定
Black<-rgb(0,0,0)
Red<-rgb(1,0,0)
Magenta<-rgb(1,0,1)
Blue<-rgb(0,0,1)
Green<-rgb(0,1,0)
Cyan<-rgb(0,1,1)
Yellow<-rgb(1,1,0)
Gray<-"#777777"
# グラフ描画
plot(x0,y1,xlim=gs_x,ylim=gs_y,type="l",col=Blue, main=Main_title,xlab=x_title,ylab=y_title)
par(new=T)#上書き指定
plot(x0,y2,xlim=gs_x,ylim=gs_y,type="l",col=Green, main="",xlab="",ylab="")
# 基準線
# abline(h=0,,col=Gray)
abline(v=0,,col=Gray)
# 凡例描画
legend("bottomleft", legend=c(f1_name,f2_name),lty=c(1,1),col=c(Blue,Green))
}

library("animation")
Time_Code=c(3,5,7,15,30,60,30,15,7,5)
saveGIF({
for (i in Time_Code){
  quadratic_function_01(i)
}
}, interval = 0.1, movie.name = "TEST.gif")
ところで、ここで扱う冪(べき)乗算において指数関数的に目盛りの単位が増大していく問題と、マクローリン展開が「好きなだけ微細な桁数まで近似値を算出する計算」である事の対比は、指数関数でいうa^xと1/(a^x)の関係に対応しています。もちろんマクローリン展開の場合はf(x)=Σ(n=0~∞)(f(n)(0)/n!*x^n)=f(0)+f′(0)x+f′′(0)/2!*x^2+f(n)(0)/n!*x^n…と、微分と絡めもっと精緻な考察を経る訳ですが…
【Rで球面幾何学】オイラーの公式を導出したマクローリン級数の限界?
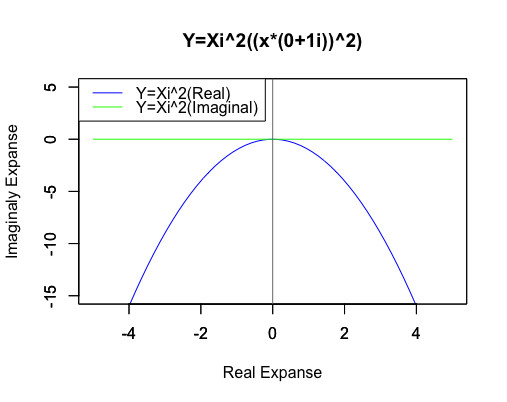
2次関数Y=Xi^2((x*(0+1i))^2)
# タイトル定義
Main_title<-c("Y=Xi^2((x*(0+1i))^2)")
x_title<-c("Real Expanse")
y_title<-c("Imaginaly Expanse")
# グラフのスケール決定
gs_x<-c(-5,5)
gs_y<-c(-15,5)
x0=seq(-5,5,length=60)
# 関数1
f1_name<-c("Y=Xi^2(Real)")
f1<-function(x){(x*(0+1i))^2}
y1<-Re(f1(x0))
# 関数2
f2_name<-c("Y=Xi^2(Imaginal)")
y2<-Im(f1(x0))
# グラフの色の決定
Black<-rgb(0,0,0)
Red<-rgb(1,0,0)
Magenta<-rgb(1,0,1)
Blue<-rgb(0,0,1)
Green<-rgb(0,1,0)
Cyan<-rgb(0,1,1)
Yellow<-rgb(1,1,0)
Gray<-"#777777"
# グラフ描画
plot(x0,y1,xlim=gs_x,ylim=gs_y,type="l",col=Blue, main=Main_title,xlab=x_title,ylab=y_title)
par(new=T)#上書き指定
plot(x0,y2,xlim=gs_x,ylim=gs_y,type="l",col=Green, main="",xlab="",ylab="")
# 基準線
# abline(h=0,,col=Gray)
abline(v=0,,col=Gray)
# 凡例描画
legend("topleft", legend=c(f1_name,f2_name),lty=c(1,1),col=c(Blue,Green))
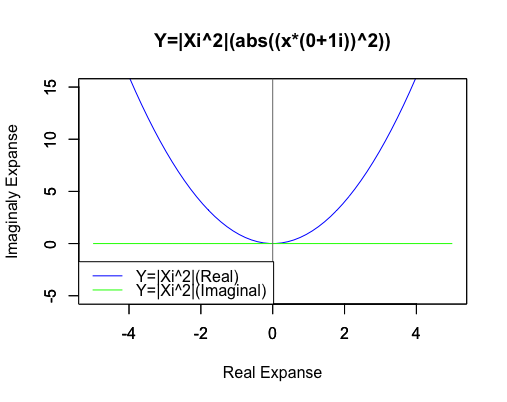
やはり両関数の「絶対値(原点からの距離)」は一致します。そして実数の2次関数の値は絶対値そのもの…
2次関数Y=|X^2|((abs(x*(1+0i))^2))
# タイトル定義
Main_title<-c("Y=|X^2|((abs(x*(1+0i))^2)")
x_title<-c("Real Expanse")
y_title<-c("Imaginaly Expanse")
# グラフのスケール決定
gs_x<-c(-5,5)
gs_y<-c(-5,15)
x0=seq(-5,5,length=60)
# 関数1
f1_name<-c("Y=|X^2|(Real)")
f1<-function(x){(abs(x*(1+0i))^2)}
y1<-Re(f1(x0))
# 関数2
f2_name<-c("Y=|X^2|(Imaginal)")
y2<-Im(f1(x0))
# グラフの色の決定
Black<-rgb(0,0,0)
Red<-rgb(1,0,0)
Magenta<-rgb(1,0,1)
Blue<-rgb(0,0,1)
Green<-rgb(0,1,0)
Cyan<-rgb(0,1,1)
Yellow<-rgb(1,1,0)
Gray<-"#777777"
# グラフ描画
plot(x0,y1,xlim=gs_x,ylim=gs_y,type="l",col=Blue, main=Main_title,xlab=x_title,ylab=y_title)
par(new=T)#上書き指定
plot(x0,y2,xlim=gs_x,ylim=gs_y,type="l",col=Green, main="",xlab="",ylab="")
# 基準線
# abline(h=0,,col=Gray)
abline(v=0,,col=Gray)
# 凡例描画
legend("bottomleft", legend=c(f1_name,f2_name),lty=c(1,1),col=c(Blue,Green))
2次関数Y=|Xi^2|((abs(x*(0+1i))^2))
# タイトル定義
Main_title<-c("Y=|Xi^2|(abs((x*(0+1i))^2))")
x_title<-c("Real Expanse")
y_title<-c("Imaginaly Expanse")
# グラフのスケール決定
gs_x<-c(-5,5)
gs_y<-c(-5,15)
x0=seq(-5,5,length=60)
# 関数1
f1_name<-c("Y=|Xi^2|(Real)")
f1<-function(x){(abs(x*(0+1i))^2)}
y1<-Re(f1(x0))
# 関数2
f2_name<-c("Y=|Xi^2|(Imaginal)")
y2<-Im(f1(x0))
# グラフの色の決定
Black<-rgb(0,0,0)
Red<-rgb(1,0,0)
Magenta<-rgb(1,0,1)
Blue<-rgb(0,0,1)
Green<-rgb(0,1,0)
Cyan<-rgb(0,1,1)
Yellow<-rgb(1,1,0)
Gray<-"#777777"
# グラフ描画
plot(x0,y1,xlim=gs_x,ylim=gs_y,type="l",col=Blue, main=Main_title,xlab=x_title,ylab=y_title)
par(new=T)#上書き指定
plot(x0,y2,xlim=gs_x,ylim=gs_y,type="l",col=Green, main="",xlab="",ylab="")
# 基準線
# abline(h=0,,col=Gray)
abline(v=0,,col=Gray)
# 凡例描画
legend("bottomleft", legend=c(f1_name,f2_name),lty=c(1,1),col=c(Blue,Green))
三次関数以上の展開
3次関数以上では実数のみの関数と複素数も含む関数の振る舞いの相違がさらに顕著な形で現れてきます。
3次関数Y=X^3(x*((1+0i))^3)
# タイトル定義
Main_title<-c("Y=X^3((x*(1+0i))^3")
x_title<-c("Real Expanse")
y_title<-c("Imaginaly Expanse")
# グラフのスケール決定
gs_x<-c(-5,5)
gs_y<-c(-60,60)
x0=seq(-5,5,length=60)
# 関数1
f1_name<-c("Y=X^3(Real)")
f1<-function(x){(x*(1+0i))^3}
y1<-Re(f1(x0))
# 関数2
f2_name<-c("Y=X^3(Imaginal)")
y2<-Im(f1(x0))
# グラフの色の決定
Black<-rgb(0,0,0)
Red<-rgb(1,0,0)
Magenta<-rgb(1,0,1)
Blue<-rgb(0,0,1)
Green<-rgb(0,1,0)
Cyan<-rgb(0,1,1)
Yellow<-rgb(1,1,0)
Gray<-"#777777"
# グラフ描画
plot(x0,y1,xlim=gs_x,ylim=gs_y,type="l",col=Blue, main=Main_title,xlab=x_title,ylab=y_title)
par(new=T)#上書き指定
plot(x0,y2,xlim=gs_x,ylim=gs_y,type="l",col=Green, main="",xlab="",ylab="")
# 基準線
# abline(h=0,,col=Gray)
abline(v=0,,col=Gray)
# 凡例描画
legend("bottomleft", legend=c(f1_name,f2_name),lty=c(1,1),col=c(Blue,Green))
3次関数Y=Xi^3((x*(0+1i))^3)
# タイトル定義
Main_title<-c("Y=Xi^3((x*(0+1i))^3)")
x_title<-c("Real Expanse")
y_title<-c("Imaginaly Expanse")
# グラフのスケール決定
gs_x<-c(-5,5)
gs_y<-c(-60,60)
x0=seq(-5,5,length=60)
# 関数1
f1_name<-c("Y=Xi^3(Real)")
f1<-function(x){(x*(0+1i))^3}
y1<-Re(f1(x0))
# 関数2
f2_name<-c("Y=Xi^3(Imaginal)")
y2<-Im(f1(x0))
# グラフの色の決定
Black<-rgb(0,0,0)
Red<-rgb(1,0,0)
Magenta<-rgb(1,0,1)
Blue<-rgb(0,0,1)
Green<-rgb(0,1,0)
Cyan<-rgb(0,1,1)
Yellow<-rgb(1,1,0)
Gray<-"#777777"
# グラフ描画
plot(x0,y1,xlim=gs_x,ylim=gs_y,type="l",col=Blue, main=Main_title,xlab=x_title,ylab=y_title)
par(new=T)#上書き指定
plot(x0,y2,xlim=gs_x,ylim=gs_y,type="l",col=Green, main="",xlab="",ylab="")
# 基準線
# abline(h=0,,col=Gray)
abline(v=0,,col=Gray)
# 凡例描画
legend("bottomleft", legend=c(f1_name,f2_name),lty=c(1,1),col=c(Blue,Green))
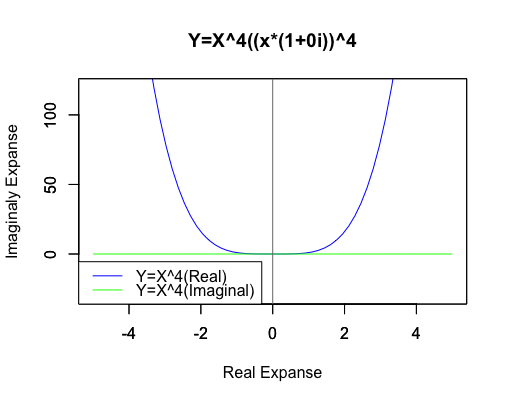
4次関数Y=X^4((x*(1+0i))^4)
# タイトル定義
Main_title<-c("Y=X^4((x*(1+0i))^4")
x_title<-c("Real Expanse")
y_title<-c("Imaginaly Expanse")
# グラフのスケール決定
gs_x<-c(-5,5)
gs_y<-c(-30,120)
x0=seq(-5,5,length=60)
# 関数1
f1_name<-c("Y=X^4(Real)")
f1<-function(x){(x*(1+0i))^4}
y1<-Re(f1(x0))
# 関数2
f2_name<-c("Y=X^4(Imaginal)")
y2<-Im(f1(x0))
# グラフの色の決定
Black<-rgb(0,0,0)
Red<-rgb(1,0,0)
Magenta<-rgb(1,0,1)
Blue<-rgb(0,0,1)
Green<-rgb(0,1,0)
Cyan<-rgb(0,1,1)
Yellow<-rgb(1,1,0)
Gray<-"#777777"
# グラフ描画
plot(x0,y1,xlim=gs_x,ylim=gs_y,type="l",col=Blue, main=Main_title,xlab=x_title,ylab=y_title)
par(new=T)#上書き指定
plot(x0,y2,xlim=gs_x,ylim=gs_y,type="l",col=Green, main="",xlab="",ylab="")
# 基準線
# abline(h=0,,col=Gray)
abline(v=0,,col=Gray)
# 凡例描画
legend("bottomleft", legend=c(f1_name,f2_name),lty=c(1,1),col=c(Blue,Green))
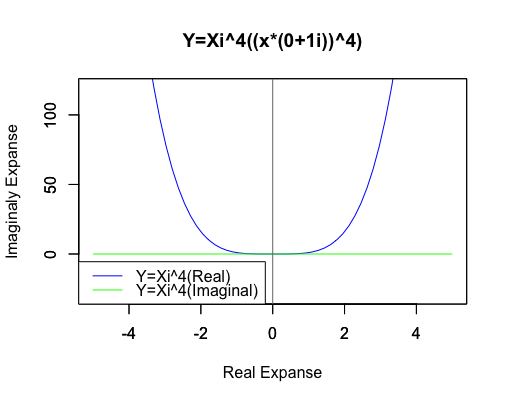
4次関数Y=Xi^4((x*(0+1i))^4)
# タイトル定義
Main_title<-c("Y=Xi^4((x*(0+1i))^4)")
x_title<-c("Real Expanse")
y_title<-c("Imaginaly Expanse")
# グラフのスケール決定
gs_x<-c(-5,5)
gs_y<-c(-30,120)
x0=seq(-5,5,length=60)
# 関数1
f1_name<-c("Y=Xi^4(Real)")
f1<-function(x){(x*(0+1i))^4}
y1<-Re(f1(x0))
# 関数2
f2_name<-c("Y=Xi^4(Imaginal)")
y2<-Im(f1(x0))
# グラフの色の決定
Black<-rgb(0,0,0)
Red<-rgb(1,0,0)
Magenta<-rgb(1,0,1)
Blue<-rgb(0,0,1)
Green<-rgb(0,1,0)
Cyan<-rgb(0,1,1)
Yellow<-rgb(1,1,0)
Gray<-"#777777"
# グラフ描画
plot(x0,y1,xlim=gs_x,ylim=gs_y,type="l",col=Blue, main=Main_title,xlab=x_title,ylab=y_title)
par(new=T)#上書き指定
plot(x0,y2,xlim=gs_x,ylim=gs_y,type="l",col=Green, main="",xlab="",ylab="")
# 基準線
# abline(h=0,,col=Gray)
abline(v=0,,col=Gray)
# 凡例描画
legend("bottomleft", legend=c(f1_name,f2_name),lty=c(1,1),col=c(Blue,Green))
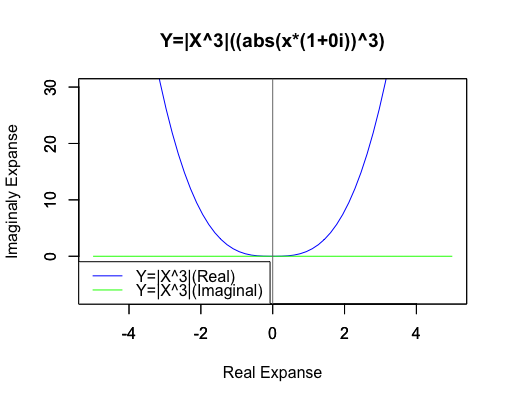
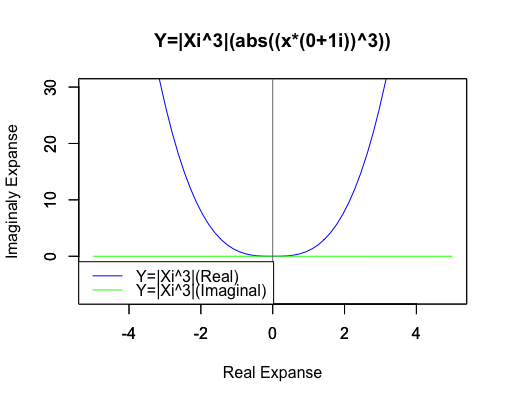
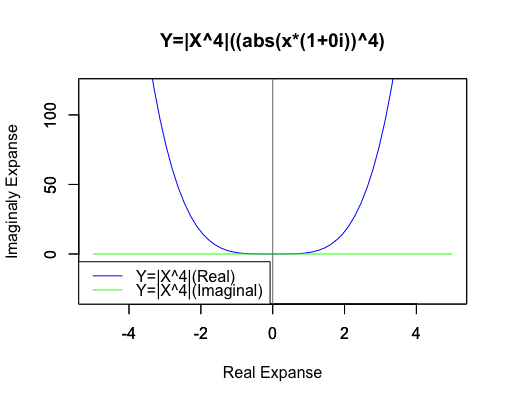
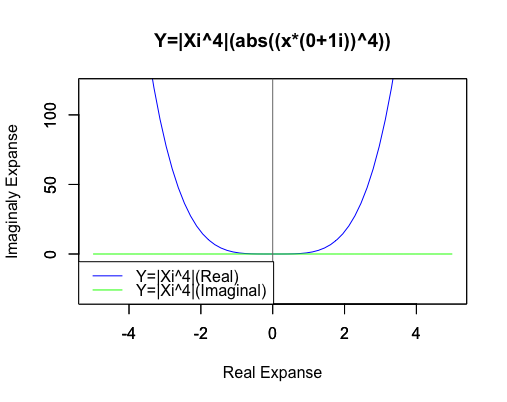
それでも両関数の絶対値はあくまで一致しているのです。
3次関数Y=|X^3|((abs(x*(1+0i))^3))
# タイトル定義
Main_title<-c("Y=|X^3|((abs(x*(1+0i))^3)")
x_title<-c("Real Expanse")
y_title<-c("Imaginaly Expanse")
# グラフのスケール決定
gs_x<-c(-5,5)
gs_y<-c(-7,30)
x0=seq(-5,5,length=60)
# 関数1
f1_name<-c("Y=|X^3|(Real)")
f1<-function(x){(abs(x*(1+0i))^3)}
y1<-Re(f1(x0))
# 関数2
f2_name<-c("Y=|X^3|(Imaginal)")
y2<-Im(f1(x0))
# グラフの色の決定
Black<-rgb(0,0,0)
Red<-rgb(1,0,0)
Magenta<-rgb(1,0,1)
Blue<-rgb(0,0,1)
Green<-rgb(0,1,0)
Cyan<-rgb(0,1,1)
Yellow<-rgb(1,1,0)
Gray<-"#777777"
# グラフ描画
plot(x0,y1,xlim=gs_x,ylim=gs_y,type="l",col=Blue, main=Main_title,xlab=x_title,ylab=y_title)
par(new=T)#上書き指定
plot(x0,y2,xlim=gs_x,ylim=gs_y,type="l",col=Green, main="",xlab="",ylab="")
# 基準線
# abline(h=0,,col=Gray)
abline(v=0,,col=Gray)
# 凡例描画
legend("bottomleft", legend=c(f1_name,f2_name),lty=c(1,1),col=c(Blue,Green))
3次関数Y=|Xi^3|((abs(x*(0+1i))^3))
# タイトル定義
Main_title<-c("Y=|Xi^3|(abs((x*(0+1i))^3))")
x_title<-c("Real Expanse")
y_title<-c("Imaginaly Expanse")
# グラフのスケール決定
gs_x<-c(-5,5)
gs_y<-c(-7,30)
x0=seq(-5,5,length=60)
# 関数1
f1_name<-c("Y=|Xi^3|(Real)")
f1<-function(x){(abs(x*(0+1i))^3)}
y1<-Re(f1(x0))
# 関数2
f2_name<-c("Y=|Xi^3|(Imaginal)")
y2<-Im(f1(x0))
# グラフの色の決定
Black<-rgb(0,0,0)
Red<-rgb(1,0,0)
Magenta<-rgb(1,0,1)
Blue<-rgb(0,0,1)
Green<-rgb(0,1,0)
Cyan<-rgb(0,1,1)
Yellow<-rgb(1,1,0)
Gray<-"#777777"
# グラフ描画
plot(x0,y1,xlim=gs_x,ylim=gs_y,type="l",col=Blue, main=Main_title,xlab=x_title,ylab=y_title)
par(new=T)#上書き指定
plot(x0,y2,xlim=gs_x,ylim=gs_y,type="l",col=Green, main="",xlab="",ylab="")
# 基準線
# abline(h=0,,col=Gray)
abline(v=0,,col=Gray)
# 凡例描画
legend("bottomleft", legend=c(f1_name,f2_name),lty=c(1,1),col=c(Blue,Green))
4次関数Y=|X^4|((abs(x*(1+0i))^4))
# タイトル定義
Main_title<-c("Y=|X^4|((abs(x*(1+0i))^4)")
x_title<-c("Real Expanse")
y_title<-c("Imaginaly Expanse")
# グラフのスケール決定
gs_x<-c(-5,5)
gs_y<-c(-30,120)
x0=seq(-5,5,length=60)
# 関数1
f1_name<-c("Y=|X^4|(Real)")
f1<-function(x){(abs(x*(1+0i))^4)}
y1<-Re(f1(x0))
# 関数2
f2_name<-c("Y=|X^4|(Imaginal)")
y2<-Im(f1(x0))
# グラフの色の決定
Black<-rgb(0,0,0)
Red<-rgb(1,0,0)
Magenta<-rgb(1,0,1)
Blue<-rgb(0,0,1)
Green<-rgb(0,1,0)
Cyan<-rgb(0,1,1)
Yellow<-rgb(1,1,0)
Gray<-"#777777"
# グラフ描画
plot(x0,y1,xlim=gs_x,ylim=gs_y,type="l",col=Blue, main=Main_title,xlab=x_title,ylab=y_title)
par(new=T)#上書き指定
plot(x0,y2,xlim=gs_x,ylim=gs_y,type="l",col=Green, main="",xlab="",ylab="")
# 基準線
# abline(h=0,,col=Gray)
abline(v=0,,col=Gray)
# 凡例描画
legend("bottomleft", legend=c(f1_name,f2_name),lty=c(1,1),col=c(Blue,Green))
4次関数Y=|Xi^4|((abs(x*(0+1i))^4))
# タイトル定義
Main_title<-c("Y=|Xi^4|(abs((x*(0+1i))^4))")
x_title<-c("Real Expanse")
y_title<-c("Imaginaly Expanse")
# グラフのスケール決定
gs_x<-c(-5,5)
gs_y<-c(-30,120)
x0=seq(-5,5,length=60)
# 関数1
f1_name<-c("Y=|Xi^4|(Real)")
f1<-function(x){(abs(x*(0+1i))^4)}
y1<-Re(f1(x0))
# 関数2
f2_name<-c("Y=|Xi^4|(Imaginal)")
y2<-Im(f1(x0))
# グラフの色の決定
Black<-rgb(0,0,0)
Red<-rgb(1,0,0)
Magenta<-rgb(1,0,1)
Blue<-rgb(0,0,1)
Green<-rgb(0,1,0)
Cyan<-rgb(0,1,1)
Yellow<-rgb(1,1,0)
Gray<-"#777777"
# グラフ描画
plot(x0,y1,xlim=gs_x,ylim=gs_y,type="l",col=Blue, main=Main_title,xlab=x_title,ylab=y_title)
par(new=T)#上書き指定
plot(x0,y2,xlim=gs_x,ylim=gs_y,type="l",col=Green, main="",xlab="",ylab="")
# 基準線
# abline(h=0,,col=Gray)
abline(v=0,,col=Gray)
# 凡例描画
legend("bottomleft", legend=c(f1_name,f2_name),lty=c(1,1),col=c(Blue,Green))
連続して眺めてみる。
こうしてみると実数のみの冪乗算では複素数部がずっと0のままに見えますが、実は指数が小数点を含む場合は結構(絶対値を実数部と一致させる為に)動いてます。まるで「達磨さんが転んだ」の様に…そう、実は平方眼(Square Grid)四象限のうちX座標かY座標の符号がマイナスの領域では既に虚数の挙動が観測されていたものの「誤差」として切り捨てられていただけだったのです。
【Rで球面幾何学】「半円しか描けなかった」世界の思い出?
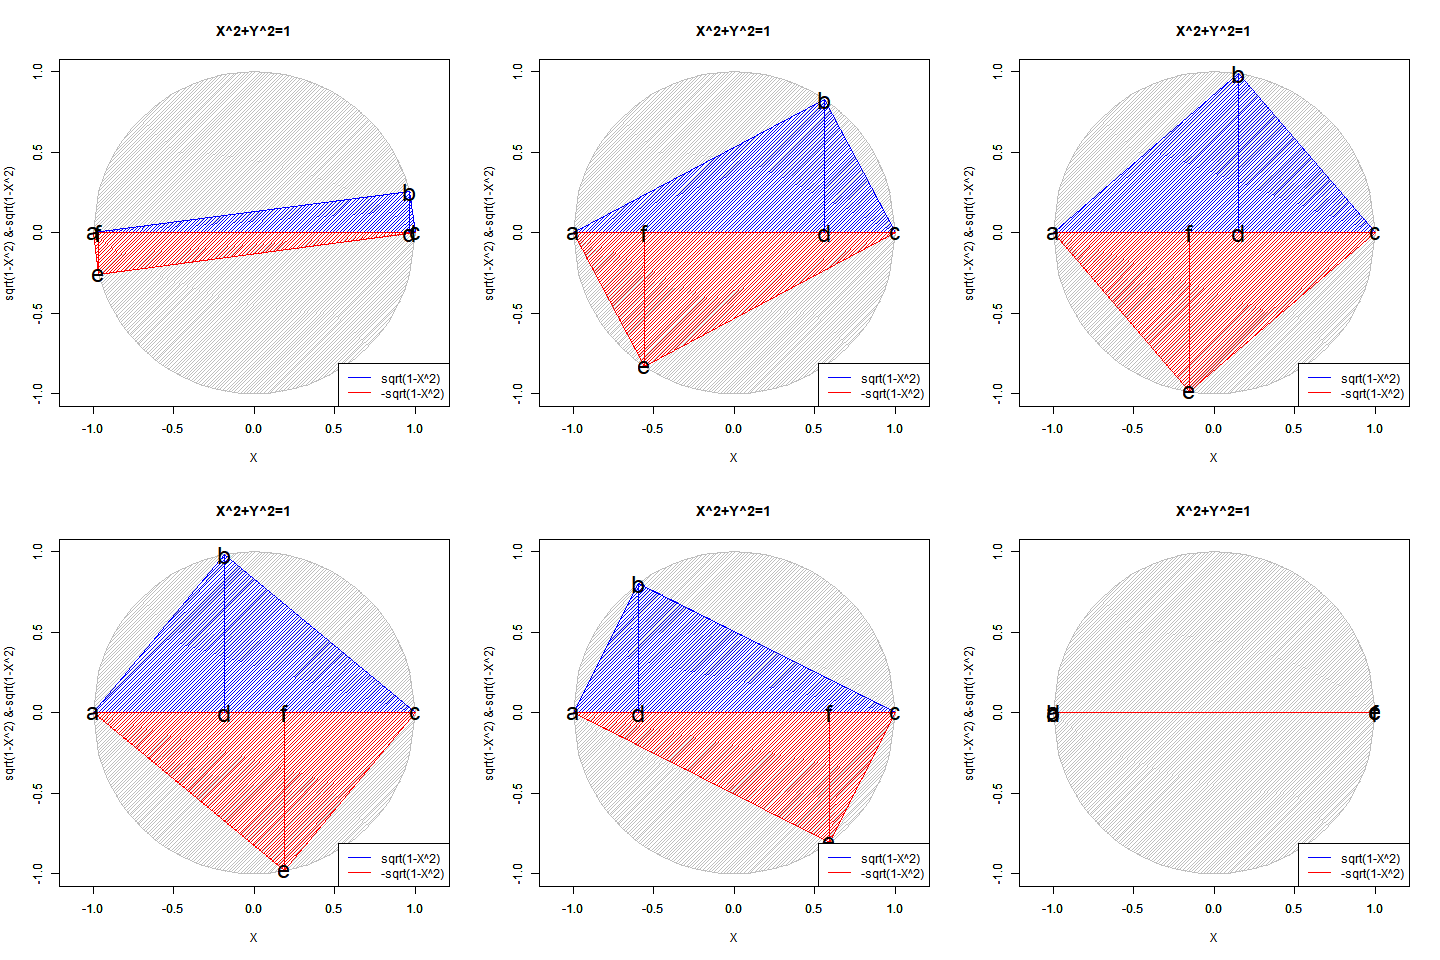
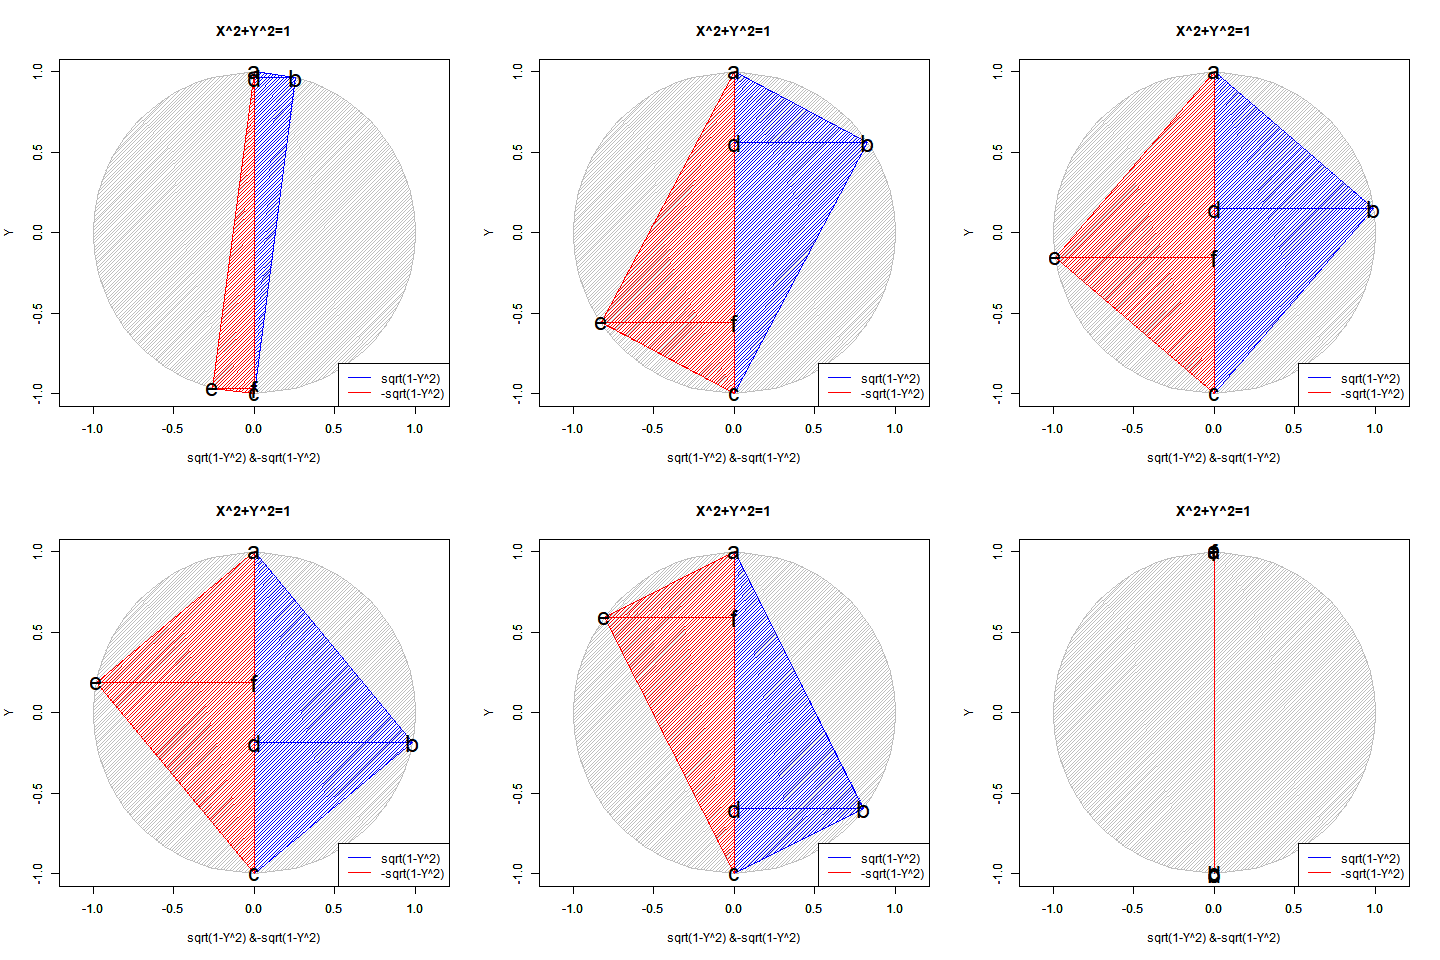
N次関数Y=X^N((x*(1+0i))^N) (N=0~4)
Real_function_01<-function(N0){

# タイトル定義
Main_title<-c("Y=X^N((x*(1+0i))^N (N=0~4)")
x_title<-c("Real Expanse")
y_title<-c("Imaginaly Expanse")
# グラフのスケール決定
gs_x<-c(-5,5)
gs_y<-c(-60,60)
x0=seq(-5,5,length=60)
# 関数1
f1_name<-c("Y=X^N(Real)")
f1<-function(x){(x*(1+0i))^N0}
y1<-Re(f1(x0))
# 関数2
f2_name<-c("Y=X^N(Imaginal)")
y2<-Im(f1(x0))
# グラフの色の決定
Black<-rgb(0,0,0)
Red<-rgb(1,0,0)
Magenta<-rgb(1,0,1)
Blue<-rgb(0,0,1)
Green<-rgb(0,1,0)
Cyan<-rgb(0,1,1)
Yellow<-rgb(1,1,0)
Gray<-"#777777"
# グラフ描画
plot(x0,y1,xlim=gs_x,ylim=gs_y,type="l",col=Blue, main=Main_title,xlab=x_title,ylab=y_title)
par(new=T)#上書き指定
plot(x0,y2,xlim=gs_x,ylim=gs_y,type="l",col=Green, main="",xlab="",ylab="")
# 基準線
# abline(h=0,,col=Gray)
abline(v=0,,col=Gray)
# 凡例描画
legend("bottomleft", legend=c(f1_name,f2_name),lty=c(1,1),col=c(Blue,Green))
}

library("animation")
Time_Code=c(seq(0,4,length=40),seq(4,0,length=40))
saveGIF({
for (i in Time_Code){
  Real_function_01(i)
}
}, interval = 0.1, movie.name = "TEST.gif")
N次関数Y=X^N((x*(1+0i))^N) (N=1~2)
Real_function_01<-function(N0){

# タイトル定義
Main_title<-c("Y=X^N((x*(1+0i))^N (N=1~2)")
x_title<-c("Real Expanse")
y_title<-c("Imaginaly Expanse")
# グラフのスケール決定
gs_x<-c(-5,5)
gs_y<-c(-5,5)
x0=seq(-5,5,length=60)
# 関数1
f1_name<-c("Y=X^N(Real)")
f1<-function(x){(x*(1+0i))^N0}
y1<-Re(f1(x0))
# 関数2
f2_name<-c("Y=X^N(Imaginal)")
y2<-Im(f1(x0))
# グラフの色の決定
Black<-rgb(0,0,0)
Red<-rgb(1,0,0)
Magenta<-rgb(1,0,1)
Blue<-rgb(0,0,1)
Green<-rgb(0,1,0)
Cyan<-rgb(0,1,1)
Yellow<-rgb(1,1,0)
Gray<-"#777777"
# グラフ描画
plot(x0,y1,xlim=gs_x,ylim=gs_y,type="l",col=Blue, main=Main_title,xlab=x_title,ylab=y_title)
par(new=T)#上書き指定
plot(x0,y2,xlim=gs_x,ylim=gs_y,type="l",col=Green, main="",xlab="",ylab="")
# 基準線
# abline(h=0,,col=Gray)
abline(v=0,,col=Gray)
# 凡例描画
legend("bottomleft", legend=c(f1_name,f2_name),lty=c(1,1),col=c(Blue,Green))
}

library("animation")
Time_Code=c(seq(1,2,length=10),seq(2,1,length=10))
saveGIF({
for (i in Time_Code){
  Real_function_01(i)
}
}, interval = 0.1, movie.name = "TEST.gif")
N次関数Y=X^N((x*(1+0i))^N) (N=2~3)
Real_function_01<-function(N0){

# タイトル定義
Main_title<-c("Y=X^N((x*(1+0i))^N (N=2~3)")
x_title<-c("Real Expanse")
y_title<-c("Imaginaly Expanse")
# グラフのスケール決定
gs_x<-c(-5,5)
gs_y<-c(-30,30)
x0=seq(-5,5,length=60)
# 関数1
f1_name<-c("Y=X^N(Real)")
f1<-function(x){(x*(1+0i))^N0}
y1<-Re(f1(x0))
# 関数2
f2_name<-c("Y=X^N(Imaginal)")
y2<-Im(f1(x0))
# グラフの色の決定
Black<-rgb(0,0,0)
Red<-rgb(1,0,0)
Magenta<-rgb(1,0,1)
Blue<-rgb(0,0,1)
Green<-rgb(0,1,0)
Cyan<-rgb(0,1,1)
Yellow<-rgb(1,1,0)
Gray<-"#777777"
# グラフ描画
plot(x0,y1,xlim=gs_x,ylim=gs_y,type="l",col=Blue, main=Main_title,xlab=x_title,ylab=y_title)
par(new=T)#上書き指定
plot(x0,y2,xlim=gs_x,ylim=gs_y,type="l",col=Green, main="",xlab="",ylab="")
# 基準線
# abline(h=0,,col=Gray)
abline(v=0,,col=Gray)
# 凡例描画
legend("bottomleft", legend=c(f1_name,f2_name),lty=c(1,1),col=c(Blue,Green))
}

library("animation")
Time_Code=c(seq(2,3,length=10),seq(3,2,length=10))
saveGIF({
for (i in Time_Code){
  Real_function_01(i)
}
}, interval = 0.1, movie.name = "TEST.gif")
N次関数Y=X^N((x*(1+0i))^N) (N=3~4)
Real_function_01<-function(N0){

# タイトル定義
Main_title<-c("Y=X^N((x*(1+0i))^N (N=3~4)")
x_title<-c("Real Expanse")
y_title<-c("Imaginaly Expanse")
# グラフのスケール決定
gs_x<-c(-5,5)
gs_y<-c(-30,30)
x0=seq(-5,5,length=60)
# 関数1
f1_name<-c("Y=X^N(Real)")
f1<-function(x){(x*(1+0i))^N0}
y1<-Re(f1(x0))
# 関数2
f2_name<-c("Y=X^N(Imaginal)")
y2<-Im(f1(x0))
# グラフの色の決定
Black<-rgb(0,0,0)
Red<-rgb(1,0,0)
Magenta<-rgb(1,0,1)
Blue<-rgb(0,0,1)
Green<-rgb(0,1,0)
Cyan<-rgb(0,1,1)
Yellow<-rgb(1,1,0)
Gray<-"#777777"
# グラフ描画
plot(x0,y1,xlim=gs_x,ylim=gs_y,type="l",col=Blue, main=Main_title,xlab=x_title,ylab=y_title)
par(new=T)#上書き指定
plot(x0,y2,xlim=gs_x,ylim=gs_y,type="l",col=Green, main="",xlab="",ylab="")
# 基準線
# abline(h=0,,col=Gray)
abline(v=0,,col=Gray)
# 凡例描画
legend("bottomleft", legend=c(f1_name,f2_name),lty=c(1,1),col=c(Blue,Green))
}

library("animation")
Time_Code=c(seq(3,4,length=10),seq(4,3,length=10))
saveGIF({
for (i in Time_Code){
  Real_function_01(i)
}
}, interval = 0.1, movie.name = "TEST.gif")
そして複素数を含む冪乗算では奇関数と偶関数の変わり目に「実数部と虚数部の交代」が起こるのです。
N次関数Y=X^N((x*(0+1i))^N) (N=0~4)
Real_function_01<-function(N0){

# タイトル定義
Main_title<-c("Y=X^N((x*(0+1i))^N (N=0~4)")
x_title<-c("Real Expanse")
y_title<-c("Imaginaly Expanse")
# グラフのスケール決定
gs_x<-c(-5,5)
gs_y<-c(-60,60)
x0=seq(-5,5,length=60)
# 関数1
f1_name<-c("Y=X^N(Real)")
f1<-function(x){(x*(0+1i))^N0}
y1<-Re(f1(x0))
# 関数2
f2_name<-c("Y=X^N(Imaginal)")
y2<-Im(f1(x0))
# グラフの色の決定
Black<-rgb(0,0,0)
Red<-rgb(1,0,0)
Magenta<-rgb(1,0,1)
Blue<-rgb(0,0,1)
Green<-rgb(0,1,0)
Cyan<-rgb(0,1,1)
Yellow<-rgb(1,1,0)
Gray<-"#777777"
# グラフ描画
plot(x0,y1,xlim=gs_x,ylim=gs_y,type="l",col=Blue, main=Main_title,xlab=x_title,ylab=y_title)
par(new=T)#上書き指定
plot(x0,y2,xlim=gs_x,ylim=gs_y,type="l",col=Green, main="",xlab="",ylab="")
# 基準線
# abline(h=0,,col=Gray)
abline(v=0,,col=Gray)
# 凡例描画
legend("bottomleft", legend=c(f1_name,f2_name),lty=c(1,1),col=c(Blue,Green))
}

library("animation")
Time_Code=c(seq(0,4,length=40),seq(4,0,length=40))
saveGIF({
for (i in Time_Code){
  Real_function_01(i)
}
}, interval = 0.1, movie.name = "TEST.gif")
N次関数Y=Xi^N((x*(0+1i))^N) (N=1~2)
Real_function_01<-function(N0){

# タイトル定義
Main_title<-c("Y=X^N((x*(0+1i))^N (N=1~2)")
x_title<-c("Real Expanse")
y_title<-c("Imaginaly Expanse")
# グラフのスケール決定
gs_x<-c(-5,5)
gs_y<-c(-5,5)
x0=seq(-5,5,length=60)
# 関数1
f1_name<-c("Y=Xi^N(Real)")
f1<-function(x){(x*(0+1i))^N0}
y1<-Re(f1(x0))
# 関数2
f2_name<-c("Y=Xi^N(Imaginal)")
y2<-Im(f1(x0))
# グラフの色の決定
Black<-rgb(0,0,0)
Red<-rgb(1,0,0)
Magenta<-rgb(1,0,1)
Blue<-rgb(0,0,1)
Green<-rgb(0,1,0)
Cyan<-rgb(0,1,1)
Yellow<-rgb(1,1,0)
Gray<-"#777777"
# グラフ描画
plot(x0,y1,xlim=gs_x,ylim=gs_y,type="l",col=Blue, main=Main_title,xlab=x_title,ylab=y_title)
par(new=T)#上書き指定
plot(x0,y2,xlim=gs_x,ylim=gs_y,type="l",col=Green, main="",xlab="",ylab="")
# 基準線
# abline(h=0,,col=Gray)
abline(v=0,,col=Gray)
# 凡例描画
legend("bottomleft", legend=c(f1_name,f2_name),lty=c(1,1),col=c(Blue,Green))
}

library("animation")
Time_Code=c(seq(1,2,length=10),seq(2,1,length=10))
saveGIF({
for (i in Time_Code){
  Real_function_01(i)
}
}, interval = 0.1, movie.name = "TEST.gif")
N次関数Y=Xi^N((x*(1+0i))^N) (N=2~3)
Real_function_01<-function(N0){

# タイトル定義
Main_title<-c("Y=Xi^N((x*(0+1i))^N (N=2~3)")
x_title<-c("Real Expanse")
y_title<-c("Imaginaly Expanse")
# グラフのスケール決定
gs_x<-c(-5,5)
gs_y<-c(-30,30)
x0=seq(-5,5,length=60)
# 関数1
f1_name<-c("Y=Xi^N(Real)")
f1<-function(x){(x*(0+1i))^N0}
y1<-Re(f1(x0))
# 関数2
f2_name<-c("Y=Xi^N(Imaginal)")
y2<-Im(f1(x0))
# グラフの色の決定
Black<-rgb(0,0,0)
Red<-rgb(1,0,0)
Magenta<-rgb(1,0,1)
Blue<-rgb(0,0,1)
Green<-rgb(0,1,0)
Cyan<-rgb(0,1,1)
Yellow<-rgb(1,1,0)
Gray<-"#777777"
# グラフ描画
plot(x0,y1,xlim=gs_x,ylim=gs_y,type="l",col=Blue, main=Main_title,xlab=x_title,ylab=y_title)
par(new=T)#上書き指定
plot(x0,y2,xlim=gs_x,ylim=gs_y,type="l",col=Green, main="",xlab="",ylab="")
# 基準線
# abline(h=0,,col=Gray)
abline(v=0,,col=Gray)
# 凡例描画
legend("bottomleft", legend=c(f1_name,f2_name),lty=c(1,1),col=c(Blue,Green))
}

library("animation")
Time_Code=c(seq(2,3,length=10),seq(3,2,length=10))
saveGIF({
for (i in Time_Code){
  Real_function_01(i)
}
}, interval = 0.1, movie.name = "TEST.gif")
N次関数Y=X^N((x*(1+0i))^N) (N=3~4)
Real_function_01<-function(N0){

# タイトル定義
Main_title<-c("Y=Xi^N((x*(0+1i))^N (N=3~4)")
x_title<-c("Real Expanse")
y_title<-c("Imaginaly Expanse")
# グラフのスケール決定
gs_x<-c(-5,5)
gs_y<-c(-30,30)
x0=seq(-5,5,length=60)
# 関数1
f1_name<-c("Y=Xi^N(Real)")
f1<-function(x){(x*(0+1i))^N0}
y1<-Re(f1(x0))
# 関数2
f2_name<-c("Y=Xi^N(Imaginal)")
y2<-Im(f1(x0))
# グラフの色の決定
Black<-rgb(0,0,0)
Red<-rgb(1,0,0)
Magenta<-rgb(1,0,1)
Blue<-rgb(0,0,1)
Green<-rgb(0,1,0)
Cyan<-rgb(0,1,1)
Yellow<-rgb(1,1,0)
Gray<-"#777777"
# グラフ描画
plot(x0,y1,xlim=gs_x,ylim=gs_y,type="l",col=Blue, main=Main_title,xlab=x_title,ylab=y_title)
par(new=T)#上書き指定
plot(x0,y2,xlim=gs_x,ylim=gs_y,type="l",col=Green, main="",xlab="",ylab="")
# 基準線
# abline(h=0,,col=Gray)
abline(v=0,,col=Gray)
# 凡例描画
legend("bottomleft", legend=c(f1_name,f2_name),lty=c(1,1),col=c(Blue,Green))
}

library("animation")
Time_Code=c(seq(3,4,length=10),seq(4,3,length=10))
saveGIF({
for (i in Time_Code){
  Real_function_01(i)
}
}, interval = 0.1, movie.name = "TEST.gif")
まさにこの特徴とマクローリン展開を組み合わせる事によって、オイラーの公式e^Xi=cos(X)+sin(Xi)は証明された訳ですね。もちろん「奇関数と偶関数が無限に循環する」なるという特徴こそが、この公式が成立する前提となっています。
【Rで球面幾何学】オイラーの公式とは、そもそも何か?

半径1の単位円への収束?
ところで冪演算(Exponentiation)Y=X^NやY=Xi^Nは次元数が上がれば上がるほど増率が加速し、以下の形に収束していくのです。
- Y=±Xi^±Nの極限値はx=-1すなわち半径1の単位円の直径分({0,-1}-{0,1}),x=1
- X=±Yi^±Nの極限値はy=-1,すなわち半径1の単位円の直径分({-1,0}-{1-0}),),y=1
N次関数Y=(1+0i)X^N(N=0~8)
Real_function_01<-function(N0){

# タイトル定義
Main_title<-c("Y=(1+0i)x^N(N=0~8)")
x_title<-c("Real Expanse")
y_title<-c("Imaginaly Expanse")
# グラフのスケール決定
gs_x<-c(-5,5)
gs_y<-c(-60,60)
x0=seq(-5,5,length=60)
# 関数1
f1_name<-paste("Y=(1+0i)X^",N0,"(Real)")
f1<-function(x){(x*(1+0i))^N0}
y1<-Re(f1(x0))
# 関数2
f2_name<-paste("Y=(1+0i)X^",N0,"(Imaginal)")
y2<-Im(f1(x0))
# グラフの色の決定
Black<-rgb(0,0,0)
Red<-rgb(1,0,0)
Magenta<-rgb(1,0,1)
Blue<-rgb(0,0,1)
Green<-rgb(0,1,0)
Cyan<-rgb(0,1,1)
Yellow<-rgb(1,1,0)
Gray<-"#777777"
# グラフ描画
plot(x0,y1,xlim=gs_x,ylim=gs_y,type="l",col=Blue, main=Main_title,xlab=x_title,ylab=y_title)
par(new=T)#上書き指定
plot(x0,y2,xlim=gs_x,ylim=gs_y,type="l",col=Green, main="",xlab="",ylab="")
# 基準線
# abline(h=0,,col=Gray)
abline(v=0,,col=Gray)
# 凡例描画
legend("bottomleft", legend=c(f1_name,f2_name),lty=c(1,1),col=c(Blue,Green))
}

library("animation")
Time_Code=c(seq(0,8,length=80),seq(8,0,length=80))
saveGIF({
for (i in Time_Code){
  Real_function_01(i)
}
}, interval = 0.1, movie.name = "TEST08.gif")
N次関数Y=(0+1i)X^N(N=0~8)
Real_function_01<-function(N0){

# タイトル定義
Main_title<-c("Y=(0+1i)X^N(N=0~8)")
x_title<-c("Real Expanse")
y_title<-c("Imaginaly Expanse")
# グラフのスケール決定
gs_x<-c(-5,5)
gs_y<-c(-60,60)
x0=seq(-5,5,length=60)
# 関数1
f1_name<-paste("Y=(0+1i)X^",N0,"(Real)")
f1<-function(x){(x*(0+1i))^N0}
y1<-Re(f1(x0))
# 関数2
f2_name<-paste("Y=(0+1i)X^",N0,"(Imaginal)")
y2<-Im(f1(x0))
# グラフの色の決定
Black<-rgb(0,0,0)
Red<-rgb(1,0,0)
Magenta<-rgb(1,0,1)
Blue<-rgb(0,0,1)
Green<-rgb(0,1,0)
Cyan<-rgb(0,1,1)
Yellow<-rgb(1,1,0)
Gray<-"#777777"
# グラフ描画
plot(x0,y1,xlim=gs_x,ylim=gs_y,type="l",col=Blue, main=Main_title,xlab=x_title,ylab=y_title)
par(new=T)#上書き指定
plot(x0,y2,xlim=gs_x,ylim=gs_y,type="l",col=Green, main="",xlab="",ylab="")
# 基準線
# abline(h=0,,col=Gray)
abline(v=0,,col=Gray)
# 凡例描画
legend("bottomleft", legend=c(f1_name,f2_name),lty=c(1,1),col=c(Blue,Green))
}

library("animation")
Time_Code=c(seq(0,8,length=80),seq(8,0,length=80))
saveGIF({
for (i in Time_Code){
  Real_function_01(i)
}
}, interval = 0.1, movie.name = "TEST08i.gif")
もちろんX=Yi^NはY=log(N,base=Xi)の形に直せます。「(ただ単にX座標とY座標を入れ替えただけの)解像度粗め」設定だとこうした挙動がより明確となります。
N次関数Y=log(N,base=(1+0i)X) (N=0~8)
Real_function_01<-function(N0){

# タイトル定義
Main_title<-c("Y=log(N,base=(1+0i)X)(N=0~8)")
x_title<-c("Real Expanse")
y_title<-c("Imaginaly Expanse")
# グラフのスケール決定
gs_x<-c(-60,60)
gs_y<-c(-5,5)
x0=seq(-60,60,length=60)
# 関数1
f1_name<-paste("Y=log(",N0,",base=(1+0i)X)(Real)")
f1<-function(x){(x*(1+0i))^N0}
y1<-Re(f1(x0))
# 関数2
f2_name<-paste("Y=log(",N0,",base=(1+0i)X)(Imaginal)")
y2<-Im(f1(x0))
# グラフの色の決定
Black<-rgb(0,0,0)
Red<-rgb(1,0,0)
Magenta<-rgb(1,0,1)
Blue<-rgb(0,0,1)
Green<-rgb(0,1,0)
Cyan<-rgb(0,1,1)
Yellow<-rgb(1,1,0)
Gray<-"#777777"
# グラフ描画
plot(y1,x0,xlim=gs_x,ylim=gs_y,type="l",col=Blue, main=Main_title,xlab=x_title,ylab=y_title)
par(new=T)#上書き指定
plot(y2,x0,xlim=gs_x,ylim=gs_y,type="l",col=Green, main="",xlab="",ylab="")
# 基準線
# abline(h=0,,col=Gray)
abline(v=0,,col=Gray)
# 凡例描画
legend("bottomleft", legend=c(f1_name,f2_name),lty=c(1,1),col=c(Blue,Green))
}

library("animation")
Time_Code=c(seq(0,8,length=80),seq(8,0,length=80))
saveGIF({
for (i in Time_Code){
  Real_function_01(i)
}
}, interval = 0.1, movie.name = "TEST08rr.gif")
N次関数Y=log(N,base=(0+1i)X) (N=0~8)
Real_function_01<-function(N0){

# タイトル定義
Main_title<-c("Y=log(N,base=(0+1i)X)(N=0~8)")
x_title<-c("Real Expanse")
y_title<-c("Imaginaly Expanse")
# グラフのスケール決定
gs_x<-c(-60,60)
gs_y<-c(-5,5)
x0=seq(-60,60,length=60)
# 関数1
f1_name<-paste("Y=log(",N0,",base=(0+1i)X)(Real)")
f1<-function(x){(x*(0+1i))^N0}
y1<-Re(f1(x0))
# 関数2
f2_name<-paste("Y=log(",N0,",base=(0+1i)X)(Imaginal)")
y2<-Im(f1(x0))
# グラフの色の決定
Black<-rgb(0,0,0)
Red<-rgb(1,0,0)
Magenta<-rgb(1,0,1)
Blue<-rgb(0,0,1)
Green<-rgb(0,1,0)
Cyan<-rgb(0,1,1)
Yellow<-rgb(1,1,0)
Gray<-"#777777"
# グラフ描画
plot(y1,x0,xlim=gs_x,ylim=gs_y,type="l",col=Blue, main=Main_title,xlab=x_title,ylab=y_title)
par(new=T)#上書き指定
plot(y2,x0,xlim=gs_x,ylim=gs_y,type="l",col=Green, main="",xlab="",ylab="")
# 基準線
# abline(h=0,,col=Gray)
abline(v=0,,col=Gray)
# 凡例描画
legend("bottomleft", legend=c(f1_name,f2_name),lty=c(1,1),col=c(Blue,Green))
}

library("animation")
Time_Code=c(seq(0,8,length=80),seq(8,0,length=80))
saveGIF({
for (i in Time_Code){
  Real_function_01(i)
}
}, interval = 0.1, movie.name = "TEST08ri.gif")
おやおや、まるである種のステップ関数に収束していく様に見えますね。なるほど、これまで実数共役(Real Conjugate)の概念を私の視野から隠してきたのは、この「第一象限の実数関数では虚数部が動かない」振る舞いだったのです。そして指数関数Y=X^Nの実数部の挙動はマクローリン級数(McLaughlin Series)による近似過程そのままです。
【Rで球面幾何学】オイラーの公式を導出したマクローリン級数の限界?

さてこの話、どちらに向けて収束していくのでしょう? そんな感じで以下続報…
