目的
Python Controlで、ボード線図・ナイキスト線図・根軌跡を書く。
事前準備
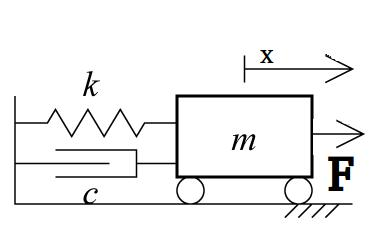
システムのモデル
ボード線図を描く
control.bode_plot
_control.bode_plot(syslist, omega=None, dB=None, Hz=None, deg=None, Plot=True, omega_limits=None, omega_num=None, *args, **kwargs)
- Parameters:
- syslist : 線形の入出力systems
- omega : 周波数のレンジ[rad/sec]
- dB : もし Trueなら, result を dBでplotする
- Hz :もし Trueなら, frequencyを Hzでplotする
- deg : もし Trueなら, phase を degreesでplotする (それ以外は radians)
- Plot : もし Trueなら, magnitude と phaseをplotする
- omega_limits:frequencyベクトルで上限を指定する。もし、 Hz=True なら Hz それ以外はrad/sで指定.
- *args, **kwargs: matplotlibのオプション(色, 線, etc)
- Returns:
- mag :振幅
- phase : 位相[radians]
- omega : frequency[rad/sec]

ナイキスト線図を描く
control.nyquist_plot
control.nyquist_plot(syslist, omega=None, Plot=True, color='b', labelFreq=0, *args, **kwargs)
- Parameters:
- syslist : 線形の入出力systems
- omega : 周波数のレンジ[rad/sec]
- dB : もし Trueなら, result を dBでplotする
- Plot : もし Trueなら, magnitude と phaseをplotする
- labelFreq:プロットのn番目の周波数ごとにラベル付けする
- *args, **kwargs: matplotlibのオプション(色, 線, etc)
- Returns:
- real : 実数部分
- imag : 虚数部分
- freq : frequency[rad/sec]

根軌跡を描く
TF(s)がnum(s)/den(s)であり、kがkvectの要素である場合、1+k*TF(s)の根を見つけることによって根軌跡を計算します。
_control.nyquist_plot(syslist, omega=None, Plot=True, color='b', labelFreq=0, *args, **kwargs)
- Parameters:
- syslist : LTI Systems
- kvect : computing diagramで使うGainのリスト
- xlim : x-軸を制御
- ylim : y-軸を制御 - Plot : もし Trueなら, magnitude と phaseをplotする
- PrintGain:Trueの場合は、根軌跡の枝の近くでマウスクリックでレポートを作り、ゲインを計算し、減衰させてプリントします
- Returns:
- rlist : 計算された根の位置、2次元配列として与えられる
- klist : gainが使用されます。 rlist引数と同じ。

サンプルソース
./secord-matlab.py
# !/usr/bin/env python
# -*- coding: utf-8 -*-

# secord.py - demonstrate some standard MATLAB commands
# RMM, 25 May 09

from matplotlib.pyplot import * #MATLAB プロット関数
from control.matlab import *    #MATLAB-like 関数

# Parameters
m = 250.0			# 質量
k = 40.0			# ばね乗数 constant
c = 60.0			# 減衰

# System matrics
A = [[0, 1.], [-k/m, -c/m]]
B = [[0], [1/m]]
C = [[1., 0]]
sys = ss(A, B, C, 0);

# Bode線図
figure(2)
mag,phase,om = bode(sys, logspace(-2, 2),Plot=True)
show()

# Nyquist線図
figure(3)
nyquist(sys, logspace(-2, 2))
show()

# 根軌跡
figure(4)
rlocus(sys)
show()
サンプルコードは以下に格納。
https://github.com/nnn112358/python-control_test
参考
PythonControlをインストールする
PythonControlで1自由度系の伝達関数を求める。
PythonControlで2自由度系の伝達関数を求める。

