今年もやります! 2022年 6/3(金)開催 Women in Data Science (WiDS) Tokyo @ IBM
2022年 6/3(金)開催のWiDS Tokyo @ IBMは、データサイエンスの分野で優れた活躍をする女性をフィーチャーした、スタンフォード大学による年次カンファレンスWiDS Worldwide Conference の一環として日本IBMで開催する地域イベントです。今年で3回目の開催となります。スピーカーは全員女性です。
ということで、今回はこちらのイベントの宣伝の意味も兼ねて、IBM CloudのNatural Language Understandingを使って今までのWiDS Tokyo@IBMのアンケートコメントを分析してみた記事です。もちろん今年もイベントのセッション内容とは何の関係もありません、、、、いやデータサイエンス誰でもできるよって部分でハート(!)は一致です。
(参考: 昨年の記念投稿(!?) )
Natural Language Understanding
Watson Natural Language Understandingは自然言語理解を使用して、テキストを分析して、概念、エンティティー、キーワード、区分、評判、感情、関係、意味役割などのメタデータをコンテンツから抽出できるIBM Cloudで提供されるAPIです。Liteプランがあるので、制限がありますがお試しで無料で使用が可能です。
最近はオープンソースのライブラリーでこの程度の自然言語処理は結構できるようになりましたが、既に学習済みで簡単に使える、さらにカスタムモデルも使用できますので、自力でやるよりは若干簡単にできます。
WiDS Tokyo@IBMのアンケートコメントを分析
WiDS Tokyo@IBMではセッション毎、最後のイベント全体でオンラインでアンケートをとっています。今回は過去2回分の「フリーコメント」欄に書かれたその文章に対してNatural Language Understandingを使用してキーワード、センチメントを取得し、ワードクラウドを作ったり、どんなポジティブコメントがあったかなどをpythonを使って分析してみました。
以下がその手順と結果です。
結果のみ見たい方は --今までのwids-tokyoibmのアンケートコメントを分析結果--へ飛んでください。
1. Natural Language Understandingサービスの作成
1.1 IBM Cloudにログイン
https://cloud.ibm.com よりIBM Cloudにログインします。
1.2 カタログ画面の表示
ダッシュボードの「+リソースの作成」ボタン
または 上部メニューの 「カタログ」をクリックします。
どちらもカタログ画面に行きます。

1.3 Natural Language Understanding作成画面の表示
検索窓にnatural と入力すると、naturalの付くサービスがリストされるので、その中から
Natural Language Understanding`をクリックします。
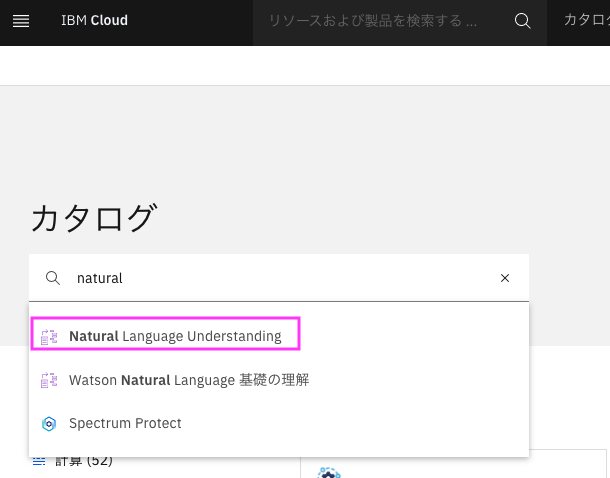
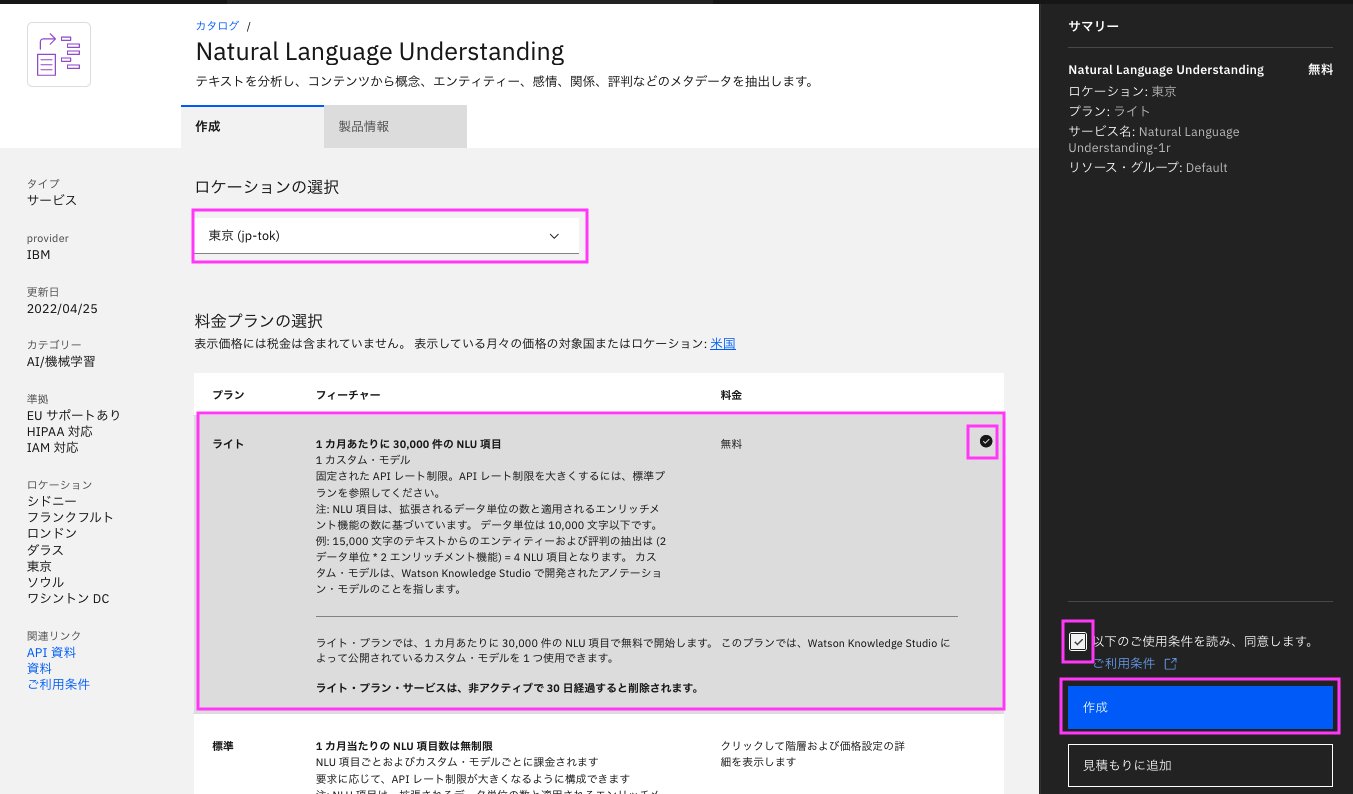
Natural Language Understanding作成画面が表示されます:
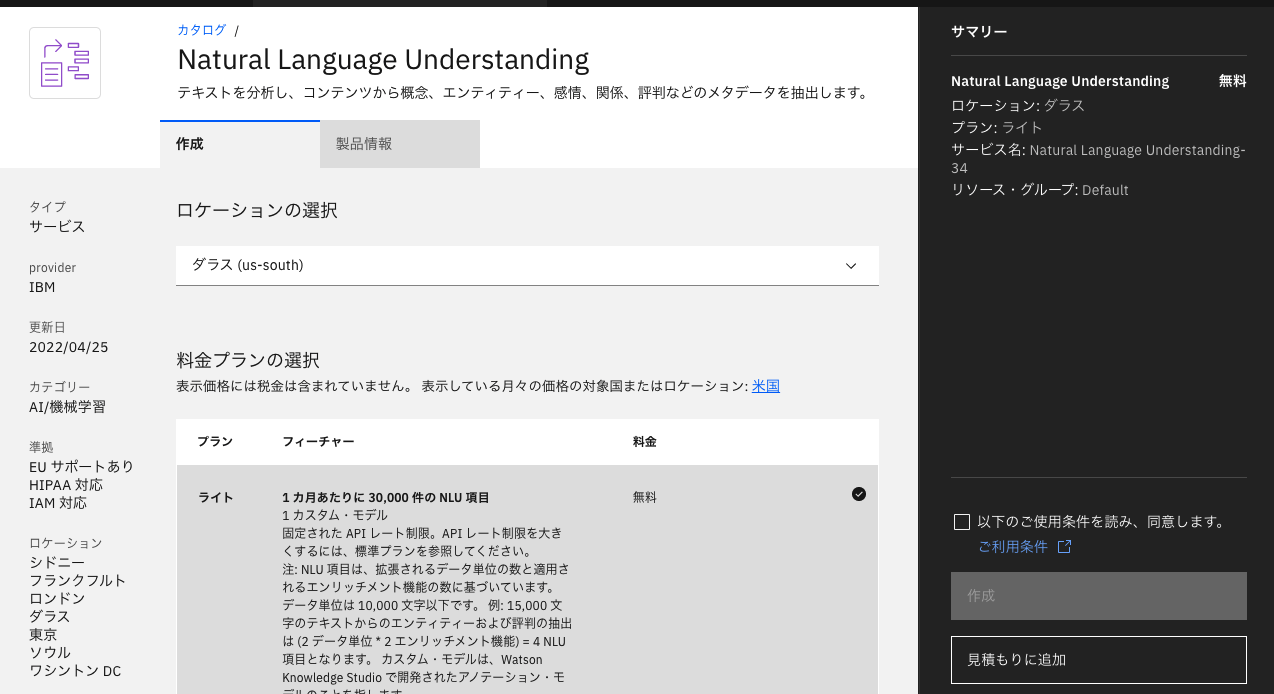
1.4 詳細情報の設定と作成
Db2 Warehouseの作成画面で、詳細を設定し作成します。
ロケーションの選択
ロケーションを選択します。
通常は呼び出す場所から近い場所を選びます。
料金プランの選択
無料プランを使いたい場合はライトにチェックが入っていることを確認します。
希望のプランにチェックが入っていない場合は、プランをクリックしてチェックを入れます・
その他の項目は必要に応じて変更します。
最後に、構成内容を確認し、ご利用条件を確認の上「以下のご利用条件を読み、同意します。」 にチェックを入れ、「作成」をクリックします。
2. notebookを使ったアンケートコメントを分析
Jupyter notebookを使ってアンケートコメントを分析します。
notebookは以下にあります。
https://github.com/kyokonishito/wids-tokyo-ibm2022/blob/main/notebooks/WiDSTokyoIBM-2020-20210-Analysis.ipynb
Watson StudioのNotebookで作成していますが、他の環境のNotebookでも動作可能です。
Watson Studio特有のCodeはその旨記載し、代替Codeを記載していいますので他の環境の場合は参考にしてください。
なおWatson Studioは最近LiteプランのCHUが減ってしまい、Liteプランだと結構すぐひと月の上限CHUに達するようになりましたので、ご注意ください。こちらのnootbookの実行については数回は問題なく実行できます。
以下の説明はこのnotebookを元に説明します。以下notebook内のセクションと同じセクションタイトルとしています。
「0. project-libの準備」
Watson Studio利用の場合は、notebook記載に従い準備してください。
なおこれは作成したデータをWatson Studioのプロジェクト資産に保存するための作業で、Natural Language Understandingの使用には無関係です。
参考: Watson Studio上のnotebookからIBM Cloud Object Storage(ICOS)へのFileの読み書き - project-libを使う -
「1. Watson Libraryの導入」
Natural Language Understandingを呼び出せるSDK、Watson Libraryをpipで導入します。
参考: API Doc https://cloud.ibm.com/apidocs/natural-language-understanding?code=python
!pip install --upgrade ibm-watson
「2. データファイルの読み込み」
DATA列に分析したいデータを入れたエクセルファイルまたはCSVファイルを準備します。ここではDATA列にWiDS Tokyo@IBMのアンケートコメントを入れたEXCELを使っています(非公開)。
DATA列のみ使いますので、他の列は何が入っていてもOKです。自分のアンケートデータをDATA列にいれてファイルを作ることで、自分のデータで試せます。
サンプル表:
| KEYID | DATA |
|---|---|
| A0001 | とてもよい感じで感動しました |
| B0001 | 見にくい資料があったのでフォントを大きくして欲しい |
ファイルを準備したら、pandasのDataframeにファイルを読み込ませます。
IBM Cloud Watson Studioとそれ以外でやり方が違いますので、対応する方をnotebookの説明を読んで実施してください。
IBM Cloud Watson Studioの場合は以下の方法を使用しています。
IBM Cloud Watson Studio以外の場合は通常のpandasでのファイルの読み込みです。notebookのコメントアウトを外して実行してください。
# ファイルパスを指定して読み込み (Local jupyter実行用) する場合のみ実行

import os
import pandas as pd
data_path="<data_pathに読み込ませたいEXCELファイル または CSVファイルをパス付きで指定>"

ext_str=os.path.splitext(data_path)
if ext_str[1].lower() == ".xlsx":
    df_data_0 = pd.read_excel(data_path)
elif ext_str[1].lower() == ".csv":
     df_data_0 = pd.read_csv(data_path)
else:
    print("Filepath Error!")
df_data_0.head()
「3. いろいろ前処理」
各セルの実行をします。 何をやっているかはコメントを参考にしてください。
# データのコピー
df_poll=df_data_0.copy()
#データの整形  refineTextt列に整形したデータを入れる
import numpy as np

def refine_text(df_data):

    # データの整形
    df_data['refineText'] = df_data['DATA']

    # NaN削除
    df_data['refineText'] = df_data['refineText'].replace(np.nan, '', regex=True)

    # 改行削除
    df_data['refineText'] = df_data.apply(lambda x: x['refineText'].replace('\n', ' '), axis=1)
    df_data['refineText'] = df_data.apply(lambda x: x['refineText'].strip(), axis=1)

    return

refine_text(df_poll)
「4. Natural Language Understanding: apikey, urlのセット」
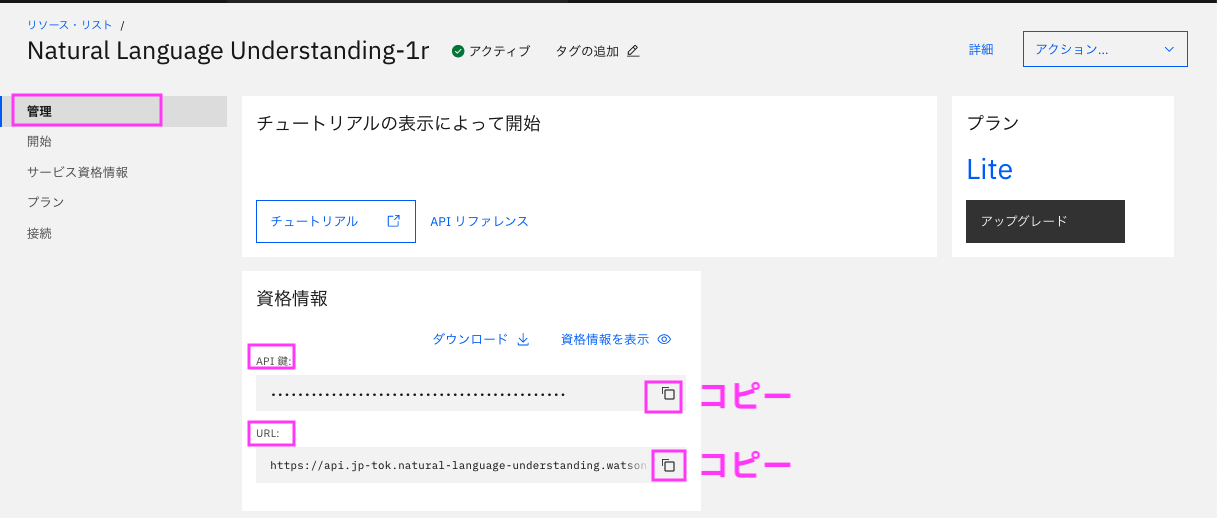
Natural Language Understandingのapikey, urlを取得し、apikey, urlの変数にセットします。
Natural Language Understandingのapikey, urlは以下の手順で取得し、コピペします。
- IBM Cloudダッシュボードからリソース・リストの表示
- 「サービスおよびソフトウエア」の下から、作成したNatural Language Understandingの名前をクリック
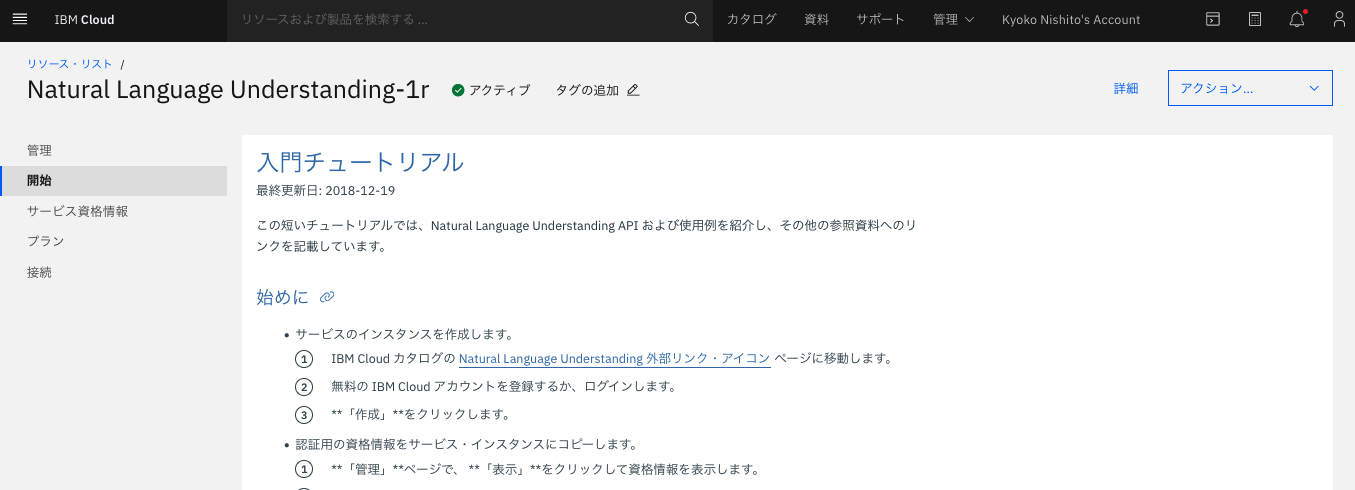
- 表示された詳細ページの左側の「管理」をクリックし、資格情報からAPI鍵をapikey, URLをurlとしてコピーしてnotebookにセットする。
設定例:
apikey="u3RTGnji90okmbhuYTGVr-ZAqwSCXCDErfvbgt"
url="https://api.jp-tok.natural-language-understanding.watson.cloud.ibm.com/instances/123456njuhfgNHY-1q2w3e4r5t6yNHY"
「5. Natural Language Understanding: NaturalLanguageUnderstandingV1インスタンス作成」
SDKを使用して NaturalLanguageUnderstandingV1インスタンスを作成します。
API Doc:
https://cloud.ibm.com/apidocs/natural-language-understanding?code=python#authentication
from ibm_watson import NaturalLanguageUnderstandingV1
from ibm_cloud_sdk_core.authenticators import IAMAuthenticator
def get_NLU(apikey, url):
    authenticator = IAMAuthenticator(apikey)
    nlu = NaturalLanguageUnderstandingV1(
        version='2022-04-07',
        authenticator=authenticator
    )

    nlu.set_service_url(url)
    return nlu

nlu=get_NLU(apikey, url) #インスタンス作成
「6. Natural Language UnderstandingでrefineText列(DATA列を整形した列)の分析を実施」
いよいよNatural Language Understanding(NLU)を呼び出してrefineText列(DATA列を整形した列)の全てのテキストを分析していきます。
参考: API Doc :https://cloud.ibm.com/apidocs/natural-language-understanding?code=python#analyze
以下ではrefineText列の以下の分析結果を返すように設定し、実行しています。
- キーワード
- relevance(確信度)が0.3以上のキーワードを最大10個
- API Doc: https://cloud.ibm.com/apidocs/natural-language-understanding?code=python#keywords
- 文字列全体のセンチメント(ポジティブかネガティブか)とそのスコア
- スコアはポジティブが0より大きく1未満、ネガティブが0未満かつ-1より大、0はニュートラルとなります。
- API Doc: https://cloud.ibm.com/apidocs/natural-language-understanding?code=python#sentiment
結果はjsonフォーマットで戻ってくるので、API Docを参考に抽出し、DataFrameに付加していきます。
NLUから戻ってきた上記のデータは、DataFrameの同じ行の最後に付加しています。
| sentiment_label | sentiment_score | keyword1 | keyword2 | keyword3 | keyword4 | keyword5 | keyword6 | keyword7 | keyword8 | keyword9 | keyword10 |
|---|---|---|---|---|---|---|---|---|---|---|---|
| positive または neutral または negative | センチメントスコア | キーワード1 | キーワード2 | キーワード3 | キーワード4 | キーワード5 | キーワード6 | キーワード7 | キーワード8 | キーワード9 | キーワード10 |
最後にFinished!と表示されたら完了です。
import json
import datetime
from ibm_watson.natural_language_understanding_v1  import Features,  KeywordsOptions,  SentimentOptions

keyword_num = 10
keyword_relevance = 0.3

features = Features(keywords=KeywordsOptions(limit=3), sentiment=SentimentOptions())
df_keywords = pd.DataFrame(columns=['keyword1', 'keyword2', 'keyword3', 'keyword4', 'keyword5', 'keyword6',  'keyword7', 'keyword8',  'keyword9', 'keyword10'])
df_sentiment = pd.DataFrame(columns=['sentiment_label', 'sentiment_score'])
df_keywords_wordcloud  = pd.DataFrame(columns=['keyword', 'sentiment_label', 'sentiment_score'])


for text, i in zip(df_poll['refineText'], df_poll.index):
    if i % 10 == 0:
        print('{0}: Now processing line {1}/{2}.'.format(str(datetime.datetime.now()), i, len(df_poll)))

    if not text:
        data_row = ['', '', '']
        df_keywords.loc[i] = data_row
        data_row = ['', np.nan]
        df_sentiment.loc[i] = data_row
        continue

    try:
        enriched_json = nlu.analyze(text=text, features=features, language='ja').get_result()  # NLU 呼び出し
    except ApiException as ex:
        print('{}:text: {} -- Method failed with status code {}: {}'.format(i, text, str(ex.code), ex.message))
        data_row = ['ERR', str(ex.code), ex.message]
        df_keywords.loc[i] = data_row
        data_row = ['ERR', np.nan]
        df_sentiment.loc[i] = data_row
        continue

    # Iterate and get KEYWORDS with a confidence of over keyword_relevance
    if 'keywords' in enriched_json:
        keywords = []
        keynum = keyword_num
        for kw in enriched_json["keywords"]:
            # print(kw["text"])
            keynum -= 1
            if (float(kw["relevance"]) >= keyword_relevance):
                keywords.append(kw["text"])
            else:
                keywords.append('')
        for key_i in range(keynum):
            keywords.append('')
        df_keywords.loc[i] = keywords
    else:
        data_row = ['', '', '','', '', '','', '', '','']
        df_keywords.loc[i] = data_row

    if 'sentiment' in enriched_json:
        sentiment = []
        sentiment.append(enriched_json["sentiment"]["document"]["label"])
        sentiment.append(enriched_json["sentiment"]["document"]["score"])
        df_sentiment.loc[i] = sentiment
    else:
        data_row = ['N/A', np.nan]
        df_sentiment.loc[i] = data_row

df_enriched_poll = pd.concat([df_poll, df_sentiment, df_keywords, ], axis=1)
print("Finished!")
「7. WatsonStudioのプロジェクトのデータ資産に保存」
作成したDataFrameはcsvファイルとして保存しておきます。
あとで保存したファイルの中身を見てみてください。
IBM Cloud Watson Studioとそれ以外でやり方が違いますので、対応する方をnotebookの説明を読んで実施してください。
IBM Cloud Watson Studioの場合は特有のやり方になります。
参考: Watson Studio上のnotebookからIBM Cloud Object Storage(ICOS)へのFileの読み書き - project-libを使う -
IBM Cloud Watson Studio以外の場合は通常のpandasでのファイルの書き込みです。notebookのコメントアウトを外して実行してください。
saved_file_name = "analysis.csv"
# ローカルに保存
df_enriched_poll.to_csv(saved_file_name, index=False)
# 中身の確認
!head {saved_file_name}
「8. 分析」
ここからNULから帰ってきた結果をさまざまな角度から分析してみます。
「8.1 wordcloudの準備」
詳細はnotebookの説明を参考にしてください。
# fontの準備
!wget https://moji.or.jp/wp-content/ipafont/IPAexfont/ipaexg00401.zip
!unzip ipaexg00401.zip
!ls -la  ipaexg00401
#wordcloud ライブラリの導入
!pip install wordcloud
# wordcloudの初期化
import matplotlib.pyplot as plt
from wordcloud import WordCloud

#font_pathは環境で変更してください
wordcloud = WordCloud(font_path='ipaexg00401/ipaexg.ttf',
                     width=1600,  height=800,  background_color="white" )
- 今までのWiDS Tokyo@IBMのアンケートコメントを分析結果 -
ここからが今までのWiDS Tokyo@IBMのアンケートコメントを分析 結果です。
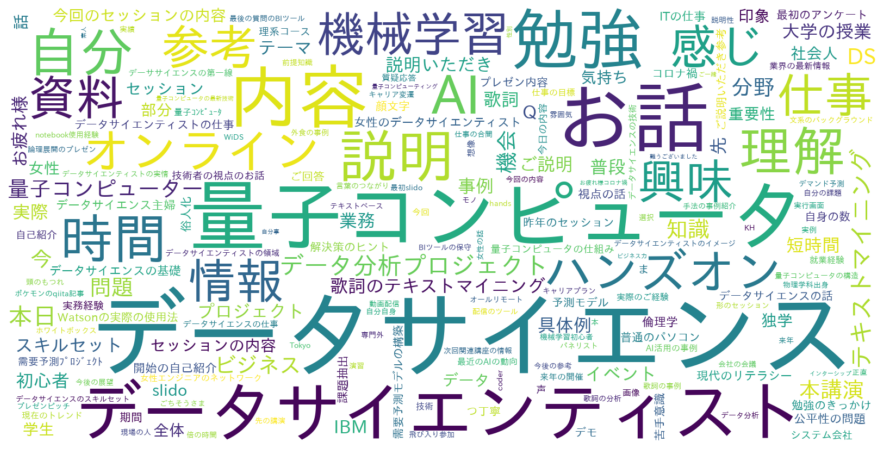
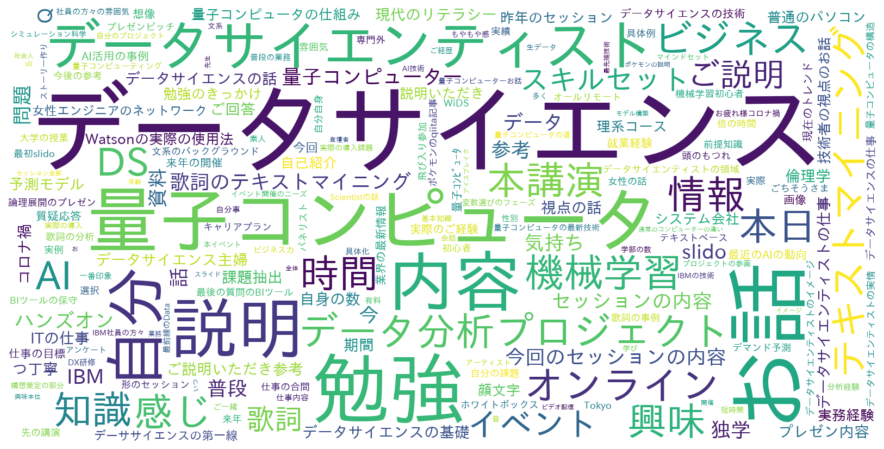
「8.2 KeywordでWordcloud」
抽出されたキーワードでWordcloud を作ってみます。
import matplotlib.pyplot as plt
from wordcloud import WordCloud

words=''
for key_i in range(keyword_num):
    colname='keyword{0}'.format(key_i+1)
    tmp_words = ' '.join(df_enriched_poll[colname])
    words = words + tmp_words

wordcloud.generate(words)
plt.figure(figsize=(16,8))
plt.imshow(wordcloud, interpolation="bilinear")
plt.axis("off")
plt.show()
やっぱ「データサイエンス」ですよねー。「量子コンピュータ」のセッションも毎年2セッションあるんで、キーワードとしては強いですね。
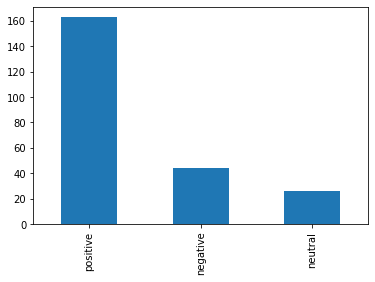
「8.3 センチメント数のグラフ」
センチメント数を棒グラフにしてみます。
df = df_enriched_poll['sentiment_label'].value_counts()
df.plot(kind='bar')
「8.4 Positive KeywordでWordcloud」
せっかくなので、PositiveとなったコメントのキーワードのみでWordcloudを作ってみます。
df = df_enriched_poll.query('sentiment_label == "positive"')

words=''
for key_i in range(keyword_num):
    colname='keyword{0}'.format(key_i+1)
    tmp_words = ' '.join(df[colname])
    words = words + tmp_words

wordcloud.generate(words)
plt.figure(figsize=(16,8))
plt.imshow(wordcloud, interpolation="bilinear")
plt.axis("off")
plt.show()
といってもあまり全体の時と変わりませんね、、、、。positiveコメントが多いですからね。
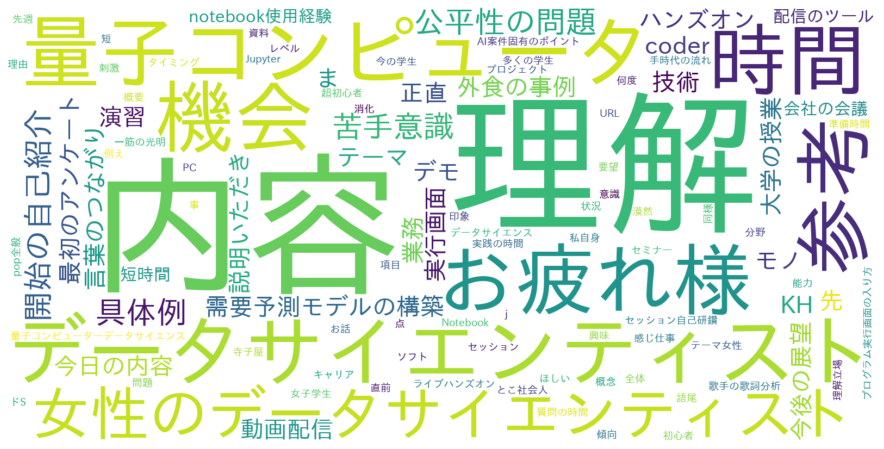
「8.5 Negative KeywordでWordcloud」
では、NegativeとなったコメントのキーワードのみでもWordcloudを作ってみます。
df = df_enriched_poll.query('sentiment_label == "negative"')

words=''
for key_i in range(keyword_num):
    colname='keyword{0}'.format(key_i+1)
    tmp_words = ' '.join(df[colname])
    words = words + tmp_words

wordcloud.generate(words)
plt.figure(figsize=(16,8))
plt.imshow(wordcloud, interpolation="bilinear")
plt.axis("off")
plt.show()
「内容」、「理解」は 理解できないとか難しいとかがあるのでしょうか? 「女性のデータサイエンティスト」はが少ないとかの文章ですかね、「お疲れ様」??? キーワードだけだとそんなに特徴はわからないのでコメントを見た方が良さそうですね、、、、。
「8.6 positiveコメントベスト20」
キーワードのみじゃよくわからなかったので、positiveスコアが高いコメントそのものベスト20を表示してみます(諸事情で長いものは最初の部分のみ表示)。
あくまでもコメントのpositiveスコアが高いだけで、主流のコメントではないことにご注意ください。
df = df_enriched_poll.query('sentiment_label == "positive"')
df.sort_values('sentiment_score', ascending=False).loc[:,['refineText','sentiment_score']].head(20)
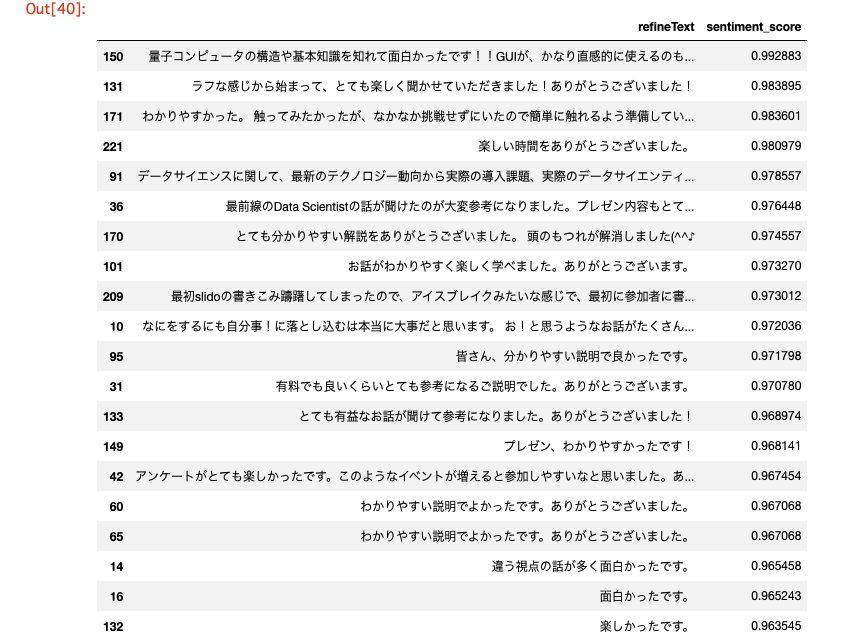
面白くて楽しいのがWiDS Tokyo @ IBMなのです!
「8.7 negativeコメント ワースト10」
ではnegativeスコアが高い(というかsentiment_scoreが低い)コメントそのものワースト10を表示してみます(諸事情で長いものは最初の部分のみ表示)。
あくまでもコメントのnegativeスコアが高い(=sentiment_scoreが低い)だけで、主流のコメントではないことにご注意ください。
df = df_enriched_poll.query('sentiment_label == "negative"')
df.sort_values('sentiment_score').loc[:,['refineText','sentiment_score']].head(10)
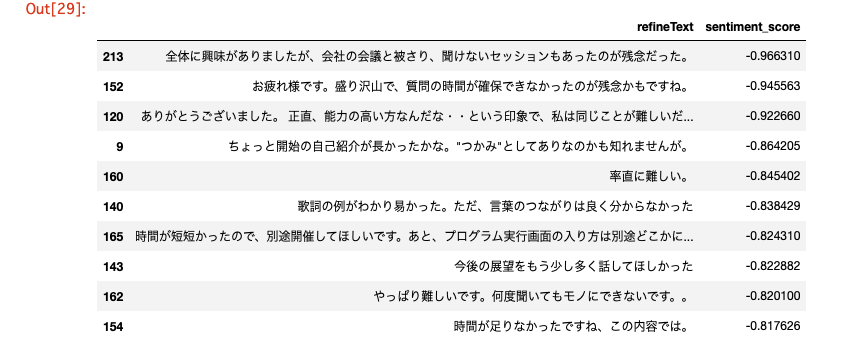
いろいろ皆様の御要望があったと思います。参加者のレベルもそれぞれで難しい・簡単はあるかもしれません。ネガティブコメントも今後のイベントの改善に役立ていきたいと思います。
3. まとめ
いかがでしたか? Natural Language Understandingでセンチメント分析やキーワード分析が簡単にできました(たぶん)。Natural Language UnderstandingはLiteプランで結構つかえますので、ぜひお手持ちのデータで試してみてください。
そしてポジティブなコメントが多いイベント 2022年 6/3(金)開催のWiDS Tokyo @ IBMへのご参加をぜひお待ちしています!
補足: Watson Studioについて
Watson Studio使用の場合かつWatson Studio初心者の向け:
(以前のハンズオン資料ですが参考までに)
-
Watson Studio未作成の場合は以下の手順で作成します。手順内でプロジェクトも作成します。
-
以下の資料のp13からp24までを実施してください。
- https://speakerdeck.com/kyokonishito/20220421-jupyter-notebooks-with-db2?slide=13
- p22のNotebookURLにコピペするのは以下です
https://github.com/kyokonishito/wids-tokyo-ibm2022/blob/main/notebooks/WiDSTokyoIBM-2020-20210-Analysis.ipynb
