はじめに
深層学習に関して、主要なモデルに関する、横軸Gops、縦軸Accuracyのグラフをよく見かける。
2系統あると思うので、念のため、整理して、記事にする。
その1
論文
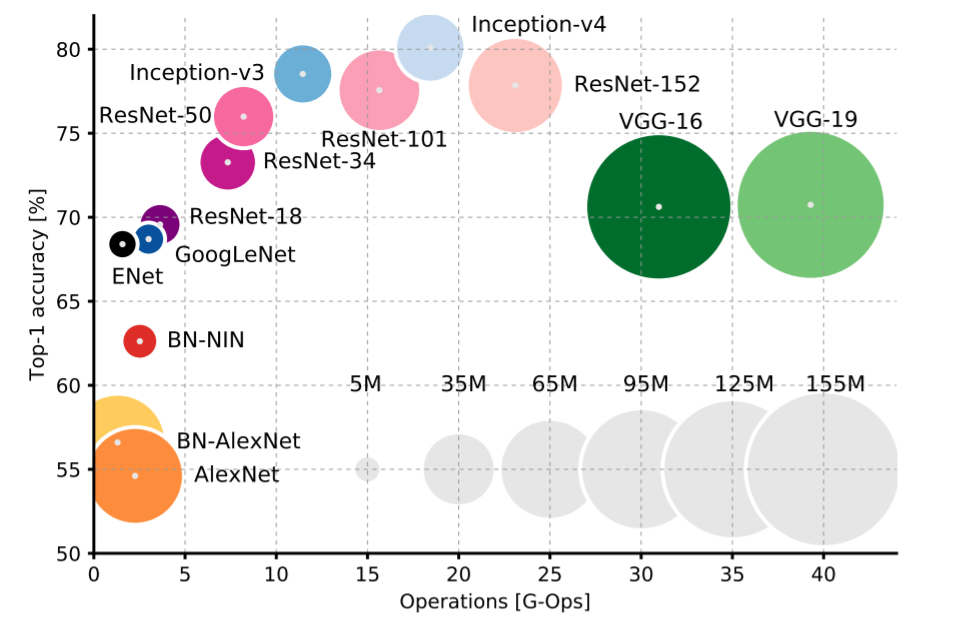
An analysis of deep neural network models for practical applications
Canziani, Alfredo, Adam Paszke, and Eugenio Culurciello. "An analysis of deep neural network models for practical applications." arXiv preprint arXiv:1605.07678 (2016).
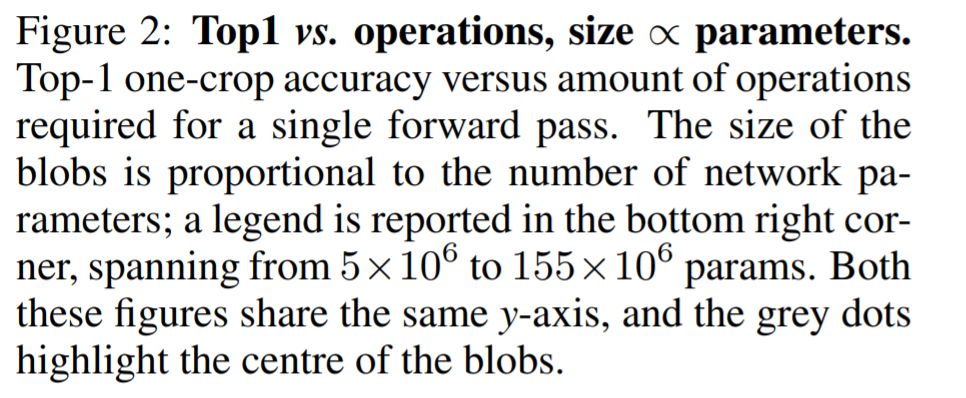
論文著者による記事、github等
↓論文より、情報がアップデートされている。
この2系統の引用関係
こちらが先なので、引用される側。
その2
論文
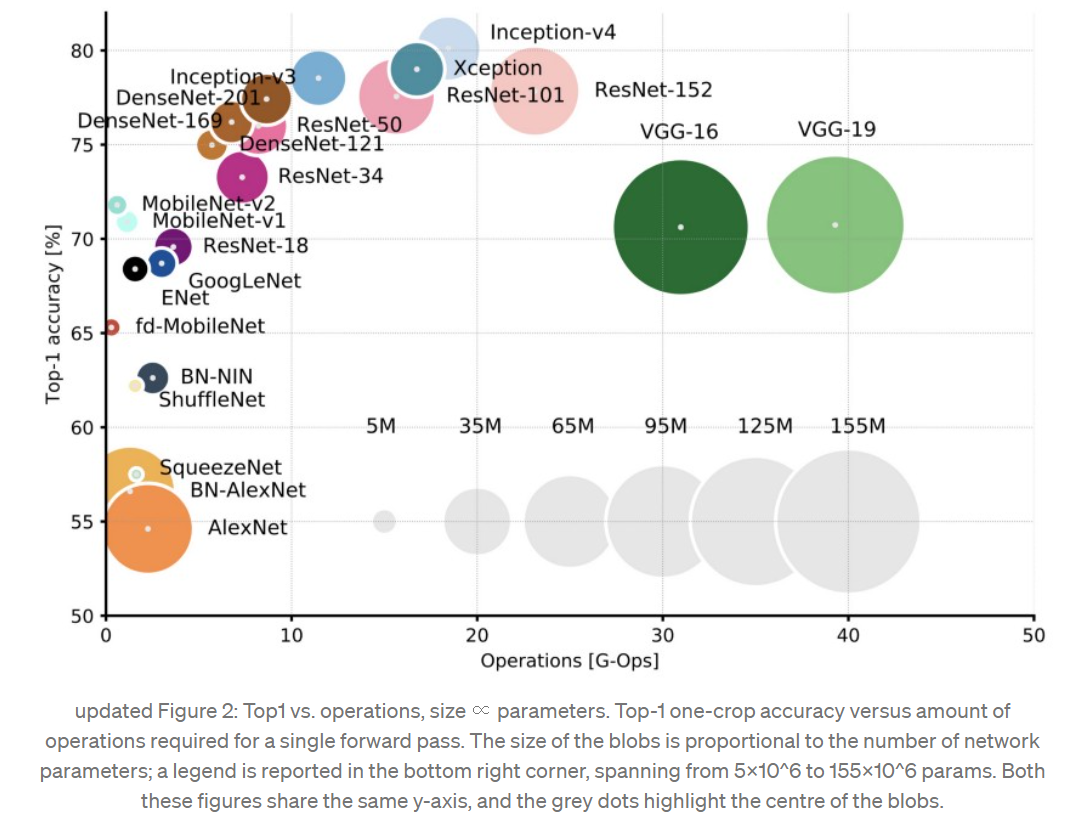
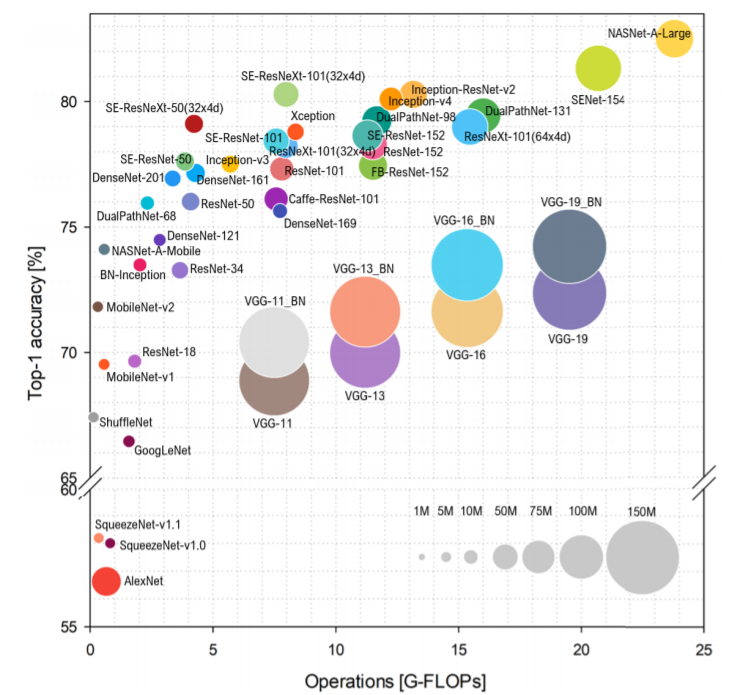
Benchmark Analysis of Representative Deep Neural Network Architectures
Bianco, Simone, et al. "Benchmark analysis of representative deep neural network architectures." IEEE Access 6 (2018): 64270-64277.
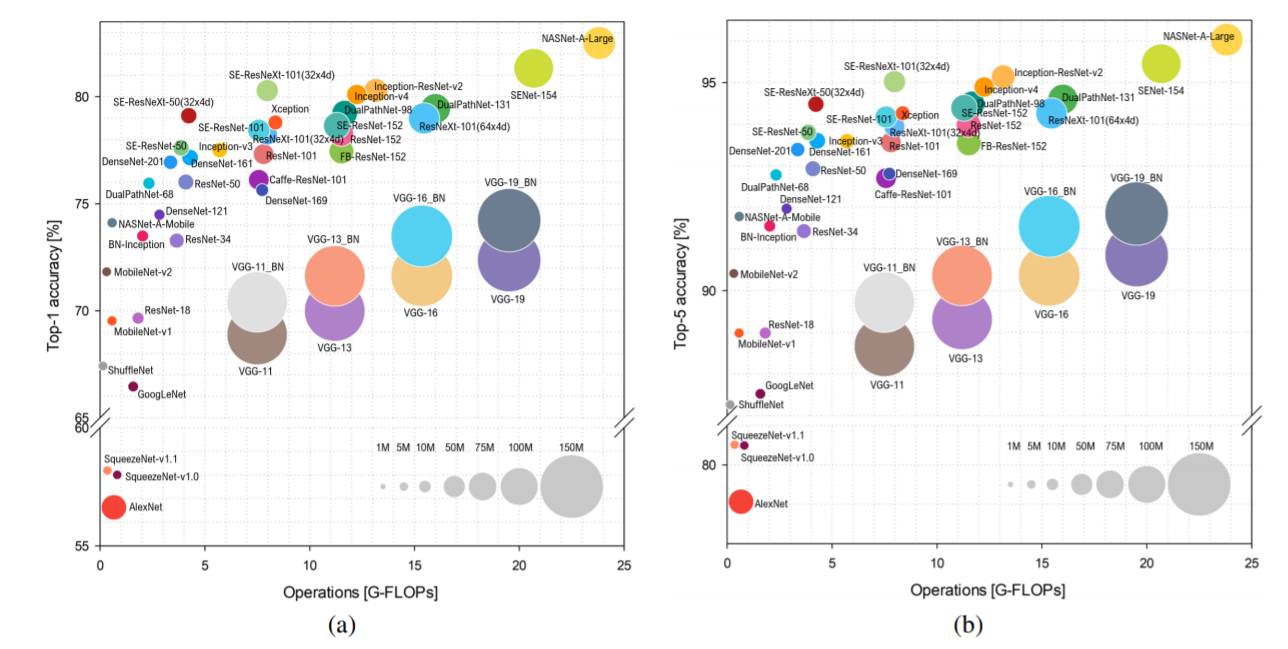

↓ Top-1のみを大きく表示
論文著者による記事、github等
この2系統の引用関係
以下は、論文引用。以下のように、引用している。
Canziani et al. [4] in the first half of 2016 proposed a comprehensive analysis of some DNN architectures by performing experiments on an embedded system based on a NVIDIA Jetson TX1 board.
コメント
(どうでもいいことですが。。。)グラフの〇の大きさが謎。普通、面積比にするのでは。![]()
少し話がずれて、GOPsについて
グラフではなくて、数字が書かれているサイトの例。
https://github.com/tensorflow/models/tree/master/research/slim/nets/mobilenet
https://github.com/opencv/open_model_zoo/blob/master/models/public/index.md
関連記事(本人)
文献『AN ANALYSIS OF DEEP NEURAL NETWORK MODELS FOR PRACTICAL APPLICATIONS』を読む。
まとめ
特にありません。
もしかすると、他の系統もあるかも。。。
情報や、ご指摘などあれば、コメント等お願いします。![]()