単語帳.毎回検索するのが面倒なので転載多め.元URLあり.
公式ドキュメント(大体はここを探せば見つかる):
[matplotlib.figure.Figure]
(https://matplotlib.org/3.2.1/api/_as_gen/matplotlib.figure.Figure.html#matplotlib.figure.Figure)
[matplotlib.axes]
(https://matplotlib.org/3.2.1/api/axes_api.html#)
[matplotlib.axes.SubplotBase]
(https://matplotlib.org/3.2.1/api/_as_gen/matplotlib.axes.SubplotBase.html)
オプションに関する情報は,取捨選択された日本語のページよりも,公式の網羅的な引数一覧からページ内検索した方がストレスが少ない.
テーマ別メモ:
[Qiita@aisha: [Python] 図の色を指定する方法まとめ]
(https://qiita.com/aisha/private/b93a1a52689327a2eeda)
[Qiita@aisha: [Python] カラーバーの調整]
(https://qiita.com/aisha/items/6c84a734b6bd1605b5c9)
[Qiita@aisha: [Python] 図の枠線・軸線調整]
(https://qiita.com/aisha/private/3eeb9f3dbee6e06f9394)
matplotlib
[Qiita@skotaro: 早く知っておきたかったmatplotlibの基礎知識、あるいは見た目の調整が捗るArtistの話]
(https://qiita.com/skotaro/items/08dc0b8c5704c94eafb9)
- 階層構造:
Figure-
Axes:1つ1つの図やテキスト -
Axis:各Axesの軸・枠 -
Tick:各Axisの目盛り・そのラベル
- 「オブジェクト指向インターフェース」と「Pyplotインターフェース」の2種類が存在,微調整に向くのは前者
Figure
| メソッド | 説明 |
|---|---|
| clf() | Figure上の図を消去 |
Axes
自由な位置にAxesを作る
plt.axes((左, 下, 幅, 高さ))
http://ailaby.com/matplotlib_fig/
https://matplotlib.org/api/_as_gen/matplotlib.pyplot.axes.html
格子形状のAxesにはGridSpecが便利
from matplotlib import gridspec
gs = gridspec.GridSpec(2, 2, width_ratios=(6, 1), height_ratios=(4, 1)) # [縦,横]
ax = [plt.subplot(gs[0, 0]), plt.subplot(gs[0, 1]), plt.subplot(gs[1, 0])]
ax[0].set_title("散布図", fontproperties=fp) # 左上
ax[1].hist(y, 50, orientation="horizontal") # 右上
ax[2].hist(x, 100) # 左下
余白は通常のAxes同様wspaceとhspaceで指定可能
http://python-remrin.hatenadiary.jp/entry/2017/05/27/114816
https://qiita.com/simonritchie/items/da54ff0879ad8155f441
背景色の設定
set_facecolor()
その他メソッド
| パラメータ | 効果 | デフォルト値 |
|---|---|---|
| pad | Axesとの距離(小:近い,大:遠い) | 6.0 |
その他
fig.add_subplot()ではmatplotlib.axes._subplots.AxesSubplotクラスが,fig.add_axesではmatplotlib.axes._axes.Axesクラスが返る
colorbarにはAxesSubplotクラスは使えないので注意.
fig = plt.figure(figsize=(8,5))
ax1 = fig.add_subplot(1, 1, 1)             # <class 'matplotlib.axes._subplots.AxesSubplot'>
ax2 = fig.add_axes([0.05, 0.05, 0.9, 0.9]) # <class 'matplotlib.axes._axes.Axes'>
ax3 = plt.axes([0.05, 0.05, 0.9, 0.9])     # <class 'matplotlib.axes._axes.Axes'>
一旦Axesを作った後にprojectionの変更は不可
fig.add_axes(projection=)などで指定したprojectionに応じて,異なるクラスが返される.
従ってax.set_projection()といった変更は不可.
[stackoverflow: How do I change matplotlib's subplot projection of an existing axis?]
(https://stackoverflow.com/questions/33942233/how-do-i-change-matplotlibs-subplot-projection-of-an-existing-axis)
Axis
その他体裁
文字サイズ
Qiita: matplotlibでグラフの文字サイズを大きくする
Line2D
plt.plotの線種はこれで指定
マーカー一覧:
matplotlib: matplotlib.markers
いろいろな図
plot
横線を引くにはplt.hlinesかaxes.hlines,縦線を引くにはplt.vlinesかaxes.vlines
ax.hlines(y=1      , xmin=0, xmax=1, colors='r', linewidths=5)
ax.hlines(y=[0,2,3], xmin=0, xmax=1, colors='b', linewidths=5)
http://nekoyukimmm.hatenablog.com/entry/2015/11/07/130817
http://pynote.hatenablog.com/entry/matplotlib-hline-vline
2軸プロットの凡例
ax2 = ax.twinx()→ax.legend()だと,ax2でプロットした分の凡例が表示されない
(ax2.legend()をすれば別の箱にax2の分だけ凡例が追加される)
以下の通りplotで生成されるオブジェクトを全て足し合わせ,get_label()をすることで全ての凡例を一括して表示
lns1 = ax.plot(time, Swdown, '-', label = 'Swdown')
lns2 = ax.plot(time, Rn, '-', label = 'Rn')
ax2 = ax.twinx()
lns3 = ax2.plot(time, temp, '-r', label = 'temp')

# added these three lines
lns = lns1+lns2+lns3
labs = [l.get_label() for l in lns]
ax.legend(lns, labs, loc=0)
第3軸プロット
軸をズラす
def make_patch_spines_invisible(ax):
    ax.set_frame_on(True)
    ax.patch.set_visible(False)
    for sp in ax.spines.values():
        sp.set_visible(False)

ax3 = ax.tiwnx()
ax3.spines["right"].set_position(("axes", 1.2))
make_patch_spines_invisible(ax3)
ax3.spines["right"].set_visible(True)
Axesの代わりにmpl_toolkits.axisartist.Axesを使うと関数を定義せずとも以下で同じ動作
import mpl_toolkits.axisartist as AA
host = host_subplot(111, axes_class=AA.Axes)

offset = 60
new_fixed_axis = ax3.get_grid_helper().new_fixed_axis
ax3.axis["right"] = new_fixed_axis(loc="right", axes=ax3,
                                        offset=(offset, 0))
ax3.axis["right"].toggle(all=True)
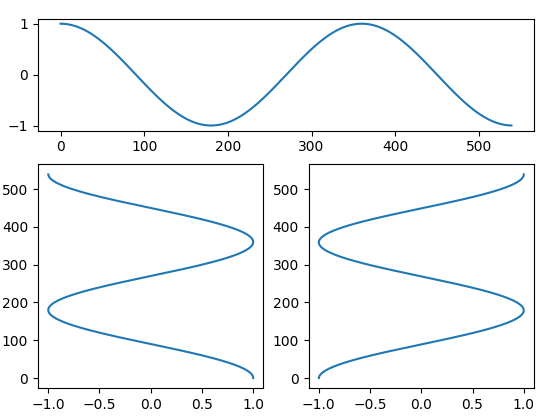
90度回転したplot
棒グラフ(bar)やヒストグラム(hist)にはorientation='horizontal'で90度回転した図を作る機能があるが,plotにはない.
90度回転した折れ線グラフは,plot(x, y)の2値をそれぞれ指定すればOK.
x = np.arange(540.0)
y = np.cos(np.radians(x))

gs = GridSpec(2, 2, width_ratios=(1, 1), height_ratios=(1, 2))
ax = plt.subplot(gs[0, :]) # upper
ax.plot(y) # left to right

ax = plt.subplot(gs[1, 0]) # bottom left
ax.plot(y, x) # down to up

ax = plt.subplot(gs[1, 1]) # bottom right
ax.plot(y, x[::-1]) # up to down
plt.show()
グラフの塗りつぶし
fill_betweenとfill_betweeny.
fill_betweenxは変な線が入る?
scatter
[matplotlib.pyplot.scatter]
(https://matplotlib.org/3.1.1/api/_as_gen/matplotlib.pyplot.scatter.html)
マーカーなどのオプション
Remrinのpython攻略日記: matplotlibで散布図
bar
[matplotlib入門: 棒グラフ]
(https://yubais.net/doc/matplotlib/bar.html)
[Python でデータサイエンス: matplotlib で棒グラフを描く]
(https://pythondatascience.plavox.info/matplotlib/%E6%A3%92%E3%82%B0%E3%83%A9%E3%83%95)
annotate
for label, x, y in zip( labels, xs, ys ):
    plt.annotate( label, (x, y) )
水平・垂直位置はha=とva=で調整可能.例えば指定した座標の中心にannotateしたい場合にはha='center', va='center'.
hist
[matplotlib: Using histograms to plot a cumulative distribution]
(https://matplotlib.org/3.1.1/gallery/statistics/histogram_cumulative.html)
plt.hist(data, bins=np.logspace(-11, -3, 500))
plt.xscale('log')
[Qiita: pythonでx軸がlogスケールのヒストグラムを書く]
(https://qiita.com/Yohei__K/items/abb285b09a349aabe30a)
legend
[matplotlib: legend]
(https://matplotlib.org/3.1.0/api/_as_gen/matplotlib.pyplot.legend.html)
[matplotlib: Legend guide]
(https://matplotlib.org/3.1.1/tutorials/intermediate/legend_guide.html)
位置調整
Qiita@matsui-k20xx: matplotlib の legend(凡例) の 位置を調整する
legendを単独で描画
def legend_linestyle(ax):
    ims = []
    for ratio, ls in dict_ratio_linestyle.items():
        im = ax.plot([0,0], linestyle=ls, label='{}%'.format(int(ratio * 100.0)), color='grey')
        ims += [im]
    leg = ax.legend(ncol=len(list(dict_ratio_linestyle.keys())),
                    borderpad=1.0, loc='center')
    # 以下は軸とプロット線を消す作業
    ax.axis('off')
    for im in ims:
        for _im in im:
            _im.set_visible(False)
    return
色の調整
各ラベルの色の設定
for text, color in zip(leg.get_texts(), [color_wat, color_eng]):
    text.set_color(color)
マーカー
Python でデータサイエンス: matplotlib で指定可能なマーカーの名前
Line-style
線種はlinestyle=で指定可能
| 線種 | 名前 | 記号 |
|---|---|---|
| 実線 | 'solid' | '-' |
| 破線 | 'dashed' | '--' |
| 一点鎖線 | 'dashdot' | '-.' |
| 点線 | 'dotted' | ':' |
text
[matplotlib.axes.Axes.text]
(https://matplotlib.org/3.1.1/api/_as_gen/matplotlib.axes.Axes.text.html)
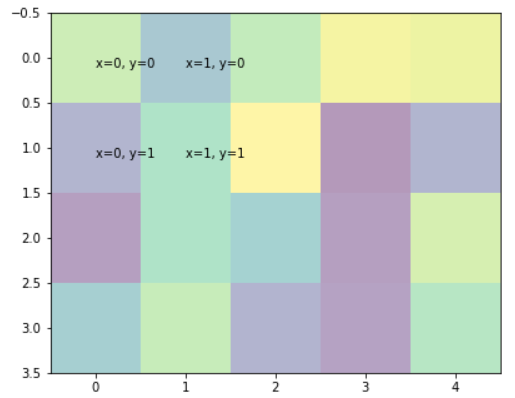
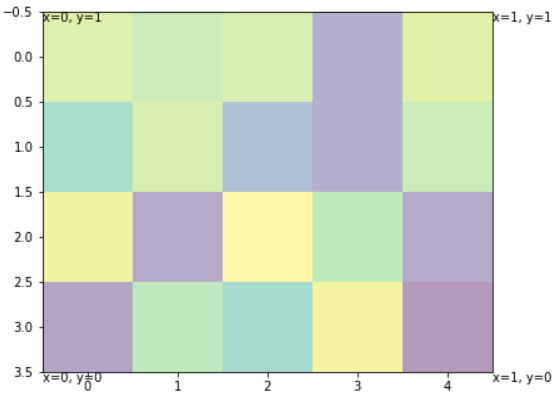
transform=ax.transAxesでAxes内の相対位置
デフォルトだとx, yで指定した数値は,他に描画されているグラフ上での値.
しかしtransform=ax.transAxesを付けるとAxes内の相対位置になる.
- x: 横軸,0: 左,y: 右
- y: 縦軸,0: 下, 1: 上
fig = plt.figure()
ax  = fig.add_axes((0, 0, 1, 1))
ax.imshow(np.random.rand(4, 5), alpha=0.4)

for x in [0, 1]:
    for y in [0, 1]:
        ax.text(x, y, 'x={0}, y={1}'.format(x, y), va='top', ha='left',
            transform=ax.transAxes) # これの有無で実験
TeX仕様の文字列(mathtext)
[matplotlib: Writing mathematical expressions]
(https://matplotlib.org/tutorials/text/mathtext.html)
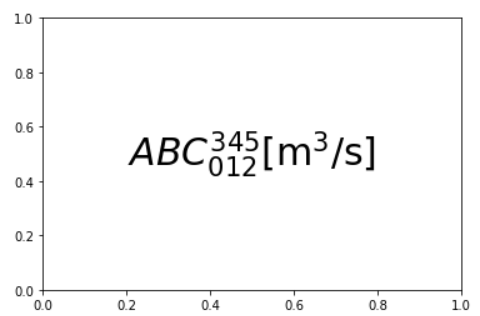
- 複数の文字を同時に上/下付き等にするときは
{}で囲む - デフォルトではイタリック
- これを部分的に回避するためには
\mathrm{}で囲む- 上/下付き等の指定は同様に動作する,文字フォントのみの変化
- これを部分的に回避するためには
plt.text(0.5, 0.5, '$ABC_{012}^{345} \mathrm{[m^3/s]}$',
    va='center', ha='center', fontsize=30)
デフォルト値へのアクセス
plt.rcParamsの辞書で管理されている(plt.rc(group, *)という関数もあるが,結局これにアクセスしている).
グループ名を筆頭に階層構造になっている.
例えば,線の太さlinewidthと色colorはlinesグループに所属しているので以下は同じ.
plt.rcParams['lines.linewidth'] = 2
plt.rcParams['lines.color'] = 'r'

plt.rc('lines', linewidth=2, color='r')
アクセスするためのグループ名やその他例は以下:
[matplotlib: Changes to the default style]
(https://matplotlib.org/3.1.1/users/dflt_style_changes.html)
実際に設定を保存しているファイルは以下:
[matplotlib: The matplotlibrc file]
(https://matplotlib.org/3.1.1/tutorials/introductory/customizing.html#customizing-with-matplotlibrc-files)
subplots_adjustのためのパラメータはfigure.subplot.以下にある:
left  = 0.125  # the left side of the subplots of the figure
right = 0.9    # the right side of the subplots of the figure
bottom = 0.1   # the bottom of the subplots of the figure
top = 0.9      # the top of the subplots of the figure
wspace = 0.2   # the amount of width reserved for space between subplots,
               # expressed as a fraction of the average axis width
hspace = 0.2   # the amount of height reserved for space between subplots,
               # expressed as a fraction of the average axis height
wspace, hspaceはそれぞれsubplotの横・縦方向の余白.
[matplotlib (ここでrcParamsを検索)]
(https://matplotlib.org/3.2.1/api/matplotlib_configuration_api.html)
[matplotlib.pyplot.rc]
(https://matplotlib.org/3.2.1/api/_as_gen/matplotlib.pyplot.rc.html)
https://matplotlib.org/api/_as_gen/matplotlib.pyplot.subplots_adjust.html
https://www.haya-programming.com/entry/2018/10/11/030103
cartopy
陸・海などを追加
land_50m  = cfeature.NaturalEarthFeature('physical', 'land', '50m',
            edgecolor='face',                   # same color with facecolor
            facecolor=cfeature.COLORS['land'])  # use predefiend color of cartopy
ocean_50m = cfeature.NaturalEarthFeature('physical', 'ocean', '50m',
            edgecolor='face',                   # same color with facecolor
            facecolor=cfeature.COLORS['water']) # use predefiend color of cartopy
lakes_50m = cfeature.NaturalEarthFeature('physical', 'lakes', '50m',
            edgecolor='face',                   # same color with facecolor
            facecolor=cfeature.COLORS['water']) # use predefiend color of cartopy
river_50m = cfeature.NaturalEarthFeature('physical', 'rivers_lake_centerlines', '50m',
            edgecolor=cfeature.COLORS['water'], # use predefiend color of cartopy
            facecolor='none')                   # no filled color
ax.add_feature(land_50m)
ax.add_feature(ocean_50m)
ax.add_feature(lakes_50m)
ax.add_feature(river_50m)
ax.coastlines(resolution='50m')
...
Met Post: Cartopyで地理データを可視化する1
Met Post: Cartopyで地理データを可視化する2
軸線を引く
gl = ax.gridlines( crs=ccrs.PlateCarree(), draw_labels=False,
                   linewidth=1, color='gray', alpha=0.5, linestyle='--', zorder=2 )
# draw_labels=Trueだと,地図の上下左右全てにラベル+度数表記にならない
gl.xlocator = mticker.FixedLocator(np.arange(-180.0, 180.1, 60.0))
gl.ylocator = mticker.FixedLocator(np.arange(-90.0, 90.1, 30.0))
度数表記にするには
from cartopy.mpl.ticker import LatitudeFormatter, LongitudeFormatter
latfmt = LatitudeFormatter()
lonfmt = LongitudeFormatter(zero_direction_label=True)
ax.xaxis.set_major_formatter( lonfmt )
ax.yaxis.set_major_formatter( latfmt )
Qiita@earth06: cartopyで地図を描くときに軸ラベルとグリッドを整える
imshow
img_extent = ( -180.0, 180.0, -90.0, 90.0 )
ax.imshow( data, origin='upper', vmin=-vmax, vmax=vmax, cmap='bwr',
           transform=ccrs.PlateCarree(), extent=img_extent, zorder=5 )
plot
ax.plot(lon, lat, 'r.', transform=ccrs.PlateCarree() )
annotateはtransform=ではなくxycoord=
transform = ccrs.PlateCarree()._as_mpl_transform(ax)
ax.annotate('Beijing', xy=(116.4, 39.9), xycoords=transform)
transform=で座標を指定しようとすると図が小さくなった
stackoverflow: Why the annotate worked unexpected here in cartopy?
その他体裁
subplotした後全体にタイトルを付けたいときはplt.subtitle
plt.suptitle( 'title' )
plt.subplots_adjust(top=0.9) # 図と被ってしまうので少し上を空ける
symlogのオプション
plt.xscale('log', nonposx='mask') #負の値は無視
plt.xscale('log', nonposx='clip') #負の値は限りなく0に近い正の値
[eamuの日記: logscaleのプロットにはまる]
(https://eamu.hatenadiary.org/entries/2015/01/11)
デフォルト設定の確認
plt.rcParams['font.family'] # ['sans-serif'], DejaVu Sansのこと
[分析ノート: matplotlibのデフォルトのフォントを変更する]
(https://analytics-note.xyz/programming/matplotlib-font-family-setting/)
第3軸プロット
ax, ax.twinx()で描かれたプロットは,軸を共有していない
=新しくax.twinx()されると,重なって表示されるだけ
→3軸目の縦軸を横にずらすだけでOK
ax3 = ax1.twinx()
ax3.spines["right"].set_position(("axes", 1.2))
[Qiita@hirayama_yuuichi: matplotlibで、2軸、3軸でグラフを描画する]
(https://qiita.com/hirayama_yuuichi/items/86a05f87480e518575c9)
未検証・理解不十分
https://matplotlib.org/3.1.1/gallery/text_labels_and_annotations/rainbow_text.html
ax.textの文字の色を途中で変える方法.
横書きで何行か書く+その行ごとに色を変える,という方法にアレンジできないか…?
(現状色ごとに目視でx, yを指定するので我慢)


