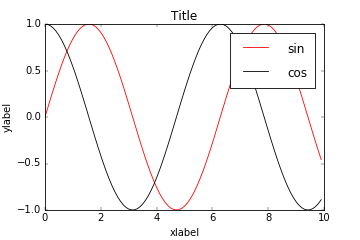
デモ
| Before | After |
|---|---|
 |
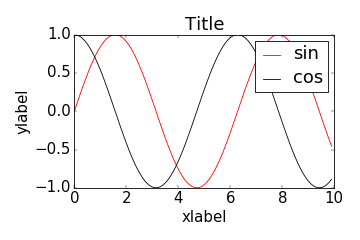 |
方法① 別々に文字サイズを指定する
各グラフ要素はキーワード引数fontsizeに数値を与えることで、その数値の文字サイズになります。ただし、目盛りの文字サイズの場合は、plt.tick_params(labelsize=18)と指定します。
import numpy as np
import matplotlib.pyplot as plt

x = np.arange(0, 10, 0.1)
s = np.sin(x)
c = np.cos(x)

plt.plot(x, s, "r", label="sin")
plt.plot(x, c, "k", label="cos")
plt.title("Title", fontsize=18)
plt.xlabel("xlabel", fontsize=18)
plt.ylabel("ylabel", fontsize=18)
plt.legend(fontsize=18)
plt.tick_params(labelsize=18)

plt.savefig("output.png")
方法② まとめて文字サイズを指定する
plt.rcParams["font.size"] = 18
で、全てのグラフ要素の文字サイズをまとめて変更することができます。なお、デフォルトの文字サイズは12です。(Thanks to Tsutomu-KKE@github, 2016/01/26)
おまけ
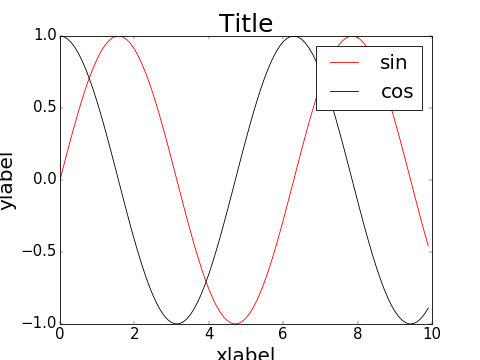
グラフ位置の調整
各グラフ要素の文字サイズを大きくした副作用でグラフの一部が出力画像からはみ出てしまうことがあります。そこで、
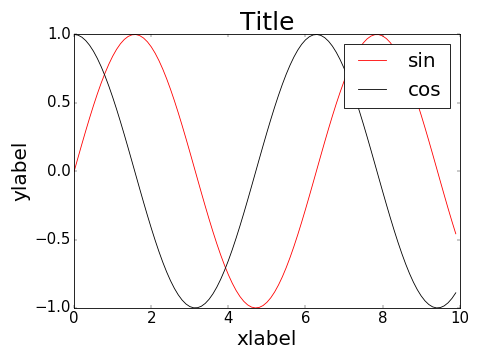
plt.tight_layout()
を加えることで、グラフの位置やサイズが自動で調整されて、出力画像からのはみ出しを抑えることができます。
| 修正前 | 修正後 |
|---|---|
 |
 |
コピペ用
plt.rcParams["font.size"] = 18
plt.tight_layout()
参考
matplotlib入門 - りんごがでている
http://bicycle1885.hatenablog.com/entry/2014/02/14/023734
Tight Layout guide — Matplotlib 1.5.1 documentation
http://matplotlib.org/users/tight_layout_guide.html