X軸がlogスケールのグラフをpythonで書くメモ
import pylab as pl
import numpy as np
二つの山を持つ分布の作成
data1 = (np.random.normal(size=100) + 10)* 1e-5
data2 = (np.random.normal(size=100) + 10)* 1e-10
data = np.r_[data1, data2]
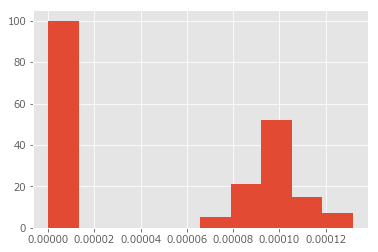
# ヒストグラムの作成
print(data)
pl.hist(data)
xをlogスケールにするだけではダメ
pl.hist(data)
pl.gca().set_xscale("log")
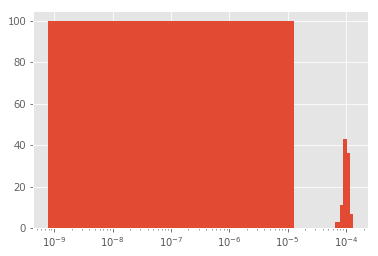
それぞれの棒(binsとも言う)の幅が対数じゃないのね、なるほど
# ヒストグラムの作成
print(data)
pl.hist(data, bins=np.logspace(-11, -3, 500))
pl.gca().set_xscale("log")
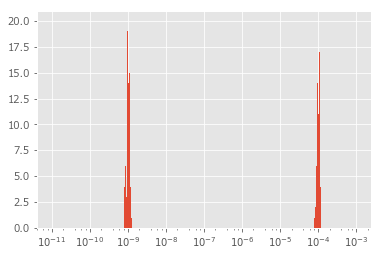
いけた。np.logspaceのオプションは「10^-11から10^3の範囲で500個のbinを作ってね」っていう感じ。