色の指定
color名
[Python でデータサイエンス: matplotlib で指定可能な色の名前と一覧]
(https://pythondatascience.plavox.info/matplotlib/%E8%89%B2%E3%81%AE%E5%90%8D%E5%89%8D)
cmap名
[beizのノート: matplotlibのcmap(colormap)パラメータの一覧。]
(https://beiznotes.org/matplot-cmap-list/)
RGB値+透明度Aによる色の指定
- 文字列で指定: '#????????',上から2桁ずつRGBAの順.透明は末尾2桁を00.
- タプルで指定: (R,G,B,A)の順,各値は0-1.透明は0.0
ちなみに全くの透明で見えないという状態は「透明度0%」と呼ぶ.
一覧は以下.
[原色大辞典]
(https://www.colordic.org/)
[Qiita@konifar: ARGBのカラーコード透明度まとめ]
(https://qiita.com/konifar/items/106731d8a35303606597)
参考:[Python by Examples: Transparent colors]
(http://python.omics.wiki/plot/matplotlib/transparent)
例:
import numpy as np
import matplotlib.pyplot as plt
x = np.arange(0.0, 15.0, 0.1)
y = np.sin(x)
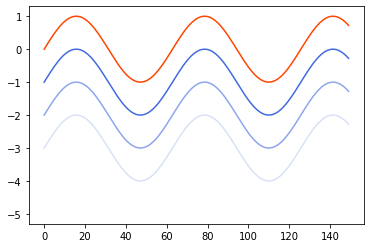
plt.plot(y      , color='#ff4500'  ) # orangered
plt.plot(y - 1.0, color='#4169e1'  ) # royalblue
plt.plot(y - 2.0, color='#4169e199') # royalblue,透明度60%
plt.plot(y - 3.0, color='#4169e133') # royalblue,透明度20%
plt.plot(y - 4.0, color='#4169e100') # royalblue,透明度0%なので見えない
色の名前→RGB値の変換にはcolors.to_rgb(color_name)
- to_rgb : (R, G, B) の長さ3タプル
- to_rgba: (R, G, B, A)の長さ4タプル
これで色の名前+透明値の指定が簡単に.
from matplotlib import colors
print(colors.to_rgb ('royalblue')) # (0.2549019607843137, 0.4117647058823529, 0.8823529411764706)
print(colors.to_rgba('royalblue')) # (0.2549019607843137, 0.4117647058823529, 0.8823529411764706, 1.0)
[stackoverflow: Python from color name to RGB]
(https://stackoverflow.com/questions/51350872/python-from-color-name-to-rgb)
imshowの色を離散的に指定
from matplotlib import colors
cmap = colors.ListedColormap(['white', 'red'])
bounds=[0,5,10]
norm = colors.BoundaryNorm(bounds, cmap.N)
img  = plt.imshow(zvals, interpolation='nearest',
                  cmap=cmap, norm=norm)
plt.colorbar(img, cmap=cmap, norm=norm, boundaries=bounds, ticks=[0, 5, 10])
1つのカラーマップから離散的に色を指定
複数の折れ線グラフを描くときなど.
cmap = plt.get_cmap("Blues")
for i in xrange(len(y)):
    plt.plot(x, y[i], c=cmap(float(i)/N))
Qiita@Tatejimaru137: Matplotlibのグラフの色を同系色で揃える(カラーマップ)
