まとめ
matplotlib.colors.DivergingNorm- ログスケール:
matplotlib.colors.LogNorm - symlog:
matplotlib.colors.SymLogNorm- この場合vmin == vmaxにしないと基準点がズレる
問題
import numpy as np
import matplotlib.pyplot as plt

np.random.seed( 1 )
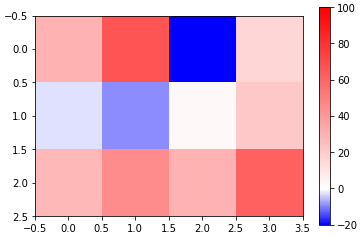
arr = np.random.uniform( -20.0, 100.0, (3,4) )
plt.imshow( arr, cmap='bwr' )
plt.colorbar()
の図で0と白(カラーマップの基準点)を一致させる
解決策
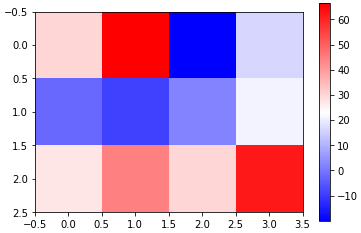
matplotlib.colors.DivergingNormの利用
matplotlib: matplotlib.colors.DivergingNorm
import matplotlib.colors as mcolors
norm = mcolors.DivergingNorm( vcenter=0.0, vmin=-20.0, vmax=100.0 )
plt.imshow( arr, cmap='bwr', norm=norm )
symlogにはmatplotlib.colors.SymLogNorm
matplotlib: matplotlib.colors.SymLogNorm
import matplotlib.colors as mcolors
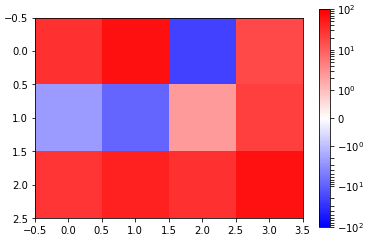
norm = mcolors.SymLogNorm( linthresh=1.0, linscale=1.0, vmin=-100.0, vmax=100.0 )
plt.imshow( arr, cmap='bwr', norm=norm )
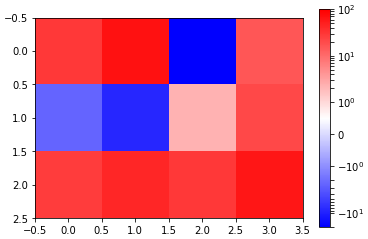
但し,vmin=-20.0とすると白の位置が0からズレる(下図のカラーバーに注目):
→vmin=-20.0にこだわるのであれば,配列を+と-の2回に分けて描画する必要がある?
参考
stackoverflow: Defining the midpoint of a colormap in matplotlib


