単語帳.毎回検索するのが面倒なので転載多め.元URLあり.
[matplotlib.pyplot.colorbar]
(https://matplotlib.org/3.1.0/api/_as_gen/matplotlib.pyplot.colorbar.html)
[Qiita@skotaro: matplotlibのcolorbarを解剖してわかったこと、あるいはもうcolorbar調整に苦労したくない人に捧げる話]
(https://qiita.com/skotaro/items/01d66a8c9902a766a2c0)
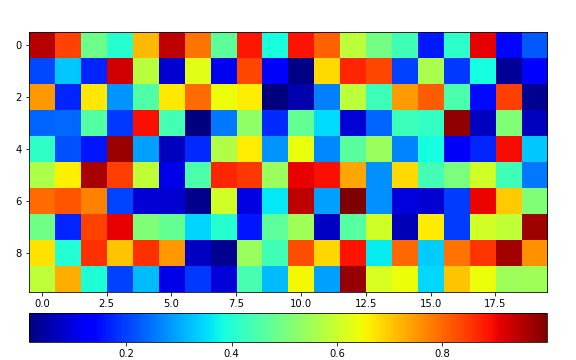
位置の調整:指定したAxesにカラーバーを描画
fig.add_axesによる指定
cax=オプションで指定.
fig = plt.figure(figsize=(8,5))
ax  = fig.add_axes((0.05, 0.15, 0.9, 0.8))
im  = ax.imshow(np.random.random((10, 20)), cmap='jet')
cax = fig.add_axes((0.05, 0.05, 0.9, 0.08))
plt.colorbar(im, orientation='horizontal', cax=cax)
make_axes_locatableによる指定
Axesの作り方が変わるだけでカラーバーの描き方は上記と同じ.
from mpl_toolkits.axes_grid1 import make_axes_locatable
divider = make_axes_locatable(ax)

# 右にスペースを作る
cax = divider.new_horizontal(size="2%", pad=0.05)
fig.add_axes(cax)
# OR
cax = divider.append_axes('right', '5%', pad='3%')

plt.colorbar(im, cax=cax)
Qiita@termoshtt: matplotlibでcolorbarを図にあわせる
しかしaxにprojectionを指定すると上手く行かない
Qiita@nishimuraatsushi: matplotlib で colorbar の大きさを揃える
カラーバーを単独で描画
plt.figure(figsize=(8, 0.5))
norm = mcolors.DivergingNorm(vcenter=0.0, vmin=-5, vmax=5)
im   = ax.imshow(np.array([[0,1]]), cmap='bwr', norm=norm)
plt.gca().set_visible(False)
cax = plt.axes([0.1, 0.2, 0.8, 0.6])
cb  = plt.colorbar(im, orientation='horizontal', cax=cax)
[stackoverflow: Standalone colorbar (matplotlib)]
(https://stackoverflow.com/questions/16595138/standalone-colorbar-matplotlib)
上記のコードは,一旦imshowで描画→その後にカラーバー用のAxesを定義,という順番.
- このカラーバーを単独で保存→pptx等で編集する
- カラーバーを描くべきAxesと画像 (上記コードの
im) を引数として渡す関数を作る
という場合はこれで十分.後者の例:
def draw_coloarbar(ax, im):
    return plt.colorbar(im, orientation='horizontal', cax=ax)

fig  = plt.figure(figsize=(8, 4))
ax   = fig.add_axes((0.05, 0.05, 0.9, 0.9))
im   = ax.imshow(np.array(np.random.random((10, 20))), cmap='jet')
cax = fig.add_axes([0.1, 0.45, 0.8, 0.1])
draw_coloarbar(cax, im)

しかし,画像を引数として渡さない=仮のimshowをする必要がある関数では
指定したAxesに(仮のimshowをした後で)カラーバーだけを描くという関数を作るときには位置指定の方法が異なる:
def draw_coloarbar2(ax):
    norm = mcolors.DivergingNorm(vcenter=0.0, vmin=-5, vmax=5)
    im = ax.imshow(np.array([[0,1]]), cmap='bwr', norm=norm)
    ax.set_visible(False)
    return plt.colorbar(im, orientation='horizontal', #cax=ax) # cax=だとカラーバーが表示されない
                        ax=ax, fraction=1.0)

fig  = plt.figure(figsize=(8, 4))
ax   = fig.add_axes((0.05, 0.05, 0.9, 0.9))
im   = ax.imshow(np.array(np.random.random((10, 20))), cmap='jet')
cax = fig.add_axes([0.1, 0.45, 0.8, 0.1])
draw_coloarbar2(cax)
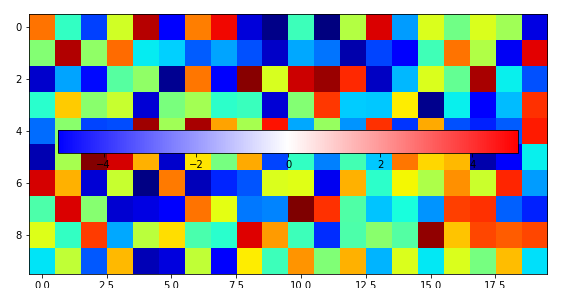
この場合はcax=ではなくax=で位置を指定する必要がある.
これらの引数の意味の違いはページトップのリンクに詳しい.
fraction=は指定したAxesの内どのぐらいの範囲をカラーバーに使うか,という引数.
形の調整
太さを変えるときはaspect=
plt.colorbar(aspect=20) # 細い
plt.colorbar(aspect=50) # 太い
[stackoverflow: How to decrease colorbar WIDTH in matplotlib?]
(https://stackoverflow.com/questions/33443334/how-to-decrease-colorbar-width-in-matplotlib)
カラーバーの両端に三角をつけるにはextend=
plt.colorbar(extend='both') # 両端に三角
目盛りの調整
目盛りの位置にはcbar.set_ticks()を,目盛りの文字列にはcbar.set_ticklabels()を使う.
[Akira Takeshima's Web Page: カラーバー]
(http://hydro.iis.u-tokyo.ac.jp/~akira/page/python/contents/plot/general/colorbar.html)
[matplotlib: pylab_examples example code: colorbar_tick_labelling_demo.py]
(https://matplotlib.org/examples/pylab_examples/colorbar_tick_labelling_demo.html)
目盛りの取得
ticksとticklabelsで呼び出し方が異なるので注意.
ticks = cbar.get_ticks()
ticklabels = [ticklabel.get_text() for ticklabel in cbar.ax.get_xticklabels()]
ticklabelsだけを変更するときも,set_ticks() must have been called.と怒られるので,
同じものをcbar.set_ticks(ticks)と明示する.
例えばカラーバーに単位を追加したい場合:
# 上記-5~5のカラーバーをcbarとして
ticks = cbar.get_ticks() # [-4. -2.  0.  2.  4.]
ticklabels = [ticklabel.get_text() for ticklabel in cbar.ax.get_xticklabels()]
# ['−4', '−2', '0', '2', '4']
ticklabels[-1] += ' [unit]'
cbar.set_ticks(ticks)
cbar.set_ticklabels(ticklabels)

フォントサイズの変更
cbar.ax.tick_params(labelsize=10)
[stackoverflow: Change fontsize of colorbars in matplotlib]
(https://stackoverflow.com/questions/40184696/change-fontsize-of-colorbars-in-matplotlib)