これは何か
matplotlib でグラフを作る時に、カラーバーがグラフをはみ出してダサい。
カラーバーをグラフに揃える方法を紹介する。
方法いろいろ
1 : 普通にプロット
colorbar1.py
import numpy
import matplotlib.pyplot

x = numpy.arange(10)
y = numpy.arange(10)
X, Y = numpy.meshgrid(x, y)
Z = X**2. + Y**2.

fig = matplotlib.pyplot.figure()
ax = fig.add_subplot(111)
im = ax.imshow(Z, interpolation='none')
fig.colorbar(im)

fig.savefig('colorbar1.png')
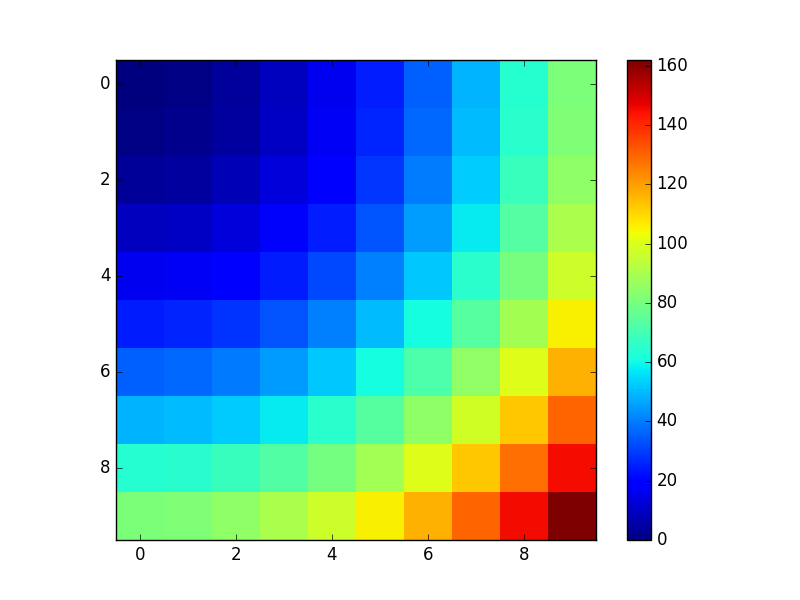
たまたまメインのグラフとカラーバーの高さが揃っていた例。
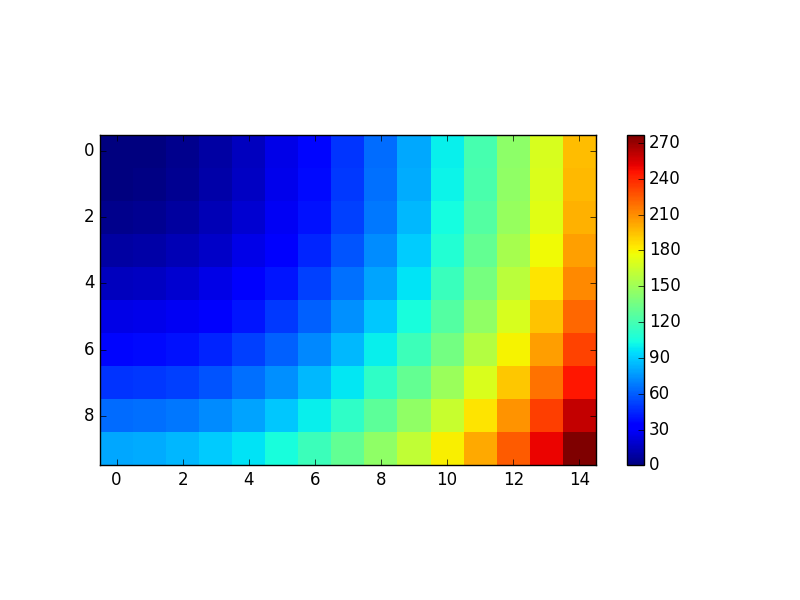
2 : 普通にプロット (残念バージョン)
colorbar2.py
import numpy
import matplotlib.pyplot

x = numpy.arange(15)
y = numpy.arange(10)
X, Y = numpy.meshgrid(x, y)
Z = X**2. + Y**2.

fig = matplotlib.pyplot.figure()
ax = fig.add_subplot(111)
im = ax.imshow(Z, interpolation='none')
fig.colorbar(im)

fig.savefig('colorbar2.png')
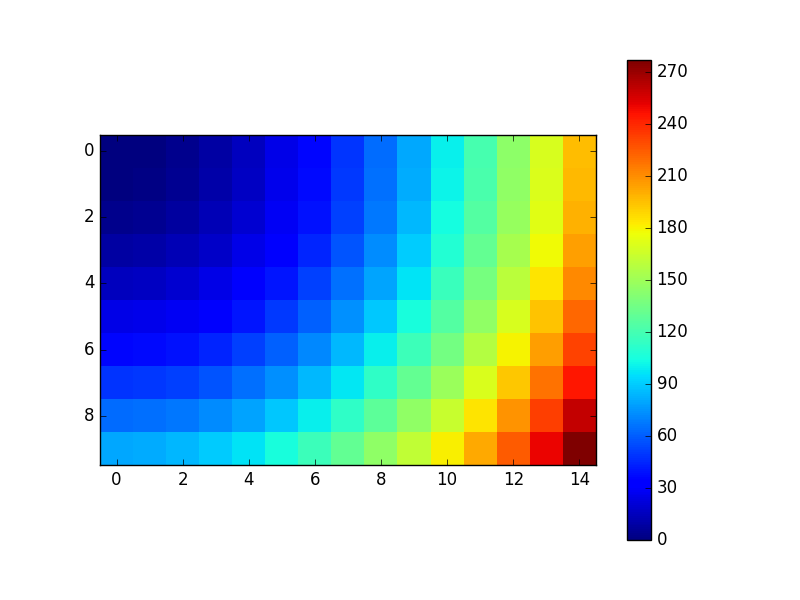
ひとたび、メインのグラフの縦横比が崩れると、カラーバーが上下にはみ出す。悲しい。。。
3 : mpl_toolkits.axes_grid1 を使う
colorbar3.py
import numpy
import matplotlib.pyplot
import mpl_toolkits.axes_grid1

x = numpy.arange(15)
y = numpy.arange(10)
X, Y = numpy.meshgrid(x, y)
Z = X**2. + Y**2.

fig = matplotlib.pyplot.figure()
ax = fig.add_subplot(111)
divider = mpl_toolkits.axes_grid1.make_axes_locatable(ax)
cax = divider.append_axes('right', '5%', pad='3%')
im = ax.imshow(Z, interpolation='none')
fig.colorbar(im, cax=cax)

fig.savefig('colorbar3.png')
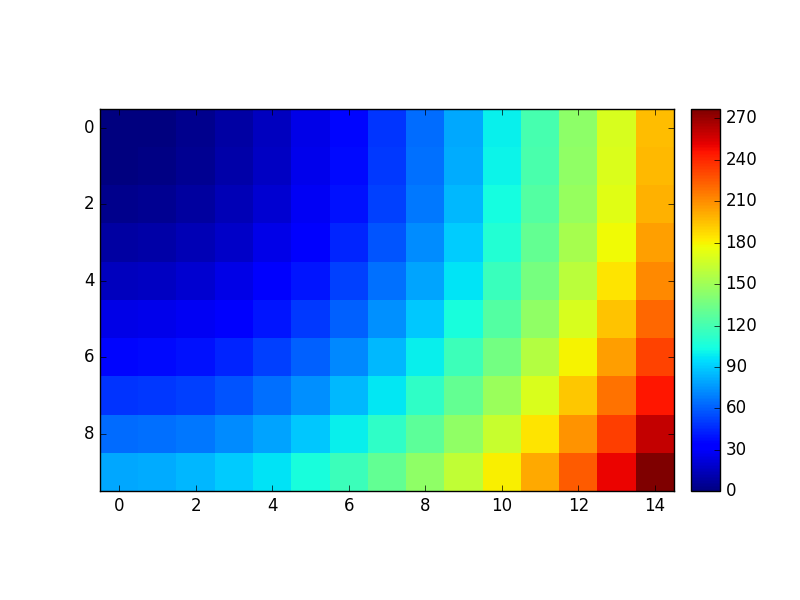
ネットで最も良くある例。mpl_toolkits.axes_grid1 の make_axes_locatable と append_axes を使う方法。これで解決。よかったよかった。
4 : でも、projection を指定してしまうと、、、
colorbar4.py
import numpy
import matplotlib.pyplot
import mpl_toolkits.axes_grid1

x = numpy.arange(15)
y = numpy.arange(10)
X, Y = numpy.meshgrid(x, y)
Z = X**2. + Y**2.

fig = matplotlib.pyplot.figure()
ax = fig.add_subplot(111, projection='polar')
divider = mpl_toolkits.axes_grid1.make_axes_locatable(ax)
cax = divider.append_axes('right', '5%', pad='3%')
im = ax.imshow(Z, interpolation='none')
fig.colorbar(im, cax=cax)

fig.savefig('colorbar4.png')
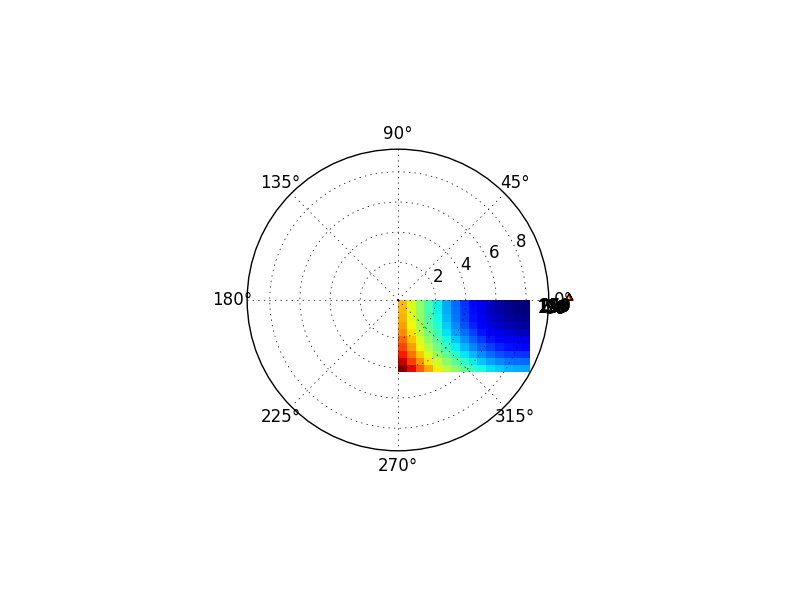
カラーバーが表示されない!?
なぜなら type(cax) が matplotlib.projections.polar.PolarAxes になっているから。append_axes() は projection 引数がなくて、ax の projection をそのまま使っている模様。なんとか projection を変えることはできないものだろうか。。。
5 : cax の position を自分で変える
colorbar4.py
import io
import numpy
import matplotlib.pyplot

x = numpy.arange(15)
y = numpy.arange(10)
X, Y = numpy.meshgrid(x, y)
Z = X**2. + Y**2.

fig = matplotlib.pyplot.figure()
ax = fig.add_subplot(111)
im = ax.imshow(Z, interpolation='none')
cax = fig.colorbar(im)

fig.savefig(io.BytesIO())

ax_pos = ax.get_position()
cax_pos0 = cax.ax.get_position()
cax_pos1 = [cax_pos0.x0, ax_pos.y0, cax_pos0.x1 - cax_pos0.x0, ax_pos.y1 - ax_pos.y0]
cax.ax.set_position(cax_pos1)

fig.savefig('colorbar5.png')
ax の position を get_position() で取得し、cax の set_position() を使って縦方向を揃えることができた。ただし、ax.get_position() が、fig.savefig() を実行するまで更新されない仕様(?)となっているので、fig.savefig() を2回呼び出すことになってしまった。この方法は fig.savefig(bbox_inches='tight') で使われている手法。