matplotlibのaxis関数は便利で、簡単に座標を調整してくれます。
axis("tight")で余白をなるべく少なくしてくれますし、
axis("image")で同じ事をアスペクト比を保ったまましてくれます。
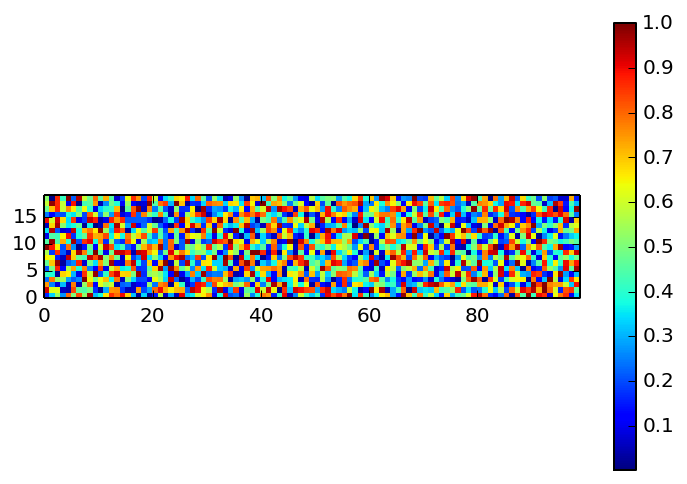
しかしcolorbarを付けるとややこしくなります。
以下のような単純な場合を考えます:
import numpy as np
import matplotlib.pyplot as plt

Nx = 100
Ny = 20

a = np.random.rand(Ny, Nx)

x = range(Nx)
y = range(Ny)
X, Y = np.meshgrid(x, y)

plt.pcolormesh(X, Y, a)
plt.axis("image")
plt.colorbar()
この時colorbarがどのように出てほしいかは個人の趣味と思いますが
これは私の好みではありません。
そこで登場するのがmake_axes_locatableです。
from mpl_toolkits.axes_grid1 import make_axes_locatable

fig, ax = plt.subplots()

image = ax.pcolormesh(X, Y, a)
ax.axis("image")

divider = make_axes_locatable(ax)
ax_cb = divider.new_horizontal(size="2%", pad=0.05)
fig.add_axes(ax_cb)
plt.colorbar(image, cax=ax_cb)
複数の図を生成する場合はこちらのコンパクトな方が良いと思います。
なお複数の図を生成する場合には
fig = plt.figure()
ax = plt.subplot(311)
のように取得すれば後は同じです。

