はじめに
この夏で興味のあることはぜんぶやろうときめたのでその3つめ(経路計画)(1つ目は強化学習, 2つ目はRNN(LSTM))
- RRT
- DWA
- A*
などを実装していく予定です
DWAについては理論編をすでにあげておいてあるのでぜひみてください
github:https://github.com/Shunichi09
今回のは
https://github.com/Shunichi09/Qiita/tree/master/Path_planning
環境
- python3.6.6
- Windows 10
- anaconda
- matplotlib 2.2.2
- numpy 1.14.3
経路計画とは
スタートからゴールまでの経路を引くことです
道を立てるみたいなものですね
しかし,経路計画にも2種類あります
1つ目が
- Global Path Planning
2つ目が
- Local Path Planning
です.それぞれの詳細を説明します.
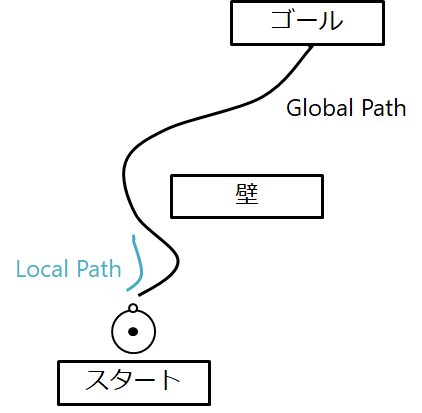
1つ目のGlobal Path Planningですが,
スタートからゴールまで引くこと
になります.大域的という意味からも分かりますが,完全にスタートからゴールまでPathを引きます
一方,Local Path Planning ですが,
あるエリアで経路計画します
これによって,あるエリアの中でゴールに最も近づくパスを生成するイメージです
イメージは下の図
よくやるのは,計算量の多い,Globalをはじめに一回行って,あとの逐一,変化する状況に合わせるための作業として(障害物回避など)はLocal Path Planningで最初に引いた経路を修正していくてきな感じでしょうか
RRTとは
Rapidly exploring random treeという経路計画法の一種です.
高速という利点があるので,Global Pathに用いられることが多くありますね
発想としてはランダムに道を捜索してうまくいったら良かったねという数うちゃあたる戦法です
さまざまな拡張手法が提案されて,ロボットのアームの軌道生成や,走行ロボットの軌道計画などにも使用されています
最適性はありません!
アルゴリズムは以下の感じ
- 初期点を選ぶ
- ランダムに点をあるエリアから選ぶ
- その選んだ点に最も近い点を選んで,事前に決めた量でその方向に伸ばす
- 目的を達成(ゴールにつくまで)永久に行う
イメージは下図
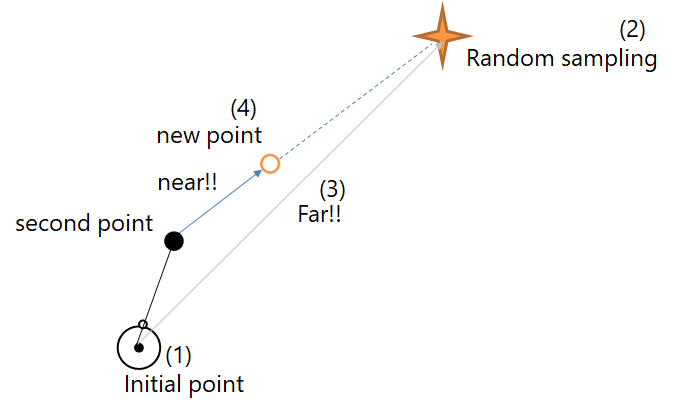
この図は2点うたれている場合を想定しています
この場合second pointの方が新たなランダムサンプリングに近いので!!
こっから伸ばします
今回はゴールは考えません
どのようにパスが広がっていくかをみていただければと思います.
プログラム
アルゴリズムはきわめて簡単ですね
# Link : https://qiita.com/MENDY/items/176cc16c746dc6135ef4

import numpy as np
import matplotlib.pyplot as plt
import matplotlib.animation as ani
import math

class RRT():
    def __init__(self, init_x, init_y):
        # 初期設定
        self.x = init_x
        self.y = init_y

        # パラメータ群
        # 伸ばし幅
        self.d = 0.1

        # 探索範囲
        self.MAX_x = 3
        self.MAX_y = 3
        self.min_x = -3
        self.min_y = -3

        # ノードを作成する
        # これはただのノード
        self.Nodes = np.array([[init_x, init_y]])
        # これはpath
        self.path_x = np.empty((0,2), float)
        self.path_y = np.empty((0,2), float)
        # samples
        self.samples = np.empty((0,2), float)

        self.nearest_node =None
        self.new_node =None

    def search(self):
        # random点を打つ(-1.5, 1.5の範囲で選ぶ)
        s_x = (np.random.rand() * self.MAX_x) - self.MAX_x/2
        s_y = (np.random.rand() * self.MAX_y) - self.MAX_y/2

        sample = np.array([s_x, s_y])
        self.samples = np.append(self.samples, [[s_x, s_y]], axis=0)

        # ノード探索
        distance = float('inf')
        self.nearest_node = None

        for i in range(self.Nodes.shape[0]):
            node = self.Nodes[i, :]
            part_MSE = (sample - node) * (sample - node)
            RMSE = math.sqrt(sum(part_MSE))

            # 距離が小さかったら追加
            if RMSE < distance:
                distance = RMSE
                self.nearest_node = node

        # 新ノードを作成
        pull = sample - self.nearest_node
        grad = math.atan2(pull[1], pull[0])

        d_x = math.cos(grad) * self.d
        d_y = math.sin(grad) * self.d

        self.new_node = self.nearest_node + np.array([d_x, d_y])

        return self.nearest_node, self.new_node


    def path_make(self):
        # 新ノードを追加
        self.Nodes = np.vstack((self.Nodes, self.new_node))

        self.path_x = np.append(self.path_x, np.array([[self.nearest_node[0], self.new_node[0]]]), axis=0)
        self.path_y = np.append(self.path_y, np.array([[self.nearest_node[1], self.new_node[1]]]), axis=0)

        return self.Nodes, self.path_x, self.path_y, self.samples

class Figures():
    def __init__(self):
        self.fig = plt.figure()
        self.axis = self.fig.add_subplot(111)

    def fig_set(self):
        # 初期設定
        MAX_x = 1.5
        min_x = -1.5
        MAX_y = 1.5
        min_y = -1.5

        self.axis.set_xlim(min_x, MAX_x)
        self.axis.set_ylim(min_y, MAX_y)

        # 軸
        self.axis.grid(True)

        # 縦横比
        self.axis.set_aspect('equal')

        # label
        self.axis.set_xlabel('X [m]')
        self.axis.set_ylabel('Y [m]')

    def plot(self, path_x, path_y, Nodes):
        self.axis.plot(path_x, path_y)
        self.axis.plot(Nodes[:, 0], Nodes[:, 1], '.', color='k')

        plt.show()

    def anim_plot(self, path_x, path_y, Nodes, samples):
        imgs = []

        for i in range(path_x.shape[1]):
            path_imgs = []
            # pathとサンプルを追加
            img_sample = self.axis.plot(samples[i, 0], samples[i, 1], '*', color='b')
            path_imgs.extend(img_sample)
            img_nodes = self.axis.plot(Nodes[:i+2, 0], Nodes[:i+2, 1], '.', color='k')
            path_imgs.extend(img_nodes)

            for k in range(i+1):
                img_path = self.axis.plot(path_x[:, k], path_y[:, k], color='b')
                path_imgs.extend(img_path)
                # print('k = {0}'.format(k))

            print('i = {0}'.format(i))
            imgs.append(path_imgs)

        animation = ani.ArtistAnimation(self.fig, imgs)

        print('save_animation?')
        shuold_save_animation = int(input())

        if shuold_save_animation:
            animation.save('basic_animation.gif', writer='imagemagick')
        plt.show()


def main():
    # figures
    figure = Figures()
    figure.fig_set()

    # pathmake
    path_planner = RRT(0.0, 0.0)
    iterations = 100

    for k in range(iterations):
        path_planner.search()
        Nodes, path_x, path_y, samples = path_planner.path_make()

    # img用に処理
    path_x = path_x.transpose()
    path_y = path_y.transpose()

    figure.anim_plot(path_x, path_y, Nodes, samples)

if __name__ == '__main__':
    main()
動画でみるとこんな感じ
うお
なんかすごい
ちなみに点を打つ数を増やせば増やすほど
になりますが,可視化は非常に時間がかかるのでご注意を!!
次回はゴールと障害物を考慮したいと思いますー