- 製造業出身のデータサイエンティストがお送りする記事
- 今回はAutoML ライブラリー(FLAML)を使ってみました。
はじめに
過去に他のAutoML ライブラリーやツールについては、別の記事に纏めておりますので下記をご参照ください。
FLAML とは
FLAMLとは、Microsoftが開発しているAutoML ライブラリです。
FLAML を使ってみた
必要なライブラリーは下記です。
pip install flaml
今回もUCI Machine Learning Repositoryで公開されているボストン住宅の価格データを用いて実施します。
# ライブラリーのインポート
import os
import pandas as pd
import numpy as np
import seaborn as sns
import matplotlib.pyplot as plt
%matplotlib inline
# ボストンの住宅価格データ
from sklearn.datasets import load_boston
# 前処理
from sklearn.preprocessing import StandardScaler
from sklearn.model_selection import train_test_split
# flaml
import flaml
from flaml import AutoML
from flaml.data import get_output_from_log
from flaml.ml import sklearn_metric_loss_score
# 評価指標
from sklearn.metrics import r2_score
from sklearn.metrics import mean_absolute_error
from sklearn.metrics import mean_squared_error
# データセットの読込み
boston = load_boston()
# 説明変数の格納
df = pd.DataFrame(boston.data, columns=boston.feature_names)
# 目的変数の追加
df["MEDV"] = boston.target
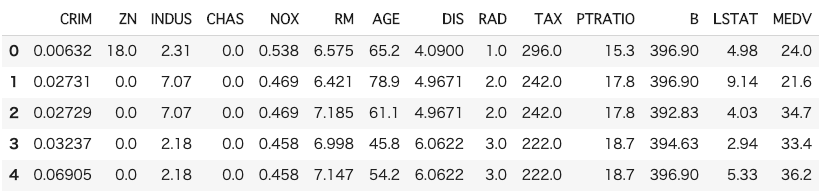
# データの中身を確認
df.head()
次にデータセットを分割します(train, test)。
# ランダムシード値
RANDOM_STATE = 10

# 学習データと評価データの割合
TEST_SIZE = 0.2

# 学習データと評価データを作成
x_train, x_test, y_train, y_test = train_test_split(
    df.iloc[:, 0 : df.shape[1] - 1],
    df.iloc[:, df.shape[1] - 1],
    test_size=TEST_SIZE,
    random_state=RANDOM_STATE,
)
次にパラメータをセットします。
# flamlのパラメータ設定
automl_settings = {
    "time_budget": 120,
    "metric": "r2",
    "task": "regression",
    "ensemble": False,
    "split_type": "stratified",
    "n_splits": 5,
    "seed": 10,
    "log_file_name": "boston.log",
}
次にモデルの学習を行います。
# flaml学習
automl = AutoML()
automl.fit(X_train=x_train, y_train=y_train, **automl_settings)
次にベストなモデルとハイパーパラメータを確認します。
print("Best ML leaner:", automl.best_estimator)
print("Best hyperparmeter config:", automl.best_config)
print("Best accuracy on validation data: {0:.4g}".format(1 - automl.best_loss))
print("Training duration of best run: {0:.4g} s".format(automl.best_config_train_time))

#Best ML leaner: extra_tree
# Best hyperparmeter config: {'n_estimators': 55, 'max_features': 0.5099336704072605, 'max_leaves': 251}
# Best accuracy on validation data: 0.8824
# Training duration of best run: 1.511 s
モデルのインスタンスは下記で確認できます。
# モデルのインスタンスを確認
automl.model.estimator

# ExtraTreesRegressor(max_features=0.5099336704072605, max_leaf_nodes=251,
                    n_estimators=55, n_jobs=-1)
今回は、ExtraTreesRegressorが選択されました。
次に予測を行います。
# flaml推論
y_pred = automl.predict(x_test)

# 評価
def calculate_scores(true, pred):
    """全ての評価指標を計算する

    Parameters
    ----------
    true (np.array)       : 実測値
    pred (np.array)       : 予測値

    Returns
    -------
    scores (pd.DataFrame) : 各評価指標を纏めた結果

    """
    scores = {}
    scores = pd.DataFrame(
        {
            "R2": r2_score(true, pred),
            "MAE": mean_absolute_error(true, pred),
            "MSE": mean_squared_error(true, pred),
            "RMSE": np.sqrt(mean_squared_error(true, pred)),
        },
        index=["scores"],
    )
    return scores


scores = calculate_scores(y_test, y_pred)
print(scores)
出力結果は下記のようになります。
              R2       MAE        MSE      RMSE
scores  0.892109  2.462619  11.283295  3.359062
最後にモデルの探索結果を可視化します。
(
    time_history,
    best_valid_loss_history,
    valid_loss_history,
    config_history,
    train_loss_history,
) = get_output_from_log(filename=automl_settings["log_file_name"], time_budget=120)

plt.title("Learning Curve")
plt.xlabel("Wall Clock Time (s)")
plt.ylabel("Validation R2")
plt.scatter(time_history, 1 - np.array(valid_loss_history))
plt.step(time_history, 1 - np.array(best_valid_loss_history), where="post")
plt.show()

さいごに
最後まで読んで頂き、ありがとうございました。
今回はFLAMLを使ってみました。PyCaretよりモデルの種類は少なそうですが、簡単に使えて精度の良いモデルが使えるので良さそうです。
訂正要望がありましたら、ご連絡頂けますと幸いです。