動作環境
GeForce GTX 1070 (8GB)
ASRock Z170M Pro4S [Intel Z170chipset]
Ubuntu 16.04 LTS desktop amd64
TensorFlow v1.2.1
cuDNN v5.1 for Linux
CUDA v8.0
Python 3.5.2
IPython 6.0.0 -- An enhanced Interactive Python.
gcc (Ubuntu 5.4.0-6ubuntu1~16.04.4) 5.4.0 20160609
GNU bash, version 4.3.48(1)-release (x86_64-pc-linux-gnu)
scipy v0.19.1
geopandas v0.3.0
MATLAB R2017b (Home Edition)
ADDA v.1.3b6
前回: make_pov_180121.py > v0.1-v0.3 > bashの処理(2007年)をPythonで実装(2018年) > 43分の処理は3.5秒になった
変更点
カメラ位置と光源位置をelevationとazimuthから計算するようにした。
# viewing geometry
ELEVATION_DEG = 30.0  # elevation angle [degree]
AZIMUTH_DEG = -60.0  # azimuth angle [degree]
VIEW_RADIUS = 30.0  # radius of the viewing geometry
上記の設定を使ってカメラ位置を計算する。
カメラ位置だけを変化させると光源の位置によって対象物が影に入ったため、光源位置も変更した。
光源位置はカメラ位置と同じにしている。
code v0.4
make_pov_180121.py
import numpy as np
import sys

'''
v0.4 Jan. 23, 2018 viewing geometry
  - [light_source] takes [LOCX], [LOCY], [LOCZ]
  - change [camera.location]
    + main() change [CONFIG_FORMAT]
    + add calc_xyz()
    + [CONFIG_FORMAT] takes [LOCX], [LOCY], [LOCZ]
    + add [VIEW_RADIUS]
    + add [ELEVATION_DEG], [AZIMUTH_DEG]
v0.3 Jan., 21, 2018
  - each particle is colored
  - [SHAPE_FORMAT] has color value template
    + [RED], [GREEN], [BLUE]
v0.2 Jan., 21, 2018
  - tweak [MONOMER_RADIUS] from 0.5 to 0.25
v0.1 Jan., 21, 2018
  - output [.pov] file
    + add main()
  - add [SHAPE_FORMAT]
  - add [CONFIG_FORMAT]
'''

# on Python 3.5.2
# coding rule: PEP8

# viewing geometry
ELEVATION_DEG = 30.0  # elevation angle [degree]
AZIMUTH_DEG = -60.0  # azimuth angle [degree]
VIEW_RADIUS = 30.0  # radius of the viewing geometry
#
zenith_deg = 90.0 - ELEVATION_DEG  # zenith angle [degree]

CONFIG_FORMAT = """
camera {
  location <LOCX, LOCY, LOCZ>
  look_at <0, 0, 0>
}
light_source { <LOCX, LOCY, LOCZ>
  color rgb <1.0, 1.0, 1.0>
}

background{color rgb <1.0,1.0,1.0>}
"""

SHAPE_FORMAT = """
sphere { <XXX, YYY, ZZZ>, RRR
  texture {
    pigment { color rgb <RED,GREEN,BLUE> }
    finish {      ambient 0.4    }
  }
}
"""

IN_FILE = 'LN-SHAPE'
OUT_FILE = "shape_180121.pov"
MONOMER_RADIUS = 0.25

RGBSET = [
    [0.40000000000000002, 0.76078431372549016, 0.6470588235294118],
    [0.40000000000000002, 0.76078431372549016, 0.6470588235294118],
    [0.9882352941176471, 0.55294117647058827, 0.3843137254901961],
    [0.55294117647058827, 0.62745098039215685, 0.79607843137254897],
    [0.90588235294117647, 0.54117647058823526, 0.76470588235294112],
    [0.65098039215686276, 0.84705882352941175, 0.32941176470588235],
    [0.65098039215686276, 0.84705882352941175, 0.32941176470588235],
    [1.0, 0.85098039215686272, 0.18431372549019609],
    [0.89803921568627454, 0.7686274509803922, 0.58039215686274515],
    [0.70196078431372544, 0.70196078431372544, 0.70196078431372544],
    [0.70196078431372544, 0.70196078431372544, 0.70196078431372544],
]

X_MAX = 10  # used to set colors


def calc_xyz(theta_deg, phi_deg, radius):
    ath = np.deg2rad(theta_deg)
    aph = np.deg2rad(phi_deg)
    x = radius * np.cos(aph) * np.sin(ath)
    y = radius * np.sin(aph) * np.sin(ath)
    z = radius * np.cos(ath)
    return x, y, z


def main():
    dat = np.genfromtxt(IN_FILE)
    with open(OUT_FILE, 'wb+') as fd:
        # camera position and lightsource position
        cax, cay, caz = calc_xyz(zenith_deg, AZIMUTH_DEG, VIEW_RADIUS)
        wrk = CONFIG_FORMAT.replace('LOCX', '%s' % cax)
        wrk = wrk.replace('LOCY', '%s' % cay)
        wrk = wrk.replace('LOCZ', '%s' % caz)
        wrk = np.array(wrk).reshape(1,)
        np.savetxt(fd, wrk, fmt='%s')
        # each monomer
        for elem in dat:
            wrk = SHAPE_FORMAT.replace('XXX', '%s' % elem[0])
            # position
            wrk = wrk.replace('YYY', '%s' % elem[1])
            wrk = wrk.replace('ZZZ', '%s' % elem[2])
            wrk = wrk.replace('RRR', '%s' % MONOMER_RADIUS)
            # color
            #    clidx = (elem[0] - (-50)) / (50 - (-50))
            clidx = (elem[0] - (-X_MAX)) / (X_MAX - (-X_MAX))
            clidx = clidx * len(RGBSET)
            if clidx < 0.0:
                clidx = 0.0
            acol = RGBSET[int(clidx)]
            wrk = wrk.replace('RED', '%s' % acol[0])
            wrk = wrk.replace('GREEN', '%s' % acol[1])
            wrk = wrk.replace('BLUE', '%s' % acol[2])
            #
            wrk = np.array(wrk).reshape(1,)
            np.savetxt(fd, wrk, fmt='%s')
    print('[%s] is produced' % OUT_FILE)


if __name__ == '__main__':
    main()
実行
LN-SHAPE @ Dropbox
を例として。
$ time python3 make_pov_180121.py
[shape_180121.pov] is produced

real    0m4.754s
user    0m4.516s
sys     0m0.348s
$ povray shape_180121.pov
生成された[shape_180121.png]を表示する。
$ eog shape_180121.png
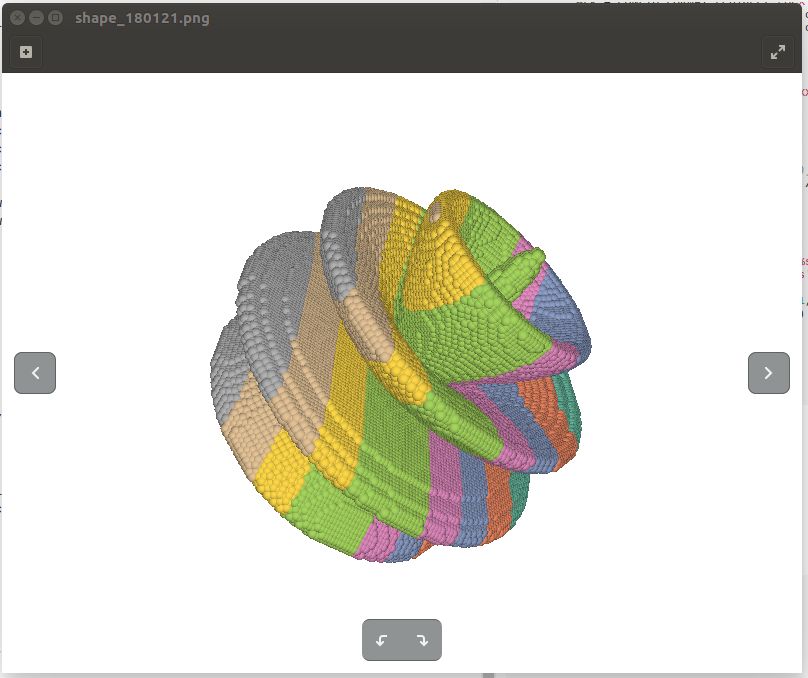
(elevation=30, azimuth=-60)の結果
関連
TODO
こちらでのMatplotlib描画と見えているのものが異なる。
座標系が異なるのだろうか。:MATLABとMatplotlib 3dの座標系 | viewの違い > view(azimuth=0) > MATLAB:xaxisが横軸 | Matplotlib:yaxisが横軸 > MatplotlibとMATLABで同じ表示にするには
1.2.1.1 Understanding POV-Ray's Coordinate System
高さ方向がYになっている。
X軸からY軸へ回した時、Zの負方向へ向かうため「左手系」のようだ。
v0.5 右手座標系から左手座標系へ変換
Povrayの座標系が「左手座標系」のため、y,zを入れ替えた。
make_pov_180121.py
import numpy as np
import sys

'''
v0.5 Jan. 23, 2018
  - convert [right-handed] to [left-handed] coordinate
    + interchange y and z
v0.4 Jan. 23, 2018 viewing geometry
  - [light_source] takes [LOCX], [LOCY], [LOCZ]
  - change [camera.location]
    + main() change [CONFIG_FORMAT]
    + add calc_xyz()
    + [CONFIG_FORMAT] takes [LOCX], [LOCY], [LOCZ]
    + add [VIEW_RADIUS]
    + add [ELEVATION_DEG], [AZIMUTH_DEG]
v0.3 Jan., 21, 2018
  - each particle is colored
  - [SHAPE_FORMAT] has color value template
    + [RED], [GREEN], [BLUE]
v0.2 Jan., 21, 2018
  - tweak [MONOMER_RADIUS] from 0.5 to 0.25
v0.1 Jan., 21, 2018
  - output [.pov] file
    + add main()
  - add [SHAPE_FORMAT]
  - add [CONFIG_FORMAT]
'''

# on Python 3.5.2
# coding rule: PEP8

# viewing geometry
ELEVATION_DEG = 30.0  # elevation angle [degree]
AZIMUTH_DEG = -60.0  # azimuth angle [degree]
VIEW_RADIUS = 30.0  # radius of the viewing geometry
#
zenith_deg = 90.0 - ELEVATION_DEG  # zenith angle [degree]

CONFIG_FORMAT = """
camera {
  location <LOCX, LOCY, LOCZ>
  look_at <0, 0, 0>
}
light_source { <LOCX, LOCY, LOCZ>
  color rgb <1.0, 1.0, 1.0>
}

background{color rgb <1.0,1.0,1.0>}
"""

SHAPE_FORMAT = """
sphere { <XXX, YYY, ZZZ>, RRR
  texture {
    pigment { color rgb <RED,GREEN,BLUE> }
    finish {      ambient 0.4    }
  }
}
"""

IN_FILE = 'LN-SHAPE'
OUT_FILE = "shape_180121.pov"
MONOMER_RADIUS = 0.25

RGBSET = [
    [0.40000000000000002, 0.76078431372549016, 0.6470588235294118],
    [0.40000000000000002, 0.76078431372549016, 0.6470588235294118],
    [0.9882352941176471, 0.55294117647058827, 0.3843137254901961],
    [0.55294117647058827, 0.62745098039215685, 0.79607843137254897],
    [0.90588235294117647, 0.54117647058823526, 0.76470588235294112],
    [0.65098039215686276, 0.84705882352941175, 0.32941176470588235],
    [0.65098039215686276, 0.84705882352941175, 0.32941176470588235],
    [1.0, 0.85098039215686272, 0.18431372549019609],
    [0.89803921568627454, 0.7686274509803922, 0.58039215686274515],
    [0.70196078431372544, 0.70196078431372544, 0.70196078431372544],
    [0.70196078431372544, 0.70196078431372544, 0.70196078431372544],
]

X_MAX = 10  # used to set colors


def calc_xyz(theta_deg, phi_deg, radius):
    ath = np.deg2rad(theta_deg)
    aph = np.deg2rad(phi_deg)
    x = radius * np.cos(aph) * np.sin(ath)
    y = radius * np.sin(aph) * np.sin(ath)
    z = radius * np.cos(ath)
    return x, y, z


def main():
    dat = np.genfromtxt(IN_FILE)
    with open(OUT_FILE, 'wb+') as fd:
        # camera position and lightsource position
        cax, cay, caz = calc_xyz(zenith_deg, AZIMUTH_DEG, VIEW_RADIUS)
        wrk = CONFIG_FORMAT.replace('LOCX', '%s' % cax)
        wrk = wrk.replace('LOCY', '%s' % caz)  # left-handed coord.
        wrk = wrk.replace('LOCZ', '%s' % cay)  # left-handed coord.
        wrk = np.array(wrk).reshape(1,)
        np.savetxt(fd, wrk, fmt='%s')
        # each monomer
        for elem in dat:
            wrk = SHAPE_FORMAT.replace('XXX', '%s' % elem[0])
            # position (left-handed coordinate)
            wrk = wrk.replace('YYY', '%s' % elem[2])
            wrk = wrk.replace('ZZZ', '%s' % elem[1])
            #
            wrk = wrk.replace('RRR', '%s' % MONOMER_RADIUS)
            # color
            #    clidx = (elem[0] - (-50)) / (50 - (-50))
            clidx = (elem[0] - (-X_MAX)) / (X_MAX - (-X_MAX))
            clidx = clidx * len(RGBSET)
            if clidx < 0.0:
                clidx = 0.0
            acol = RGBSET[int(clidx)]
            wrk = wrk.replace('RED', '%s' % acol[0])
            wrk = wrk.replace('GREEN', '%s' % acol[1])
            wrk = wrk.replace('BLUE', '%s' % acol[2])
            #
            wrk = np.array(wrk).reshape(1,)
            np.savetxt(fd, wrk, fmt='%s')
    print('[%s] is produced' % OUT_FILE)


if __name__ == '__main__':
    main()
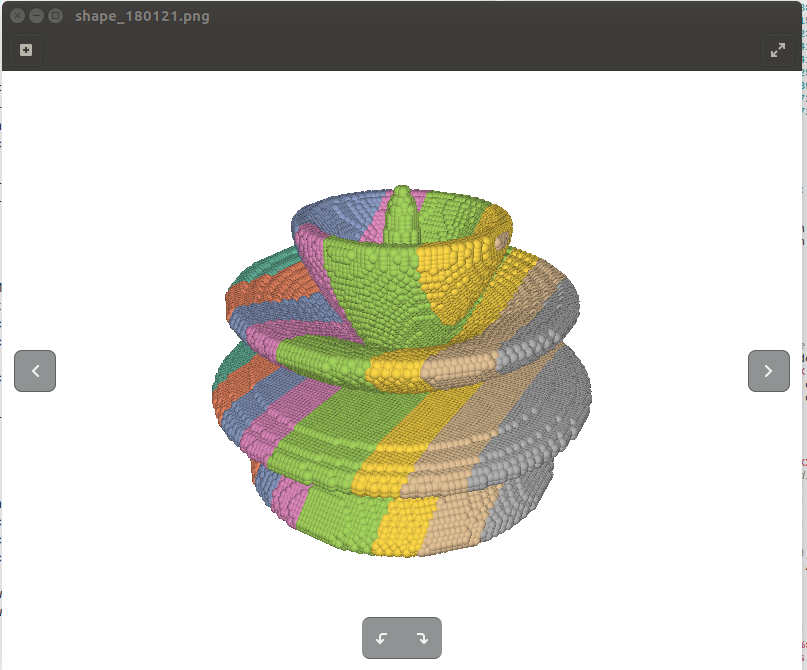
Matplotlibと似た方向にはなった。仰角が少し違うのだろうか。
(追記 2018/01/27)
Matplotlibでは以下の座標調整をしていた。この計算は本来はなくてもよい。
(X + SHIFT_POS) * 3.0