GeForce GTX 1070 (8GB)
ASRock Z170M Pro4S [Intel Z170chipset]
Ubuntu 16.04 LTS desktop amd64
TensorFlow v1.2.1
cuDNN v5.1 for Linux
CUDA v8.0
Python 3.5.2
IPython 6.0.0 -- An enhanced Interactive Python.
gcc (Ubuntu 5.4.0-6ubuntu1~16.04.4) 5.4.0 20160609
GNU bash, version 4.3.48(1)-release (x86_64-pc-linux-gnu)
scipy v0.19.1
geopandas v0.3.0
MATLAB R2017b (Home Edition)
ADDA v.1.3b6
This article is related to ADDA (light scattering simulator based on the discrete dipole approximation).
About
In this article, I show the tool to show the particle shape and save as three-view images reading from the [IntField-Y] file.
Requirement
The code uses Jupyter and Matplotlib. These components are required.
For Ubuntu 16.04 LTS, the installation procedure is available at the GitHub.
Note: Considering the influence of the Meltdown and Spectre as of January 08, 2018, the Ubuntu 16.04 LTS needs to be patched for the security. The security patching procedure is not written here
Code v0.1-v0.7
import matplotlib.pyplot as plt
from matplotlib import cm, colors
from mpl_toolkits.mplot3d import Axes3D
from pylab import rcParams
import numpy as np
import time
import contextlib

"""
v0.7 Jan. 08, 2018
  - save three view images (top, front, side)
v0.6 Jan. 08, 2018
  - print progress of the processing using the contextmanager
     - add using_oneline_print()
v0.5 Jan. 07, 2018
  - rename to [showParticleShape_18017.ipynb]
    + was [showChebyshev_170910.ipynb]
v0.4 Sep. 10, 2017
  - read ADDA file [IntField-Y]
v0.3 Sep. 10, 2017
  - set colors in X direction
  - increase number of spheres to 3000
v0.2 Sep. 10, 2017
  - show 8 spheres
  - lower the resolution of the sphere (from 100j to 6j)
v0.1 Sep. 10, 2017
  - show 2 spheres
"""

# coding rule: PEP8

rcParams['figure.figsize'] = 15, 10


# reference
# https://stackoverflow.com/questions/31768031/plotting-points-on-the-surface-of-a-sphere-in-pythons-matplotlib


# Reference:
# countdown.py at
# https://qiita.com/QUANON/items/c5868b6c65f8062f5876
# by @QUANON
@contextlib.contextmanager
def oneline_print():
    import sys
    original_write = sys.stdout.write  # keep the original function

    def overwrite(text):
        # delete from the cursor position to the end of line
        original_write('\033[K')
        original_write('\r')  # move to the beginning of line
        # remove new line at the end from the text and print()
        original_write(text.rstrip('\n'))

    sys.stdout.write = overwrite  # replace the function

    try:
        yield
    finally:
        sys.stdout.write = original_write  # set the original function
        print('*** [sys.stdout.write] is now the original')


def plot_spheres(xps, yps, zps):
    for idx, elem in enumerate(zip(xps, yps, zps)):
        axp, ayp, azp = elem
        if idx % 10 == 0:
            # print progress
            msg = "%.2f " % (idx / len(xps) * 100) + "%"
            print(msg)
        dx = x + axp
        dy = y + ayp
        dz = z + azp
        ax.plot_surface(
            dx, dy, dz,  rstride=1, cstride=1, color='c',
            alpha=1.0, linewidth=0,
            # 50: arbitrary chosen to set colors
            facecolors=plt.cm.Set2((dx - 0) / (50 - 0)))

start_time = time.time()

# Create a sphere
r = 1
pi = np.pi
cos = np.cos
sin = np.sin
phi, theta = np.mgrid[0.0:pi:6j, 0.0:2.0*pi:6j]
x = r*sin(phi)*cos(theta)
y = r*sin(phi)*sin(theta)
z = r*cos(phi)


# read from ADDA file
INPFILE = 'IntField-Y'
SHIFT_POS = 10.0
dat = np.genfromtxt(INPFILE, delimiter=' ', skip_header=1)
xpar, ypar, zpar = [], [], []
for elem in dat:
    axp, ayp, azp = elem[:3]
    # 3.0: arbitrary chosen to adjust sphere positions
    xpar += [(axp + SHIFT_POS) * 3.0]
    ypar += [(ayp + SHIFT_POS) * 3.0]
    zpar += [(azp + SHIFT_POS) * 3.0]

# Set colours and render
fig = plt.figure()
ax = fig.add_subplot(111, projection='3d')

SKIP_NUM = 2
xp = xpar[::SKIP_NUM]
yp = ypar[::SKIP_NUM]
zp = zpar[::SKIP_NUM]

with oneline_print():
    plot_spheres(xp, yp, zp)

ax.set_xlim([0, 50])
ax.set_ylim([0, 50])
ax.set_zlim([0, 50])
ax.set_aspect("equal")
ax.set_xlabel("X")
ax.set_ylabel("Y")
ax.set_zlabel("Z")
plt.tight_layout()

duration = time.time() - start_time
print("start showing plot. elapsed: %.3f sec" % duration)

# output three-view-images
ax.view_init(elev=90, azim=0)
plt.savefig("img_top.png")
ax.view_init(elev=0, azim=90)
plt.savefig("img_side.png")
ax.view_init(elev=0, azim=0)
plt.savefig("img_front.png")

# show in Jupyter
ax.view_init(elev=30, azim=-60)
plt.show()

duration = time.time() - start_time
print("finish showing plot. elapsed: %.3f sec" % duration)
How to use
- Create the [IntField-Y] file
- e.g.
./adda -store_int_field
- e.g.
- Symbolic link (or copy) the file to the directory of [showParticleShape_180107.ipynb]
- Run the code
- three-view images will be created
- img_front.png
- img_side.png
- img_top.png
- an image will be shown
- elevation: 30 degree
- azimuth: -60 degree
- three-view images will be created
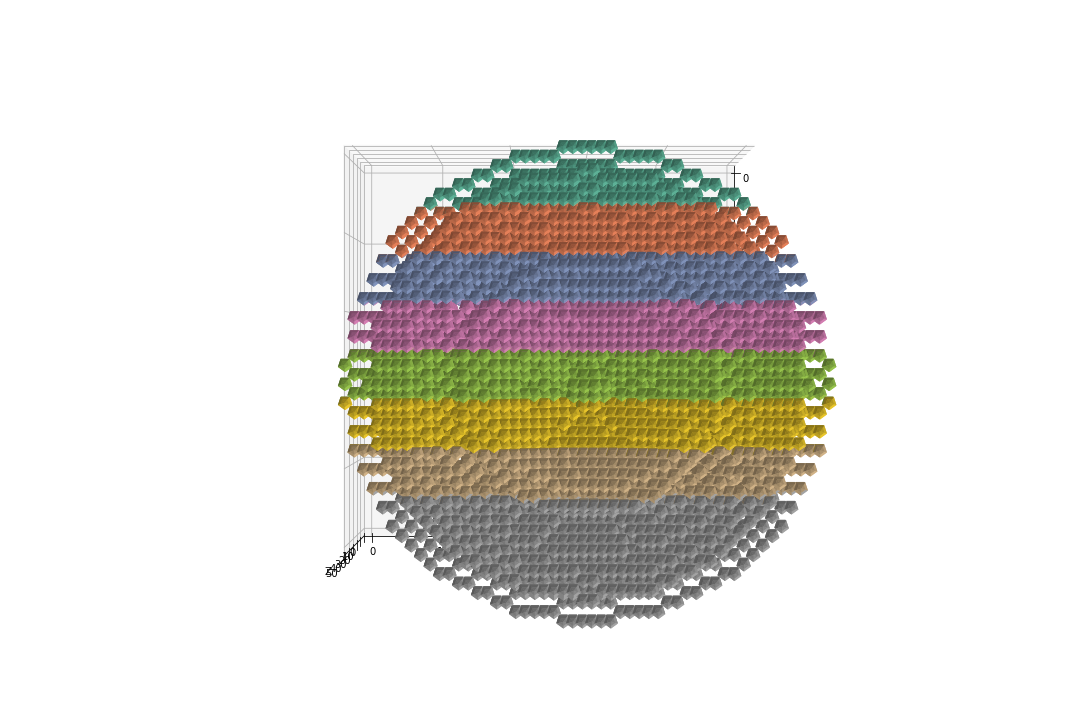
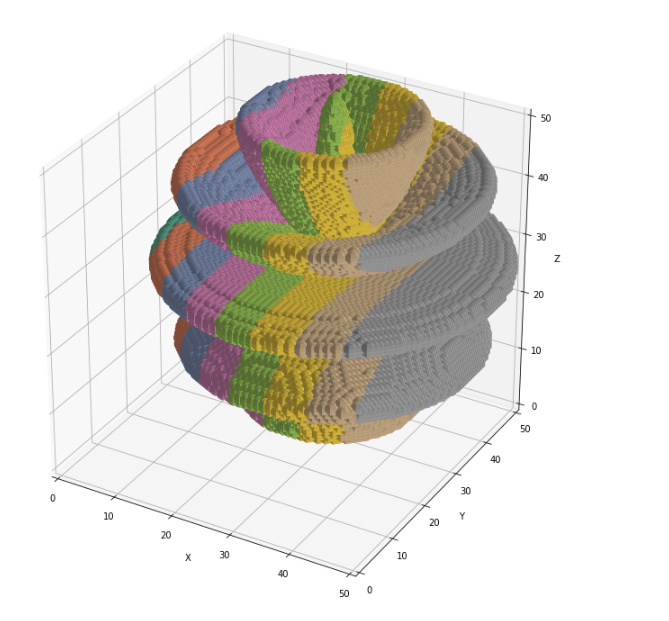
Example results 1
Following is the results for the Chebyshev particles.
./adda -grid 52 -shape chebyshev 0.7 12 -store_int_field
An image shown on the Jupyter

img_front.png

img_side.png

img_top.png
Note
The processing by the code is slow.
For the Chebyshev particle (N=25928), it took about 300 seconds to finish.
Example results 2
(Added Jan. 13, 2018)
./adda -grid 104 -shape chebyshev 0.7 12 -store_int_field
For this configuration, N = 206,800.
It took 2569sec(43min) for this result.
An image shown on the Jupyter
img_front.png

img_side.png

img_top.png

code v0.8
import matplotlib.pyplot as plt
from matplotlib import cm, colors
from mpl_toolkits.mplot3d import Axes3D
from pylab import rcParams
import numpy as np
import time
import contextlib


"""
v0.8 Jan. 20, 2018
  - add main()
  - fix bug > plot_spheres() uses globally defined variables [x, y, z]
v0.7 Jan. 08, 2018
  - save three view images (top, front, side)
v0.6 Jan. 08, 2018
  - print progress of the processing using the contextmanager
     - add using_oneline_print()
v0.5 Jan. 07, 2018
  - rename to [showParticleShape_18017.ipynb]
    + was [showChebyshev_170910.ipynb]
v0.4 Sep. 10, 2017
  - read ADDA file [IntField-Y]
v0.3 Sep. 10, 2017
  - set colors in X direction
  - increase number of spheres to 3000
v0.2 Sep. 10, 2017
  - show 8 spheres
  - lower the resolution of the sphere (from 100j to 6j)
v0.1 Sep. 10, 2017
  - show 2 spheres
"""

# coding rule: PEP8

rcParams['figure.figsize'] = 15, 10


# reference
# https://stackoverflow.com/questions/31768031/plotting-points-on-the-surface-of-a-sphere-in-pythons-matplotlib


# Reference:
# countdown.py at
# https://qiita.com/QUANON/items/c5868b6c65f8062f5876
# by @QUANON
@contextlib.contextmanager
def oneline_print():
    import sys
    original_write = sys.stdout.write  # keep the original function

    def overwrite(text):
        # delete from the cursor position to the end of line
        original_write('\033[K')
        original_write('\r')  # move to the beginning of line
        # remove new line at the end from the text and print()
        original_write(text.rstrip('\n'))

    sys.stdout.write = overwrite  # replace the function

    try:
        yield
    finally:
        sys.stdout.write = original_write  # set the original function
        print('*** [sys.stdout.write] is now the original')


def plot_spheres(ax, cx, cy, cz, xps, yps, zps):
    for idx, elem in enumerate(zip(xps, yps, zps)):
        axp, ayp, azp = elem
        #print(axp, ayp, azp)
        if idx % 10 == 0:
            # print progress
            msg = "%.2f " % (idx / len(xps) * 100) + "%"
            print(msg)
        dx = cx + axp
        dy = cy + ayp
        dz = cz + azp
        ax.plot_surface(
            dx, dy, dz,  rstride=1, cstride=1, color='c',
            alpha=1.0, linewidth=0,
            # 50: arbitrary chosen to set colors
            facecolors=plt.cm.Set2((dx - 0) / (50 - 0)))


def main():
    # Create a sphere
    r = 1
    pi = np.pi
    cos = np.cos
    sin = np.sin
    phi, theta = np.mgrid[0.0:pi:6j, 0.0:2.0*pi:6j]
    cx = r*sin(phi)*cos(theta)
    cy = r*sin(phi)*sin(theta)
    cz = r*cos(phi)

    #def main():
    start_time = time.time()

    # read from ADDA file
    INPFILE = 'IntField-Y'
    SHIFT_POS = 10.0
    dat = np.genfromtxt(INPFILE, delimiter=' ', skip_header=1)
    xpar, ypar, zpar = [], [], []
    for elem in dat:
        axp, ayp, azp = elem[:3]
        # 3.0: arbitrary chosen to adjust sphere positions
        xpar += [(axp + SHIFT_POS) * 3.0]
        ypar += [(ayp + SHIFT_POS) * 3.0]
        zpar += [(azp + SHIFT_POS) * 3.0]

    # Set colours and render
    fig = plt.figure()
    ax = fig.add_subplot(111, projection='3d')

    SKIP_NUM = 2
    xp = xpar[::SKIP_NUM]
    yp = ypar[::SKIP_NUM]
    zp = zpar[::SKIP_NUM]

    with oneline_print():
        plot_spheres(ax, cx, cy, cz, xp, yp, zp)

    ax.set_xlim([0, 50])
    ax.set_ylim([0, 50])
    ax.set_zlim([0, 50])
    ax.set_aspect("equal")
    ax.set_xlabel("X")
    ax.set_ylabel("Y")
    ax.set_zlabel("Z")
    plt.tight_layout()

    duration = time.time() - start_time
    print("start showing plot. elapsed: %.3f sec" % duration)

    # output three-view-images
    ax.view_init(elev=90, azim=0)
    plt.savefig("img_top.png")
    ax.view_init(elev=0, azim=90)
    plt.savefig("img_side.png")
    ax.view_init(elev=0, azim=0)
    plt.savefig("img_front.png")

    # show in Jupyter
    ax.view_init(elev=30, azim=-60)
    plt.show()

    duration = time.time() - start_time
    print("finish showing plot. elapsed: %.3f sec" % duration)

if __name__ == '__main__':
    main()