動作環境
GeForce GTX 1070 (8GB)
ASRock Z170M Pro4S [Intel Z170chipset]
Ubuntu 14.04 LTS desktop amd64
TensorFlow v0.11
cuDNN v5.1 for Linux
CUDA v8.0
Python 2.7.6
IPython 5.1.0 -- An enhanced Interactive Python.
関連 http://qiita.com/7of9/items/b364d897b95476a30754
sine curveを学習した時のweightとbiasをもとに自分でネットワークを再現して出力を計算しようとしている。
http://qiita.com/7of9/items/b7d38e174d4052b74cae
の続き。
TensorFlowの処理で出力したweight, biasを読み込んだ別pythonプログラムでsine curveの再現に失敗している。
input.csv生成
code (sigmoid_onlyHidden.py)
TensorFlow側でweight, biasの出力位置(model_variables = slim.get_model_variables()以下3行)を下の方に変更してみた。
tryの中で出力すると、本来欲しいweight, biasを出力できていないのでは、という考え。
sigmoid_onlyHidden.py
# !/usr/bin/env python
# -*- coding: utf-8 -*-

import sys
import tensorflow as tf
import tensorflow.contrib.slim as slim
import numpy as np

filename_queue = tf.train.string_input_producer(["input.csv"])

# prase CSV
reader = tf.TextLineReader()
key, value = reader.read(filename_queue)
input1, output = tf.decode_csv(value, record_defaults=[[0.], [0.]])
inputs = tf.pack([input1])
output = tf.pack([output])

batch_size=4 # [4]
inputs_batch, output_batch = tf.train.shuffle_batch([inputs, output], batch_size, capacity=40, min_after_dequeue=batch_size)

input_ph = tf.placeholder("float", [None,1])
output_ph = tf.placeholder("float",[None,1])

## network
hiddens = slim.stack(input_ph, slim.fully_connected, [7,7,7],
  activation_fn=tf.nn.sigmoid, scope="hidden")
# prediction = slim.fully_connected(hiddens, 1, activation_fn=tf.nn.sigmoid, scope="output")
prediction = slim.fully_connected(hiddens, 1, activation_fn=None, scope="output")
loss = tf.contrib.losses.mean_squared_error(prediction, output_ph)

train_op = slim.learning.create_train_op(loss, tf.train.AdamOptimizer(0.001))

init_op = tf.initialize_all_variables()

with tf.Session() as sess:
  coord = tf.train.Coordinator()
  threads = tf.train.start_queue_runners(sess=sess, coord=coord)

  try:
    sess.run(init_op)
    for i in range(30000): #[10000]
      inpbt, outbt = sess.run([inputs_batch, output_batch])
      _, t_loss = sess.run([train_op, loss], feed_dict={input_ph:inpbt, output_ph: outbt})

      if (i+1) % 100 == 0:
        print("%d,%f" % (i+1, t_loss))

#    # output to npy
#    model_variables = slim.get_model_variables()
#    res = sess.run(model_variables)
#    np.save('model_variables.npy', res)

  finally:
    coord.request_stop()


  # output to npy
  model_variables = slim.get_model_variables()
  res = sess.run(model_variables)
  np.save('model_variables.npy', res)


# output trained curve
  print 'output' # used to separate from above lines (grep -A 200 output [outfile])
  for loop in range(10):
    inpbt, outbt = sess.run([inputs_batch, output_batch])
    pred = sess.run([prediction], feed_dict={input_ph:inpbt, output_ph: outbt})
    for din,dout in zip(inpbt, pred[0]):
      print '%.5f,%.5f' % (din,dout)


  coord.join(threads)
model_variables.npy の作り直し
実行
$ python sigmoid_onlyHidden.py
TensorFlow Predictionファイル(res.161210_1958.cut)を作る場合はこちら
実行
$python sigmoid_onlyHidden.py > res.161210_1958.org
$grep -A 200 output res.161210_1958.org > res.161210_1958.cut
$vi res.161210_1958.cut # (1行目を削除)
sine curveの再現
reproduce_sine.py
'''
v0.3 Dec. 11, 2016
	- add output_debugPrint()
	- fix bug > calc_sigmoid() was using positive for exp()
v0.2 Dec. 10, 2016
	- calc_conv() takes [applyActFnc] argument
v0.1 Dec. 10, 2016
	- add calc_sigmoid()
	- add fully_connected network
	- add input data for sine curve
=== [read_model_var.py] branched to [reproduce_sine.py] ===

v0.4 Dec. 10, 2016
	- add 2x2 network example
v0.3 Dec. 07, 2016
	- calc_conv() > add bias
v0.2 Dec. 07, 2016
	- fix calc_conv() treating src as a list
v0.1 Dec. 07, 2016
	- add calc_conv()
'''

import numpy as np
import math
import sys

model_var = np.load('model_variables.npy')


# to ON/OFF debug print at one place
def output_debugPrint(str):
#	print(str)
	pass # no operation

output_debugPrint( ("all shape:",(model_var.shape)) )

def calc_sigmoid(x):
	return 1.0 / (1.0 + math.exp(-x))

def calc_conv(src, weight, bias, applyActFnc):
	wgt = weight.shape
#	print wgt # debug
	#conv = list(range(bias.size))
	conv = [0.0] * bias.size

	# weight
	for idx1 in range(wgt[0]):
		for idx2 in range(wgt[1]):
			conv[idx2] = conv[idx2] + src[idx1] * weight[idx1,idx2]
	# bias
	for idx2 in range(wgt[1]):
		conv[idx2] = conv[idx2] + bias[idx2]
	# activation function
	if applyActFnc:
		for idx2 in range(wgt[1]):
			conv[idx2] = calc_sigmoid(conv[idx2])

	return conv # return list

inpdata = np.linspace(0, 1, 30).astype(float).tolist()

# debug
for idx in range(8):
	output_debugPrint(model_var[idx].shape)
# sys.exit()


for din in inpdata:
	# input layer (1 node)
	#
	# hidden layer 1 (7 node)
	inlist = [ din ]
	outdata = calc_conv(inlist, model_var[0], model_var[1], applyActFnc=True)
	# hidden layer 2 (7 node)
	outdata = calc_conv(outdata, model_var[2], model_var[3], applyActFnc=True)
	# hidden layer 3 (7 node)
	outdata = calc_conv(outdata, model_var[4], model_var[5], applyActFnc=True)
	# output layer (1 node)
	outdata = calc_conv(outdata, model_var[6], model_var[7], applyActFnc=False)
	dout = outdata[0] # output is 1 node
	print '%.3f, %.3f' % (din,dout)
実行
$ python reproduce_sine.py > res.reprod_sine
Jupyterでの表示
%matplotlib inline

import numpy as np
import matplotlib.pyplot as plt

data1 = np.loadtxt('res.161210_1958.cut', delimiter=',')
inp1 = data1[:,0]
out1 = data1[:,1]
data2 = np.loadtxt('res.reprod_sine', delimiter=',')
inp2 = data2[:,0]
out2 = data2[:,1]

fig = plt.figure()
ax1 = fig.add_subplot(1,1,1)

ax1.scatter(inp1, out1, label='TensorFlow prediction', color='blue', marker='o')
ax1.scatter(inp2, out2, label='from model_var.npy', color='red',marker='x')

ax1.set_xlabel('x')
ax1.set_ylabel('sine(x) prediction')
ax1.grid(True)
ax1.legend()
ax1.set_xlim([0,1.0])

fig.show()
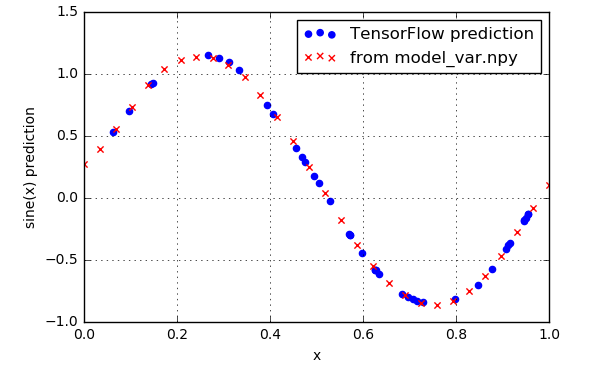
the peggiesの「グライダー」を聞きながら、気分よくsine curveを再現できた。