動作環境
GeForce GTX 1070 (8GB)
ASRock Z170M Pro4S [Intel Z170chipset]
Ubuntu 14.04 LTS desktop amd64
TensorFlow v0.11
cuDNN v5.1 for Linux
CUDA v8.0
Python 2.7.6
IPython 5.1.0 -- An enhanced Interactive Python.
関連 http://qiita.com/7of9/items/b364d897b95476a30754
sine curveを学習した時のweightとbiasをもとに自分でネットワークを再現して出力を計算しようとしている。
http://qiita.com/7of9/items/b52684b0df64b6561a48
の続き
http://qiita.com/7of9/items/7e45a69c822900a80c67
においてsine curveの学習失敗を補正できたようなので、再度model_variables.npyから読み込んだweightとbiasからsine curveを作ってみる。
code v0.3
- v0.2 : applyActFncを追加して、sigmoid / linearの切り替えに対応
- v0.3
- calc_sigmoid()の間違い修正
- デバッグ用出力関数を追加。デバッグ不要時にコメントアウトする
- コメントアウト時のエラー回避のため、no operationに相当する passを使用 : link
reproduce_sine.py
'''
v0.3 Dec. 11, 2016
	- add output_debugPrint()
	- fix bug > calc_sigmoid() was using positive for exp()
v0.2 Dec. 10, 2016
	- calc_conv() takes [applyActFnc] argument
v0.1 Dec. 10, 2016
	- add calc_sigmoid()
	- add fully_connected network
	- add input data for sine curve
=== [read_model_var.py] branched to [reproduce_sine.py] ===

v0.4 Dec. 10, 2016
	- add 2x2 network example
v0.3 Dec. 07, 2016
	- calc_conv() > add bias
v0.2 Dec. 07, 2016
	- fix calc_conv() treating src as a list
v0.1 Dec. 07, 2016
	- add calc_conv()
'''

import numpy as np
import math
import sys

model_var = np.load('model_variables.npy')


# to ON/OFF debug print at one place
def output_debugPrint(str):
#	print(str)
	pass # no operation

output_debugPrint( ("all shape:",(model_var.shape)) )

def calc_sigmoid(x):
	return 1.0 / (1.0 + math.exp(-x))

def calc_conv(src, weight, bias, applyActFnc):
	wgt = weight.shape
#	print wgt # debug
	#conv = list(range(bias.size))
	conv = [0.0] * bias.size
	# weight
	for idx1 in range(wgt[0]):
		for idx2 in range(wgt[1]):
			conv[idx2] = conv[idx2] + src[idx1] * weight[idx1,idx2]
	# bias
	for idx2 in range(wgt[1]):
		conv[idx2] = conv[idx2] + bias[idx2]
	# activation function
	if applyActFnc:
		for idx2 in range(wgt[1]):
			conv[idx2] = calc_sigmoid(conv[idx2])

	return conv # return list

inpdata = np.linspace(0, 1, 30).astype(float).tolist()


for din in inpdata:
	# input layer (7 node)
	inlist = [ din ]
	outdata = calc_conv(inlist, model_var[0], model_var[1], applyActFnc=True)
	# hidden layer 1 (7 node)
	outdata = calc_conv(outdata, model_var[2], model_var[3], applyActFnc=True)
	# hidden layer 2 (7 node)
	outdata = calc_conv(outdata, model_var[4], model_var[5], applyActFnc=True)
	# output layer (1 node)
	outdata = calc_conv(outdata, model_var[6], model_var[7], applyActFnc=False)
	dout = outdata[0] # ouput is 1 node
	print '%.3f, %.3f' % (din,dout)
実行
$ python reproduce_sine.py > res.reprod_sine
Jupyter表示
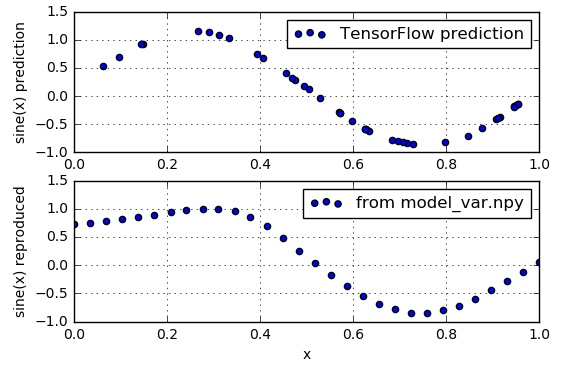
以下を比較した。
- TensorFlowのpredictionの結果
- model_variables.npyからのweight,biasを使って計算
%matplotlib inline

import numpy as np
import matplotlib.pyplot as plt

data1 = np.loadtxt('res.161210_1958.cut', delimiter=',')
inp1 = data1[:,0]
out1 = data1[:,1]
data2 = np.loadtxt('res.reprod_sine', delimiter=',')
inp2 = data2[:,0]
out2 = data2[:,1]

fig = plt.figure()
ax1 = fig.add_subplot(2,1,1)
ax2 = fig.add_subplot(2,1,2)

ax1.scatter(inp1, out1, label='TensorFlow prediction')
ax2.scatter(inp2, out2, label='from model_var.npy')

# ax1.set_title('First line plot')
ax1.set_xlabel('x')
ax1.set_ylabel('sine(x) prediction')
ax1.grid(True)
ax1.legend()
ax1.set_xlim([0,1.0])

ax2.set_xlabel('x')
ax2.set_ylabel('sine(x) reproduced')
ax2.grid(True)
ax2.legend()
ax2.set_xlim([0,1.0])

fig.show()
When he (Alladin) first rubs the lamp. The Genie appears,
イデよsine curve。
もうちょっと。
