はじめに
ベクトルタイルを地図に表示する際、拡大域(詳細地図)でも表示させたいのにNot Foundエラーが出て表示できないといったことは無いでしょうか?
ベクトルタイルの中でも静的なベクトルタイルファイル(PBFまたはMVTファイル等)はパフォーマンスに優れていますが、地図のズームレベルの高い拡大域までファイルを出力すると、長時間の出力プロセスや膨大なファイル数が要求されます。作り手のほとんどは出力するズームレベルを絞って対応するかと思います。
ベクトルタイルを利用する側は、地図で使用する位置情報ライブラリの設定を調整することで、拡大域での地物表示を試みるかと思います。その調整方法をまとめている例は少ないと感じたので、今回まとめておきたいと思いました。尚調べた位置情報ライブラリは、以下になります。
各ライブラリの導入部分等は今回割愛させていただきますが、弊社記事でもそれぞれ何回か扱っていますので、よろしければご参照下さい。
Leafletを使って国土地理院ベクトルタイルに町丁目ポリゴンを表示してみる
deck.glを使ってGoogle Mapにベクトルタイルを描画してみる
不動産情報ライブラリAPIのベクトルタイルをMapLibreで表示してみる
使用したベクトルタイル
サンプルコードを作成する際に使用したベクトルタイルは、TerraMap API の町丁目ポリゴン(レイヤー名:chomoku)を tippicanoe でPBFファイル化したものです。
※ 各サンプルコードは、ズームレベル 0 ~ 11 のPBFファイルが配信されていることを想定に書かれています。
各ライブラリでの表示方法
各ライブラリを使用したソースは以下のようになります。
どのライブラリにも共通して言えるのは、特定のプロパティにPBFファイルが配信されている最大ズームレベル(この記事では11)を設定しないと、最大ズームレベルを超えたリクエストが発生してNot Foundエラーが起こるということです。
Leaflet
Leafletでは以下のようにVectorGrid.ProtobufのmaxNativeZoomに対して最大ズームレベル11を設定します。
<!DOCTYPE html>
<html lang="ja">
<head>
<meta charset="UTF-8" />
<title>Leafletで町丁目ベクトルタイルを表示</title>
<link
rel="stylesheet"
href="https://unpkg.com/leaflet@1.9.3/dist/leaflet.css"
integrity="sha256-kLaT2GOSpHechhsozzB+flnD+zUyjE2LlfWPgU04xyI="
crossorigin=""
/>
<script
src="https://unpkg.com/leaflet@1.9.3/dist/leaflet.js"
integrity="sha256-WBkoXOwTeyKclOHuWtc+i2uENFpDZ9YPdf5Hf+D7ewM="
crossorigin=""
></script>
<script src="https://unpkg.com/leaflet.vectorgrid@latest/dist/Leaflet.VectorGrid.bundled.js"></script>
</head>
<body>
<div id="map" style="width: 100%; height: 95vh"></div>
<script>
const map = L.map("map", {maxZoom: 18}).setView([35.6727, 139.662], 11);
L.tileLayer(
"https://tile.openstreetmap.org/{z}/{x}/{y}.png",
{
attribution:
'© <a href="https://www.openstreetmap.org/copyright">OpenStreetMap</a> contributors',
}
).addTo(map);
L.vectorGrid
.protobuf(
"http://localhost:5500/tiles/{z}/{x}/{y}.pbf",
{
// PBFがある最大ズームレベル
maxNativeZoom: 11,
vectorTileLayerStyles: {
// chomokuレイヤーのスタイル設定
chomoku: {
weight: 0.5,
color: "blue",
fill: true,
fillColor: "blue",
}
}
}
)
.addTo(map);
</script>
</body>
</html>
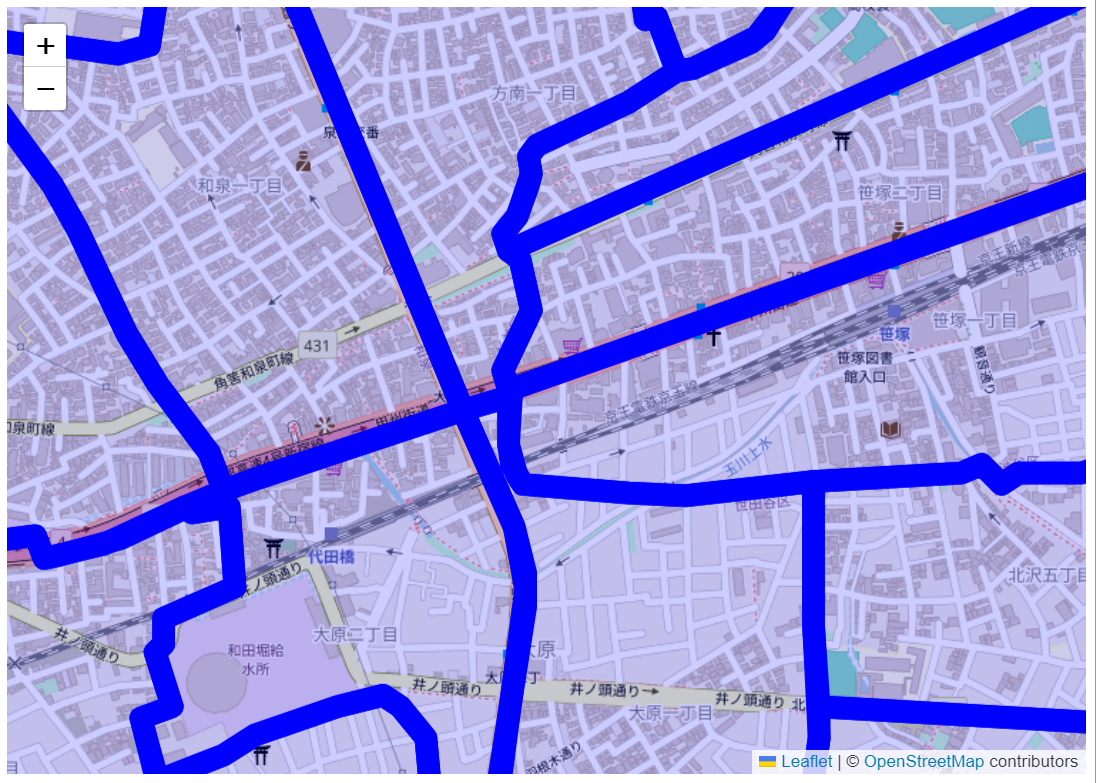
maxNativeZoomの設定で、PBFの無い拡大域でもポリゴンが表示されるようになりますが、拡大すればするほどポリゴンラインの幅が太くなり不自然になるかと思います。 ※ 画像はズームレベル16

例えば以下のようにズームレベル11のweight(ライン幅)を細く変えて多少の緩和はできますが、急に細くするのも不自然なので難しいところです。
            vectorTileLayerStyles: {
              // chomokuレイヤーのスタイル設定
              chomoku: function(properties, zoom) {
                // 地図のズームレベルが、PBFがある最大ズームレベル11
                // になったとき、線幅を細くしておく
                const weight = zoom == 11 ? 0.25 : 0.5;
                return ({
                  weight: weight,
                  color: "blue",
                  fill: true,
                  fillColor: "blue",
                });
              }
            }
Google Maps JavaScript API および deck.gl
Googleマップではdeck.MVTLayerのmaxZoomに対して最大ズームレベル11を設定します。
<!DOCTYPE html>
<html lang="ja">
  <head>
    <meta charset="UTF-8" />
    <title>Googleマップで町丁目ベクトルタイルを表示</title>
    <script src="https://unpkg.com/deck.gl@8.6.4/dist.min.js"></script>
  </head>
  <body>
    <div id="map" style="width: 100%; height: 95vh"></div>
    <script>
      (g=>{var h,a,k,p="The Google Maps JavaScript API",c="google",l="importLibrary",q="__ib__",m=document,b=window;b=b[c]||(b[c]={});var d=b.maps||(b.maps={}),r=new Set,e=new URLSearchParams,u=()=>h||(h=new Promise(async(f,n)=>{await (a=m.createElement("script"));e.set("libraries",[...r]+"");for(k in g)e.set(k.replace(/[A-Z]/g,t=>"_"+t[0].toLowerCase()),g[k]);e.set("callback",c+".maps."+q);a.src=`https://maps.${c}apis.com/maps/api/js?`+e;d[q]=f;a.onerror=()=>h=n(Error(p+" could not load."));a.nonce=m.querySelector("script[nonce]")?.nonce||"";m.head.append(a)}));d[l]?console.warn(p+" only loads once. Ignoring:",g):d[l]=(f,...n)=>r.add(f)&&u().then(()=>d[l](f,...n))})
        ({key: "YOUR_GOOGLE_MAP_KEY",
            // Add other bootstrap parameters as needed, using camel case.
            // Use the 'v' parameter to indicate the version to load (alpha, beta, weekly, etc.)
        });

      let map;

      async function initMap() {
        const { Map } = await google.maps.importLibrary("maps");

        map = new Map(document.getElementById("map"), {
          center: { lat: 35.67260863, lng: 139.66204291 },
          zoom: 11,
          maxZoom: 18,
        });

        const layer = new deck.MVTLayer({
          id: "MVTLayer",
          data: ["http://localhost:5500/tiles/{z}/{x}/{y}.pbf"],
          minZoom: 0,
          maxZoom: 11,    // PBFがある最大ズームレベルを設定
          getFillColor: [200, 90, 90, 128],
          lineWidthUnits: "pixels",   // ライン幅の単位はピクセルへ
          getLineWidth: 0.5,
          getLineColor: [140, 0, 0],
        });

        const overlay = new deck.GoogleMapsOverlay({
          layers: [layer],
        });
        overlay.setMap(map);
      }

      initMap();
    </script>
  </body>
</html>
lineWidthUnitsについては、デフォルトの"meters"ではライン幅の調整が難しく、"pixels"に変更しています
MapLibre
MapLibreではVectorTileSourceのmaxzoomに対して最大ズームレベル11を設定します。
<!DOCTYPE html>
<html lang="ja">
<head>
<title>MapLibreで町丁目ベクトルタイルを表示</title>
<script src="https://unpkg.com/maplibre-gl@3.0.0/dist/maplibre-gl.js"></script>
<link
href="https://unpkg.com/maplibre-gl@3.0.0/dist/maplibre-gl.css"
rel="stylesheet"
/>
</head>
<body>
<div id="map" style="width: 100%; height: 95vh"></div>
<script>
const map = new maplibregl.Map({
container: "map",
center: [139.66204291, 35.67260863],
zoom: 10, // 目当てのズームレベルより1減らす
maxZoom: 17, // 目当てのズームレベルより1減らす
style: {
version: 8,
sources: {
osm: {
type: "raster",
tiles: ["https://tile.openstreetmap.org/{z}/{x}/{y}.png"],
tileSize: 256,
attribution:
'© <a href="https://www.openstreetmap.org/copyright">OpenStreetMap</a> contributors',
},
},
layers: [
{
id: "osm-layer",
source: "osm",
type: "raster",
},
],
},
});
map.addControl(new maplibregl.NavigationControl());
map.on("load", function () {
map.addSource("mvt_data", {
type: "vector",
tiles: [
"http://localhost:5500/tiles/{z}/{x}/{y}.pbf",
],
minzoom: 0,
maxzoom: 11, // PBFがある最大ズームレベルを設定
});
map.addLayer({
id: "mvt_polygon",
type: "fill",
source: "mvt_data",
"source-layer": "chomoku",
layout: {},
paint: {
"fill-color": "#7fffd4",
"fill-opacity": 0.2,
},
});
map.addLayer({
id: "mvt_line",
type: "line",
source: "mvt_data",
"source-layer": "chomoku",
layout: {},
paint: {
"line-color": "#2e8b57",
"line-width": 0.5,
},
});
});
</script>
</body>
</html>
記事は以上になります。ありがとうございました。