はじめに
今回は、Leafletを使用して国土地理院ベクトルタイルの地図上に町丁目ポリゴンを表示してみました。この記事はOpenLayersを使ってOpenStreetMapに町丁目ポリゴンを表示してみる(OpenLayers v6)のLeafletおよび国土地理院ベクトルタイル版に相当します。
使用したもの
Leaflet
比較的軽量なオープンソースのJavaScript地図ライブラリです。
地理院タイル・国土地理院ベクトルタイル
今回の背景地図として使用しました。
地理院タイルとは、国土地理院が配信するタイル状の地図データです。
国土地理院は、ベクトルタイルを従来の画像タイルとともに「地理院タイル」の一種として実験的に提供しています。
ベクトルタイルとは、地理院タイル仕様に則ってタイル状に分割した、機械判読可能なタイルデータです。
町丁目ポリゴン
町丁目とは行政界の一つで「富士見町3丁目」「広尾1丁目」など「●丁目」で表わされる行政区画のことです。行政界は他には都道府県や市区町村、大字などがあります。
町丁目ポリゴンとは町丁目の境界データであり、e-stat で 小地域(町丁・字等別)という名称で公開されています。
今回使用した町丁目ポリゴンは、TerraMap API からレスポンスされたものです。
ソース構成
最終的なソース構成は以下になります。
.
├── index.html
├── index.js
└── PolygonSample.geojson
地図の表示
まずは地図だけを表示させてみました。
HTMLでは、Leafletのクイックスタートガイド を参考に leaflet.css と leaflet.js を読み込ませました。さらにベクトルタイルを扱うために Leaflet.VectorGrid.bundled.js も読み込ませました。
<!DOCTYPE html>
<html>
  <head>
    <title>Leafletで国土地理院ベクトルタイルを表示</title>
    <link
      rel="stylesheet"
      href="https://unpkg.com/leaflet@1.9.3/dist/leaflet.css"
      integrity="sha256-kLaT2GOSpHechhsozzB+flnD+zUyjE2LlfWPgU04xyI="
      crossorigin=""
    />
    <script
      src="https://unpkg.com/leaflet@1.9.3/dist/leaflet.js"
      integrity="sha256-WBkoXOwTeyKclOHuWtc+i2uENFpDZ9YPdf5Hf+D7ewM="
      crossorigin=""
    ></script>
    <script src="https://unpkg.com/leaflet.vectorgrid@latest/dist/Leaflet.VectorGrid.bundled.js"></script>
  </head>
  <body>
    <div id="map" style="width: 100%; height: 600px"></div>
    <script src="./index.js"></script>
  </body>
</html>
ベクトルタイルを使用するメリットは、地図スタイルを自由に編集できる点ですが、Leafletで実現するにはまだ分からないことが多くありました。今回 index.js では、「白地図」の地理院タイル上に「道路」「線路」「河川、湖」のベクトルタイルをシンプルに描くように書きました。
const map = L.map("map").setView([35.6727, 139.662], 14);

L.tileLayer("https://cyberjapandata.gsi.go.jp/xyz/blank/{z}/{x}/{y}.png", {
  attribution:
    "<a href='https://maps.gsi.go.jp/development/ichiran.html' target='_blank'>地理院タイル</a>",
}).addTo(map);

L.vectorGrid
  .protobuf(
    "https://cyberjapandata.gsi.go.jp/xyz/experimental_bvmap/{z}/{x}/{y}.pbf",
    {
      attribution:
        "<a href='https://github.com/gsi-cyberjapan/gsimaps-vector-experiment' target='_blank'>国土地理院ベクトルタイル提供実験</a>",
      rendererFactory: L.canvas.tile,
      // 各レイヤーのスタイル設定
      vectorTileLayerStyles: {
        road: {
          color: "gray",
          weight: 1,
        },
        railway: {
          color: "green",
          weight: 2,
        },
        river: {
          color: "dodgerblue",
          weight: 1,
        },
        lake: {
          color: "dodgerblue",
          weight: 1,
        },
        // 表示しないレイヤー
        boundary: [],
        building: [],
        coastline: [],
        contour: [],
        elevation: [],
        label: [],
        landforma: [],
        landforml: [],
        landformp: [],
        searoute: [],
        structurea: [],
        structurel: [],
        symbol: [],
        transp: [],
        waterarea: [],
        wstructurea: [],
      },
    }
  )
  .addTo(map);
ブラウザで表示すると以下のようになります。
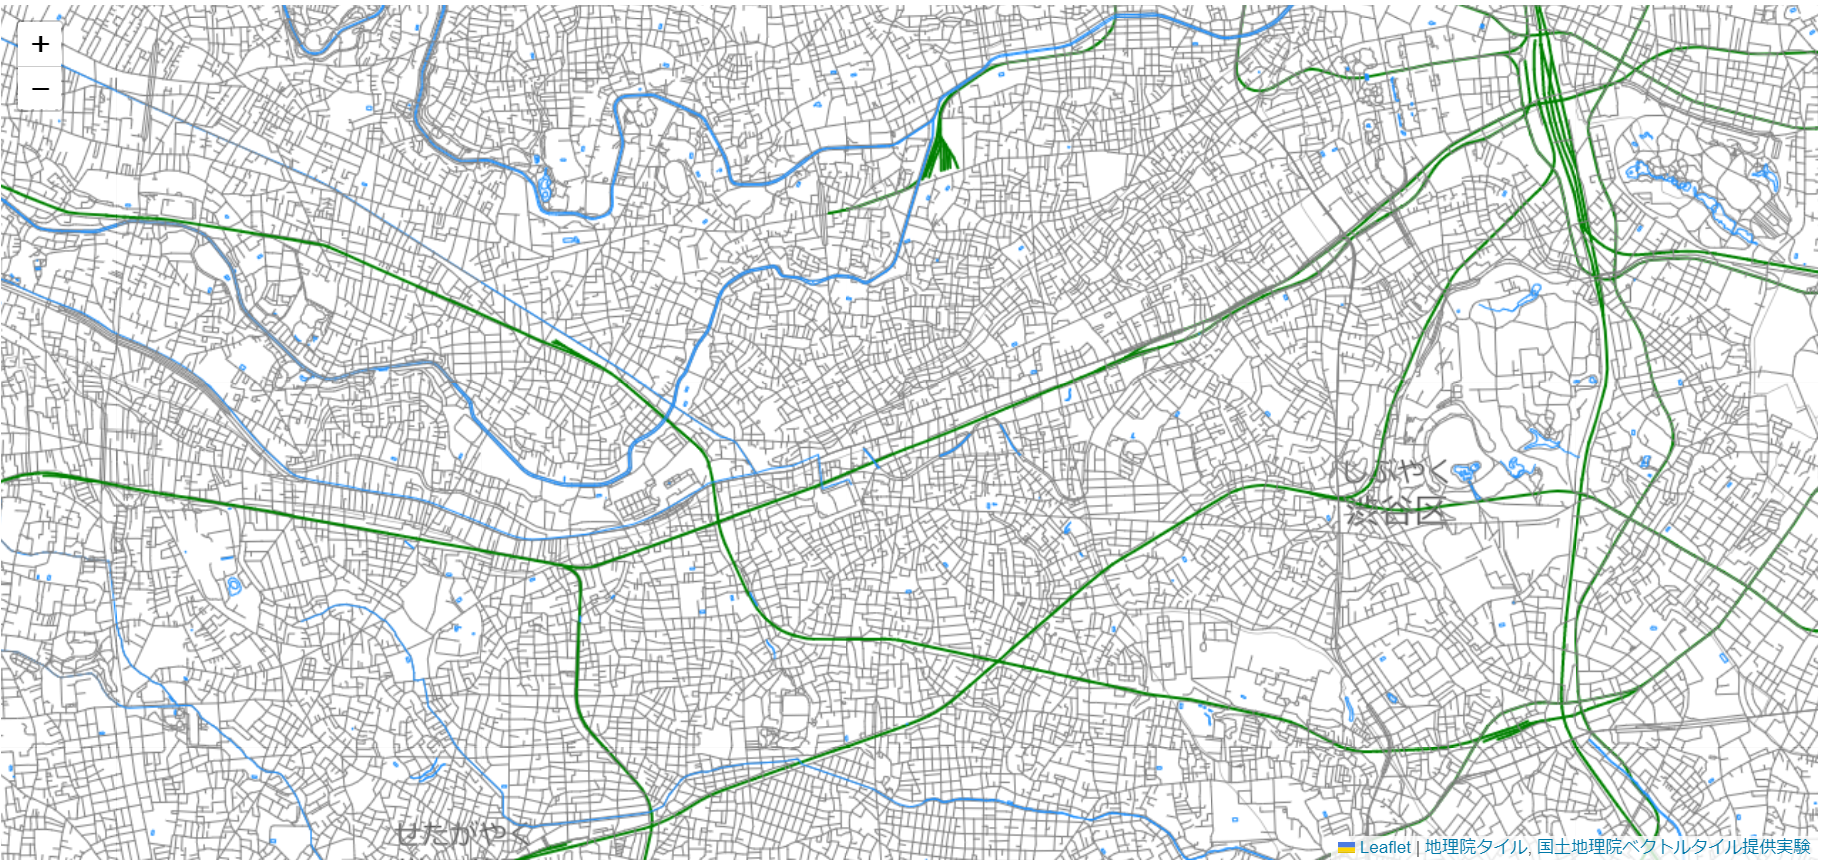
国土地理院ベクトルタイルのみで洗練された地図を表示させたい場合は、地理院地図Vector(仮称) から出力する地図デザインと Mapbox GL Js を利用する方法が考えられます。
Mapbox GL JS(ベクトルタイルを表示するサンプル)
町丁目ポリゴンの表示
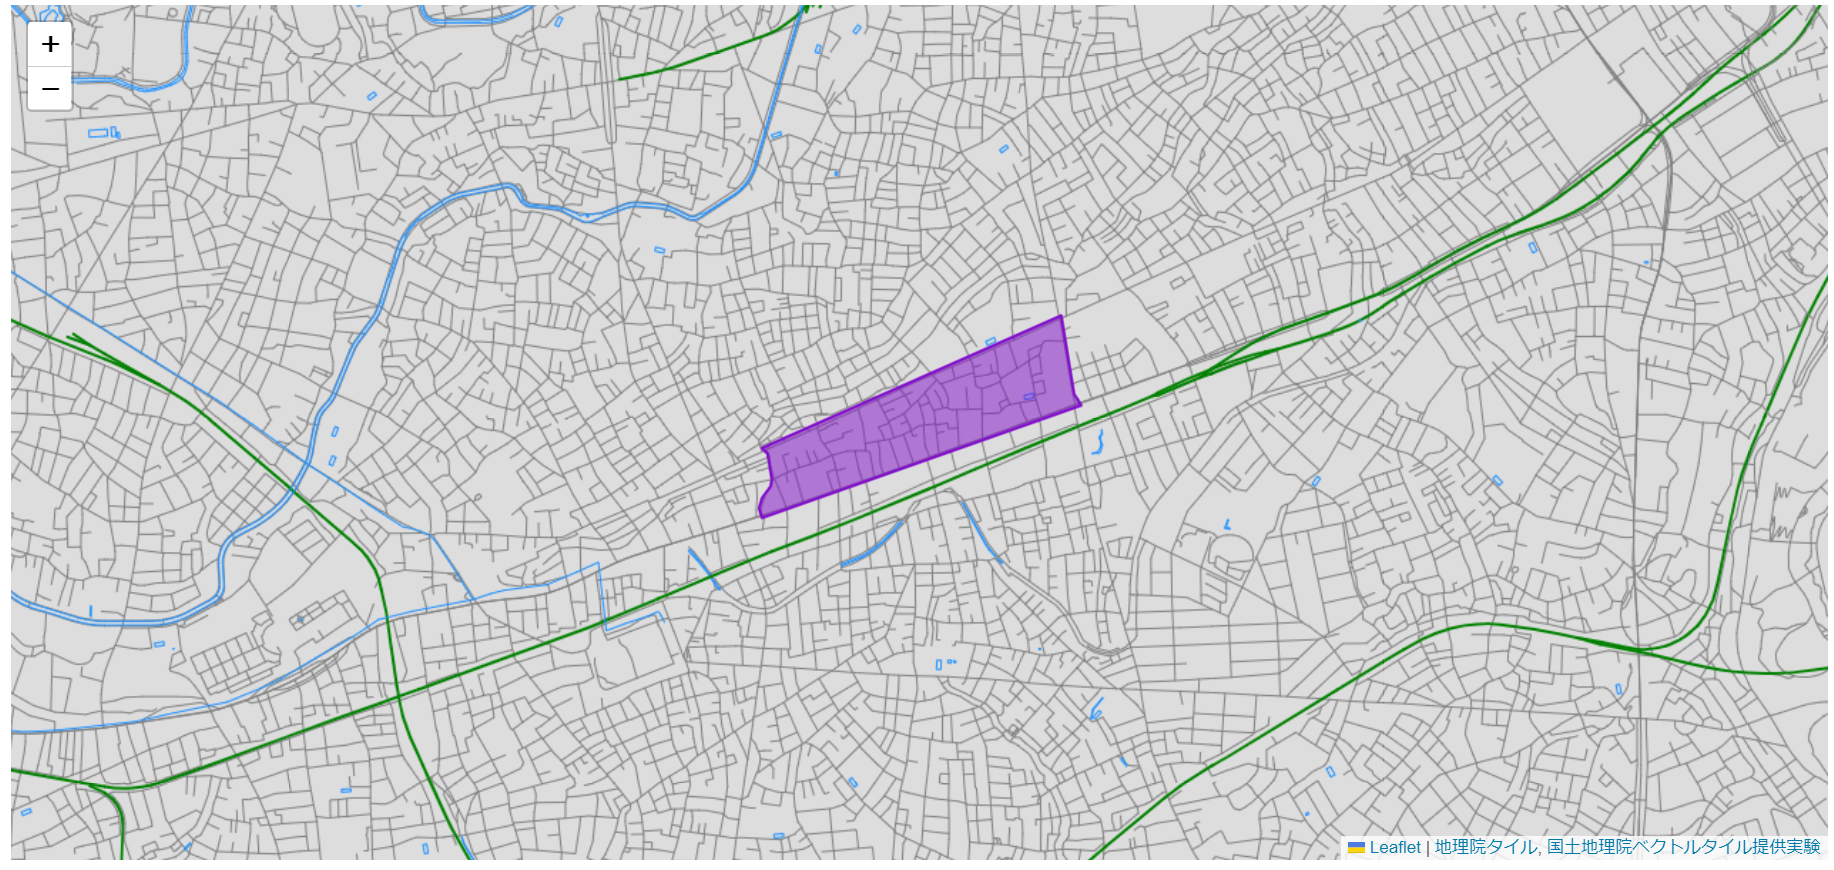
次に地図上に町丁目ポリゴンを表示させてみました。
LeafletにはGeoJSONオブジェクトがあるので、表示する町丁目ポリゴンもGeoJSON形式で用意します。
町丁目ポリゴンサンプル(PolygonSample.geojson)
{
  "type": "FeatureCollection",
  "features": [
    {
      "type": "Feature",
      "properties": {},
      "geometry": {
        "type": "MultiPolygon",
        "coordinates": [
          [
            [
              [139.671072468309, 35.6754722538532],
              [139.671087007596, 35.6754550551174],
              [139.668725237444, 35.6747911158284],
              [139.66554532739, 35.6738722390156],
              [139.661458826632, 35.6726940785978],
              [139.661419450899, 35.6728515474483],
              [139.661380744908, 35.6729374755436],
              [139.661480105109, 35.6731778572129],
              [139.66170271628, 35.6734877305997],
              [139.661785304978, 35.6736513662652],
              [139.661614923065, 35.6742875722041],
              [139.661496199963, 35.6743809219931],
              [139.661459656333, 35.674408792621],
              [139.662425327479, 35.674739902115],
              [139.666544090416, 35.6762483359339],
              [139.667841199021, 35.6766982910352],
              [139.670456339457, 35.6776512122706],
              [139.670879431702, 35.6757305691137],
              [139.670937715062, 35.6756316424419],
              [139.671072468309, 35.6754722538532]
            ]
          ]
        ]
      }
    }
  ]
}
index.js には以下のコードを追記しました。
// ポリゴンのスタイル設定
const polygonStyleOptions = {
  color: "#810FCB",
  opacity: 1.0,
  weight: 2.0,
  fillColor: "#810FCB",
  fillOpacity: 0.5,
};

// GeoJSONファイルの表示
fetch("PolygonSample.geojson")
  .then((response) => response.json())
  .then((data) => {
    L.geoJSON(data, polygonStyleOptions).addTo(map);
  });
ブラウザで表示すると以下のようになります。
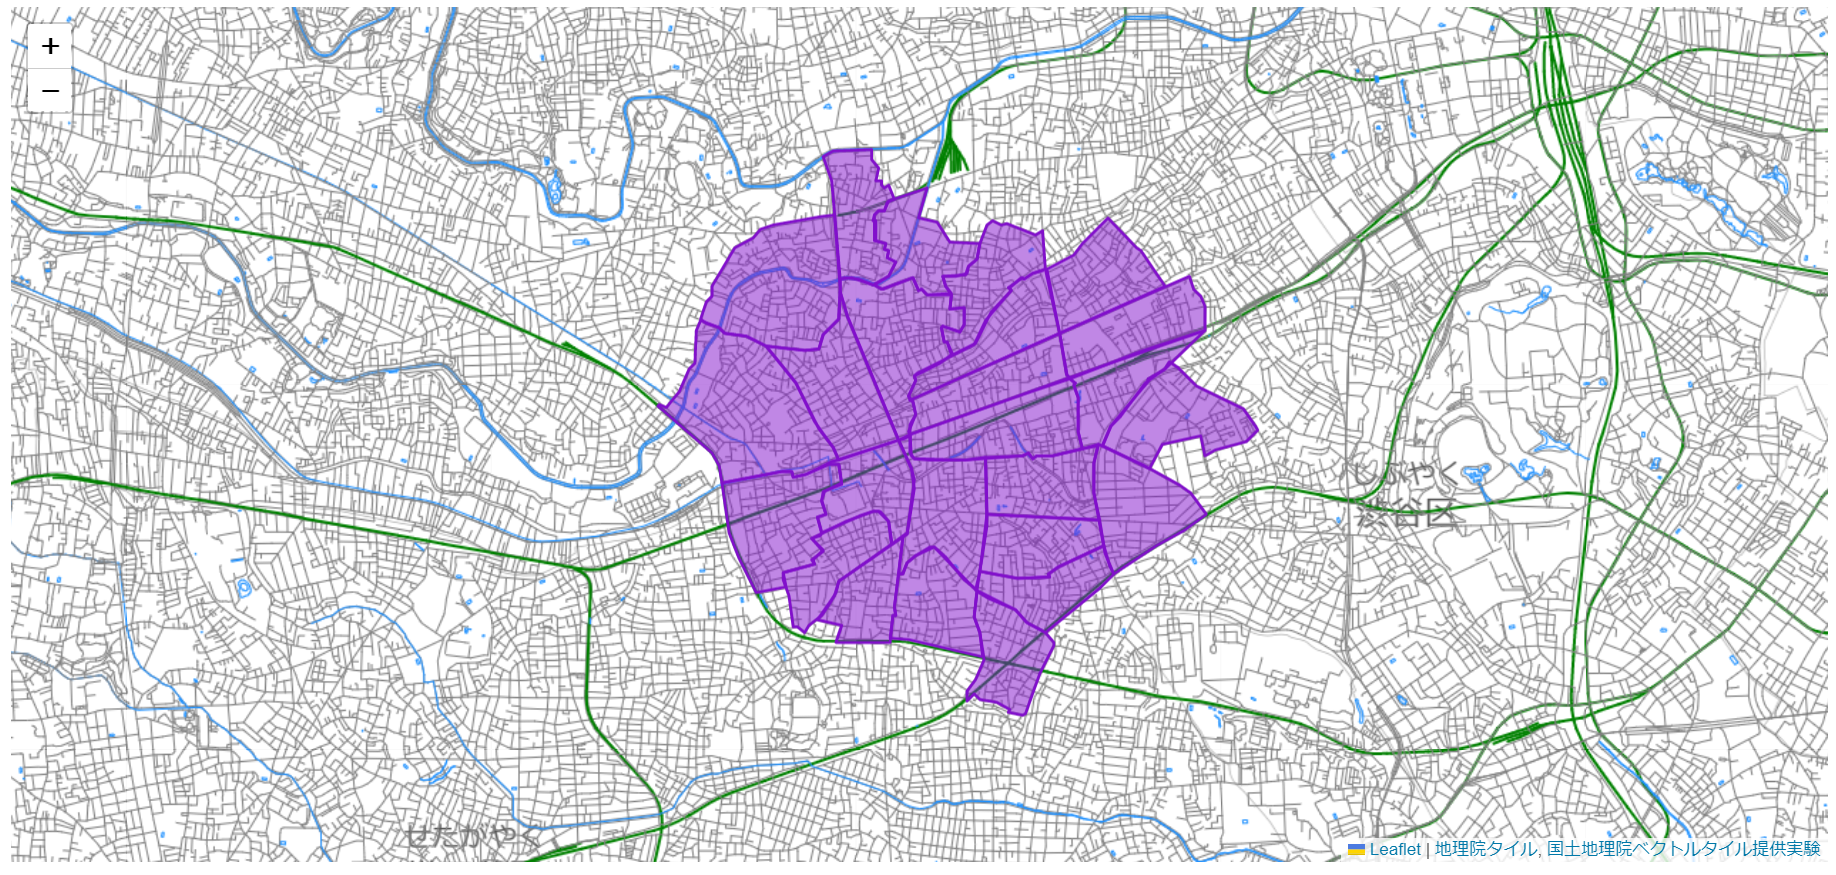
TerraMap APIから町丁目ポリゴンを取得して表示する
TerraMap API は、条件に一致した町丁目ポリゴンをGeoJSONとしてレスポンスすることができます。今回 TerraMap API へのリクエストについて詳細は記載しませんが、例えば「指定地点から半径1kmに含まれるすべての町丁目ポリゴンを取得」することも可能で、以下のような変更で実現することができます。
// fetchにはTerraMap APIにリクエストを送るサーバーサイドプログラムのURLを指定します
// URLはダミーです。
fetch("https://your_domain.example.jp/path/to/terramap_api_request_program")
  .then((response) => response.json())
  .then((data) => {
    L.geoJSON(data, polygonStyleOptions).addTo(map);
  });
表示結果
その他の参考情報
地理院地図|地理院タイル一覧
地理院地図Vector(仮称)提供実験
ベクトルタイルをいじってみる
Using GeoJSON with Leaflet
LeafletでGeoJSONを読み込みカスタムアイコンを表示する
フェッチ API の使用