OpenLayersを使ってOpenStreetMapに町丁目ポリゴンを表示してみる(OpenLayers v6)
OpenLayersを使ってOpenStreetMapに町丁目ポリゴンを書いてみます。
使用するもの
OpenLayers
Webサイトで地図を扱うときに便利なJavaScriptのライブラリです。動的な地図を使ったWebページの作成が楽にできるようになります。
2022年8月にOpenLayers v7がリリースされましたが、OpenLayers v6を使用した例をあげます。
OpenLayers
OpenStreetMap(OSM)
OpenStreetMap(OSM)は、誰でも自由に地図を使えるよう、みんなでオープンデータの地理情報を作るプロジェクトです。
(OpenStreetMap Japanより引用)
町丁目ポリゴン
町丁目とは行政界の一つで「富士見町3丁目」「広尾1丁目」など「●丁目」で表わされる行政区画のことです。行政界は他には都道府県や市区町村、大字などがあります。
町丁目ポリゴンは町丁目の境界データです。
町丁目ポリゴンはe-statからダウンロードすることもできます。e-statでは小地域(町丁・字等別)という名称で公開されています。
e-statの小地域(町丁・字等別)のポリゴンを地図に描画することもできますが、e-statからダウンロードしたりShapefileやKMLのファイルをシステムに取り込んだりするのが手間なので、マップマーケティングのTerraMap APIを使って取得した町丁目ポリゴンを表示させてみます。
OpenLayers v6 アプリケーションをセットアップ
OpenLayersの公式ページのチュートリアルにある方法をベースに、OpenStreetMapに町丁目ポリゴンを描画してみます。
OpenLayers v6 チュートリアル
npx create-ol-app your-app-name
セットアップ内容の確認
指定した名前のアプリケーションが作成されます。
index.htmlやmain.jsなどのファイルが生成されています。
以下ではmain.jsを変更していきます。
アプリケーションを実行して地図を表示する
こちらもチュートリアルにあるように npm start します。コマンドプロントやVSCodeのターミナルなどから実行します。
表示されたlocalhostのURLにアクセスすると、地図が表示されると思います。
npm start
ポリゴンを地図に表示する
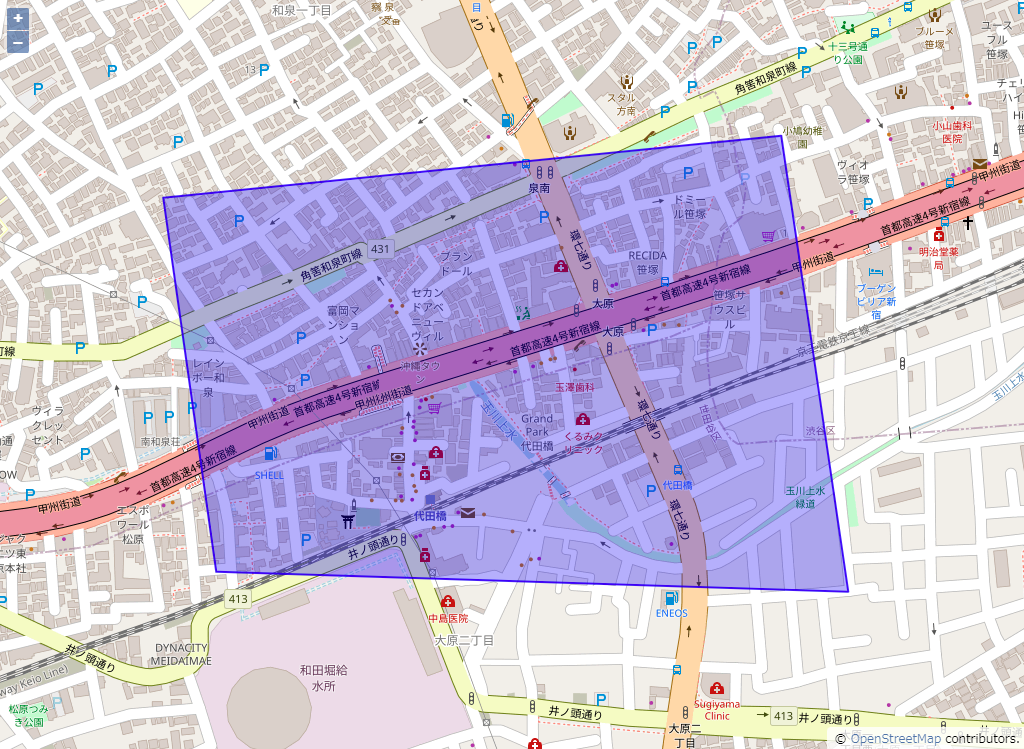
地図ロード時にポリゴンを表示させてみます。
今回はPolygonではなくMultiPolygonで指定してみます。
必要なモジュールをインポートし、VectorSourceにGeoJSONを指定してVectorLayerをセットします。
import './style.css';
import {Map, View} from 'ol';
import TileLayer from 'ol/layer/Tile';
import OSM from 'ol/source/OSM';
import {fromLonLat} from 'ol/proj';
import VectorLayer from 'ol/layer/Vector';
import VectorSource from 'ol/source/Vector';
import GeoJSON from 'ol/format/GeoJSON';
import Style from 'ol/style/Style';
import Stroke from 'ol/style/Stroke';
import Fill from 'ol/style/Fill';

// ポリゴンのスタイルを設定
const styles = {
  'MultiPolygon': new Style({
      stroke: new Stroke({
          color: 'rgba(0, 0, 255, 0.8)',
          width: 2
      }),
      fill: new Fill({
          color: 'rgba(0, 0, 255, 0.3)'
      })
  })
};
const styleFunction = function(feature) {
  return styles[feature.getGeometry().getType()];
};

// GeoJSONでポリゴンを準備
const geojsonObject = {
    "type": "FeatureCollection",
    "features": [
        {
            "type": "Feature",
            "properties": {},
            "geometry": {
                "type": "MultiPolygon",
                "coordinates": [
                    [
                      [
                          [139.65645236269657, 35.6703299404073],
                          [139.65588373440954, 35.67358963979696],
                          [139.66251415481307, 35.67413000490703],
                          [139.6632329867986, 35.67015562118215],
                          [139.65645236269657, 35.6703299404073]
                      ]
                    ]
                ]
            }
        }
    ]
};

// vectorSourceにGeoJSONをセット
const vectorSource = new VectorSource({
  features: new GeoJSON({featureProjection: 'EPSG:3857'}).readFeatures(geojsonObject)
});

const vectorLayer = new VectorLayer({
  source: vectorSource,
  style: styleFunction
});

const map = new Map({
  target: 'map',
  layers: [
    new TileLayer({
      source: new OSM()
    }),
    vectorLayer
  ],
  view: new View({
    center: fromLonLat([139.6596281, 35.6720557]),
    zoom: 15
  })
});
町丁目ポリゴンを地図に表示する
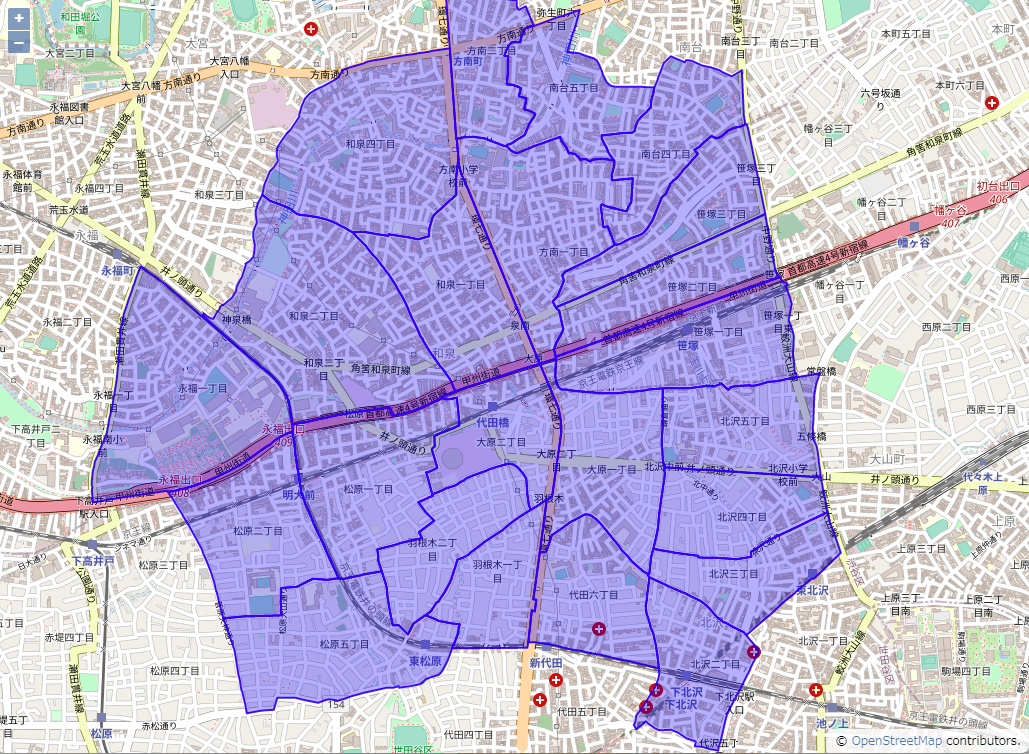
TerraMap APIから町丁目ポリゴンを取得して表示する
上のサンプルコードでGeoJSONを指定した部分を変更します。
vectorSourceにTerraMap APIにリクエストを送るサーバーサイドプログラムのURLを指定し、ポリゴンを表示させます。
GeoJSONでレスポンスされるため、そのままvectorSourceにセットすることができます。
コード例ではTerraMap APIへのリクエストについて詳細は記載していませんが、指定地点から半径1kmに含まれる町丁目のポリゴンを取得しています。
import './style.css';
import {Map, View} from 'ol';
import TileLayer from 'ol/layer/Tile';
import OSM from 'ol/source/OSM';
import {fromLonLat} from 'ol/proj';
import VectorLayer from 'ol/layer/Vector';
import VectorSource from 'ol/source/Vector';
import GeoJSON from 'ol/format/GeoJSON';
import Style from 'ol/style/Style';
import Stroke from 'ol/style/Stroke';
import Fill from 'ol/style/Fill';

// ポリゴンのスタイルを設定
const styles = {
  'MultiPolygon': new Style({
      stroke: new Stroke({
          color: 'rgba(0, 0, 255, 0.8)',
          width: 2
      }),
      fill: new Fill({
          color: 'rgba(0, 0, 255, 0.3)'
      })
  })
};
const styleFunction = function(feature) {
  return styles[feature.getGeometry().getType()];
};

// vectorSourceにTerraMap APIにリクエストを送るサーバーサイドプログラムのURLを指定します。
// URLはダミーです。
const vectorSource = new VectorSource({
  url: 'https://your_domain.example.jp/path/to/terramap_api_request_program',
  format: new GeoJSON()
});

const vectorLayer = new VectorLayer({
  source: vectorSource,
  style: styleFunction
});

const map = new Map({
  target: 'map',
  layers: [
    new TileLayer({
      source: new OSM()
    }),
    vectorLayer
  ],
  view: new View({
    center: fromLonLat([139.6596281, 35.6720557]),
    zoom: 15
  })
});

