背景
そろそろ卒論/修論/博論の季節ですね。
自分の頑張りの可視化をするために、gitで管理しているtexファイルのコミットログをpandasで可視化してみます。
gistにnotebookを置いたので詳しくはそちらを。
ざっくりしたやり方
gitのログの出力
git log --numstat --pretty="%ad" --date=iso *.tex > thesis_log.txt
こんな感じのが出てきます。
2016-01-08 14:16:21 +0900

61      141     masterthesis/method.tex
18      1       masterthesis/thank.tex
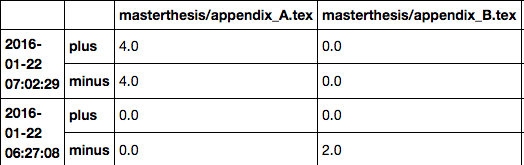
DataFrameにする
頑張ってこんな感じにします。
集計する
# 日ごとにリサンプリング
per_day = table.unstack().resample("d").sum().stack()
# 日毎の合計
tot = per_day.sum(axis=1).unstack()
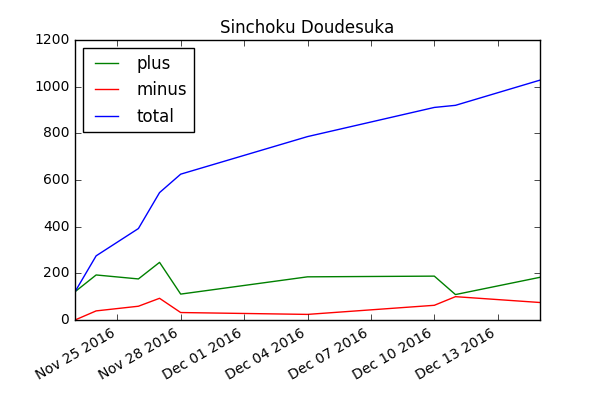
# 累計(すなわり、頑張り)
tot["total"] = tot["plus"].cumsum() - tot["minus"].cumsum()
これで頑張りの時系列データが出来ました
オマケ
コミケの原稿の進捗(本当はこれをプロットしたかった)