前提
Harmoware-VISについては別記事
「Harmoware-VISの紹介」
「Harmoware-VIS はじめに」
「Harmoware-VIS APIリファレンス」
をご覧ください。
Layersリファレンス
Harmoware-VISのLayersのリファレンスを解説します。
## Base Layer properties.
以降で解説するHarmoware-VISの[`MovesLayer`](https://qiita.com/ucl_Harmoware_VIS/items/cc65d90488d2f0d66ae1#moveslayer)と[`DepotsLayer`](https://qiita.com/ucl_Harmoware_VIS/items/cc65d90488d2f0d66ae1#depotslayer)と[`LineMapLayer`](https://qiita.com/ucl_Harmoware_VIS/items/cc65d90488d2f0d66ae1#linemaplayer)はdeck.glのLayer Classを継承しています。
deck.glのLayer Classの詳細は
リンク先を参照
## MovesLayer
MovesLayer は車両などの移動体をアイコンとしてレンダリングします。
MovesLayer は`HarmoVisLayers`のためのレイヤーです。
`HarmoVisLayers`の詳細は
リンク先を参照
Examples.js
<HarmoVisLayers ...
  layers={[
    new MovesLayer( { routePaths: this.props.routePaths,
      movesbase: this.props.movesbase,
      movedData: this.props.movedData,
      clickedObject: this.props.clickedObject,
      actions: this.props.actions
    })
  ]}
/>
- clickedObject(Array,required)
- Base Layer propertiesの
pickableをfalseに設定した場合は省略可
アイコンクリック時の経路描画に必要
通常はHarmoware-VISのPropertiesのclickedObjectを設定
設定内容はHarmoware-VISで編集
- routePaths(Array,required)
- Base Layer propertiesの
pickableをfalseに設定した場合は省略可
アイコンクリック時の経路描画に必要
通常はHarmoware-VISのPropertiesのroutePathsを設定
設定内容はHarmoware-VISで編集
- actions(object,required)
- Base Layer propertiesの
pickableをfalseに設定した場合は省略可
アイコンクリック時の経路描画に必要
通常はHarmoware-VISのPropertiesのactionsを設定
- movesbase(Array,required)
- Base Layer propertiesの
pickableをfalseに設定した場合は省略可
アイコンクリック時の経路描画に必要
通常はHarmoware-VISのPropertiesのmovesbaseを設定
- movedData(Array,required)
- 移動体アイコン表示用のデータ(必須)
通常はHarmoware-VISのPropertiesのmovedDataを設定
- visible(Boolean,option)
- ・Default : true
falseでMovesLayerを非表示
- iconChange(Boolean,option)※非推奨
- ・Default : true
false : deck,glのScatterplotLayerを使用
true : deck,glのSimpleMeshLayer / ScenegraphLayerを使用
(SimpleMeshLayer / ScenegraphLayerの選択はiconCubeType)
※ 但しiconlayerの表示レイヤー設定値があればそちらを優先
※ 更にiconDesignationsの表示レイヤー定義があればそちらを優先
- iconCubeType(Number,option)※非推奨
- ・Default : 0
iconChangeがtrueの場合に有効
0 : deck,glのSimpleMeshLayerを使用
1 : deck,glのScenegraphLayerを使用
※ 但しiconlayerの表示レイヤー設定値があればそちらを優先
※ 但しiconDesignationsの表示レイヤー定義があればそちらを優先
- iconlayer(String,option)
- ・Default : undefined
アイコン表示に使用するレイヤを次の3つより選択して設定します。
"Scatterplot" : deck,glのScatterplotLayerを使用
"SimpleMesh" : deck,glのSimpleMeshLayerを使用
"Scenegraph" : deck,glのScenegraphLayerを使用
※ 但しiconDesignationsの表示レイヤー定義があればそちらを優先
Harmoware-VISで提供するレイヤーの組込アイコン
| ScatterplotLayer |
SimpleMeshLayer |
ScenegraphLayer |
 |
 |
 |
- iconDesignations(Array,option)
- ・Default : undefined
movedDataのtype別のアイコン表示設定
詳細は後述
iconDesignations_interface.ts
interface IconDesignation {
  type: string,
  layer: string,
  radiusScale?: number,
  getColor?: Function,
  getOrientation?: Function,
  getScale?: Function,
  getTranslation?: Function,
  getRadius?: Function,
  sizeScale?: number,
  mesh?: any,
  scenegraph?: any,
};
- type(string,required)
- 対応するmovedDataのtypeを指定
- layer(string,required)
- 設定値はMovesLayerのiconlayerと同じ(省略は不可)
- radiusScale(number,option)
- 設定値はMovesLayerのlayerRadiusScaleと同じ
省略時はMovesLayerのlayerRadiusScaleが優先
- getColor(Function,option)
- ・Default :
(x)=>x.color || "green"
移動体アイコンの色をコントロールする設定
- getOrientation(Function,option)
- 設定値はMovesLayerのgetOrientationと同じ
省略時はMovesLayerのgetOrientationが優先
- getScale(Function,option)
- 設定値はMovesLayerのgetScaleと同じ
省略時はMovesLayerのgetScaleが優先
- getTranslation(Function,option)
- 設定値はMovesLayerのgetTranslationと同じ
省略時はMovesLayerのgetTranslationが優先
- getRadius(Function,option)
- 設定値はMovesLayerのgetRadiusと同じ
省略時はMovesLayerのgetRadiusが優先
- sizeScale(number,option)
- 設定値はMovesLayerのsizeScaleと同じ
省略時はMovesLayerのsizeScaleが優先
- mesh(any,option)
- 設定値はMovesLayerのmeshと同じ
省略時はMovesLayerのmeshが優先
- scenegraph(any,option)
- 設定値はMovesLayerのscenegraphと同じ
省略時はMovesLayerのscenegraphが優先
|
- layerRadiusScale(Number,option)
- ・Default : 1
ScatterplotLayerのアイコンの半径スケール値
- layerOpacity(Number,option)
- ・Default : 0.75
アイコンの不透明度値
- getRadius(Function,option)
- ・Default :
x => x.radius || 20
ScatterplotLayerのアイコンの半径指定アクセサ(メートル)
- getRouteColor(Function,option)
- ・Default :
x => x.routeColor || x.color || GREEN
経路線描画データ(routePaths)生成時に使用するmovedDataの経路線色指定アクセサ
- getRouteWidth(Function,option)
- ・Default :
x => x.routeWidth|| 10
経路線描画データ(routePaths)生成時に使用するmovedDataの経路線幅指定アクセサ(メートル)
- optionVisible(Boolean,option)
- ・Default : true
falseでオプションデータ(3Ⅾグラフ)を非表示
trueでもオプション表示するためのデータが無い場合は非表示
visibleがtrueの場合に有効
- optionArcVisible(Boolean,option)
- ・Default : false
trueの場合移動体通過中の前後の2地点を繋ぐ弧を描画
undefinedの場合はoptionVisibleの設定を採用
- optionLineVisible(Boolean,option)
- ・Default : false
trueの場合移動体通過中の前後の2地点を繋ぐ直線を描画
undefinedの場合はoptionVisibleの設定を採用
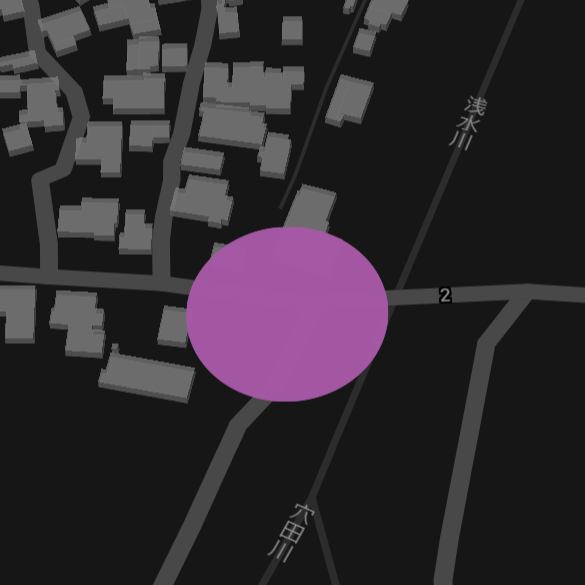
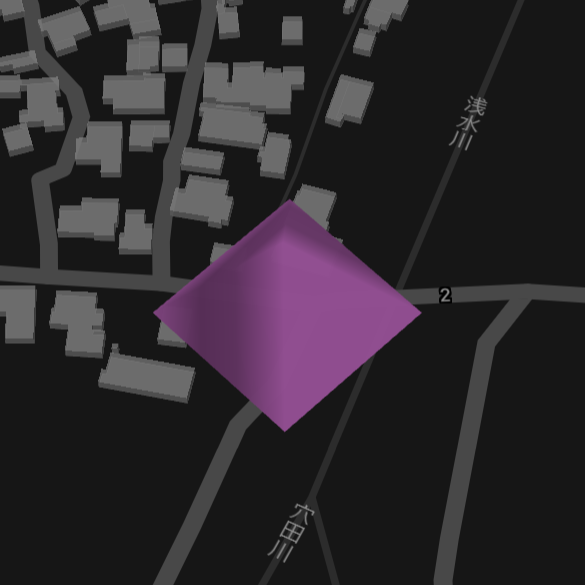
- optionChange(Boolean,option)
- ・Default : false
オプションデータ(3Ⅾグラフ)の表示パターンを指定
false:パターン1(平面配置)
true:パターン2(垂直配置)
| パターン1 |
パターン2 |
 |
 |
- optionOpacity(Number,option)
- ・Default : 0.25
オプションデータ(3Ⅾグラフ)不透明度値
- optionCellSize(Number,option)
- ・Default : 12
オプションデータ(3Ⅾグラフ)セルサイズ(メートル)
- optionElevationScale(Number,option)
- ・Default : 1
オプションデータ(3Ⅾグラフ)高さのスケール値
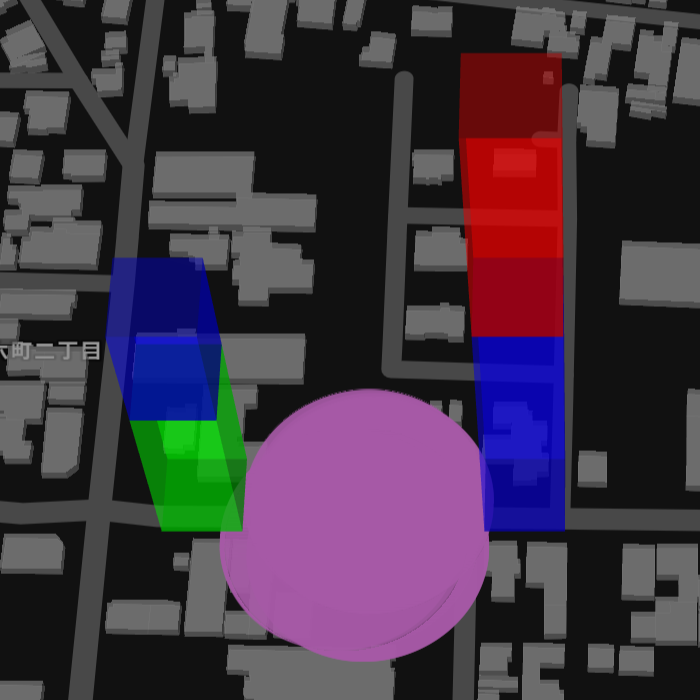
- optionDisplayPosition(Number,option)
- ・Default : 30
アイコンレイヤーをSimpleMeshLayer又はScenegraphLayerを指定時で
オプションデータ(3Ⅾグラフ)をパターン1で表示する場合の
4本のグラフのアイコンの中心位置から距離(メートル)
| 表示イメージ |
|---|
 |
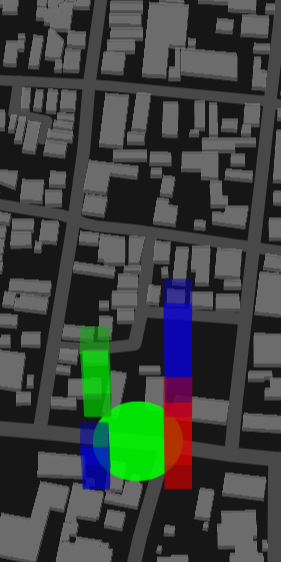
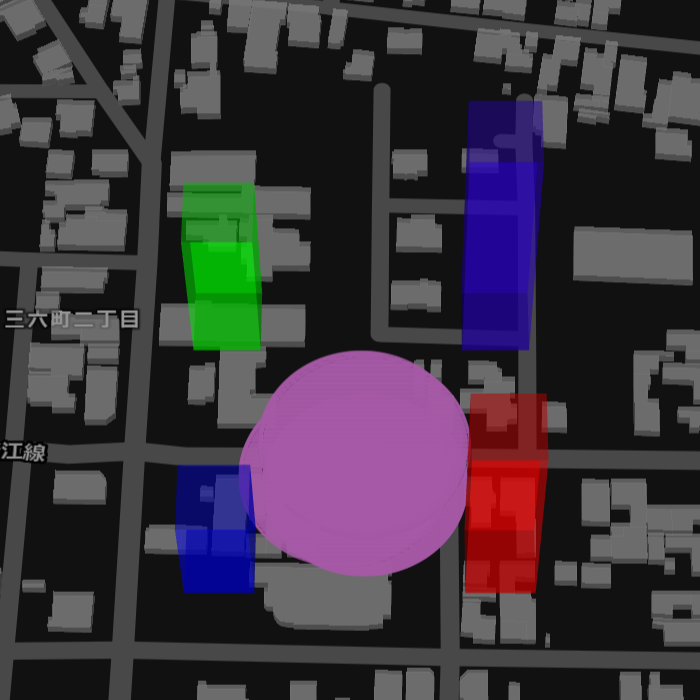
- optionCentering(Boolean,option)
- ・Default : false
trueでオプションデータ(3Ⅾグラフ)パターン1で表示時に4本のグラフをアイコンの中心に位置付ける
| 表示イメージ |
|---|
 |
- getCubeColor(Function,option)
- ・Default :
x => x.optColor || [x.color] || [GREEN]
オプションデータ(3Ⅾグラフ)配色情報アクセサ
戻り値のフォーマット:[ グラフ1の色指定(RGB[A]) , [ グラフ2の色指定 ] , [ グラフ3の色指定 ] , [ グラフ4の色指定 ] ]
- getCubeElevation(Function,option)
- ・Default :
x => x.optElevation || [0]
オプションデータ(3Ⅾグラフ)高さ情報アクセサ(メートル)
戻り値のフォーマット:[ グラフ1の高さ指定 , [ グラフ2の高さ指定 ] , [ グラフ3の高さ指定 ] , [ グラフ4の高さ指定 ] ]
- getArchWidth(Function,option)
- ・Default :
x => x.archWidth|| 1
optionArcVisibleがtrueの場合に描画する弧の線幅情報アクセサ(メートル)
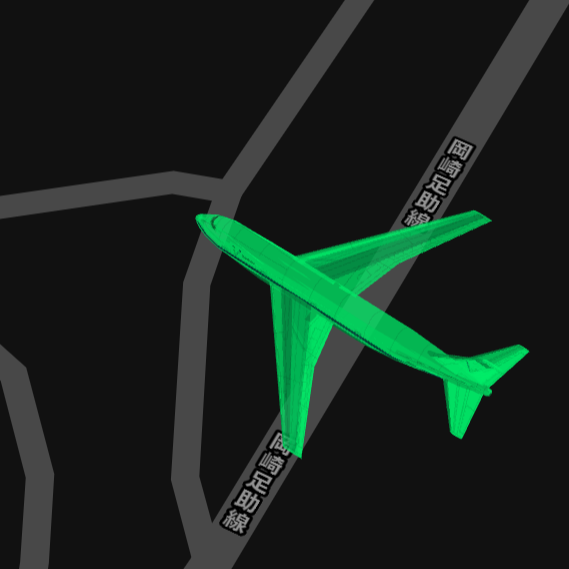
- mesh(any)
- ・Default :※下記参照
移動体アイコンを使用するレイヤーがSimpleMeshLayerの場合に表示するアイコンのデータ
使用できるアイコンのデータの詳細はSimpleMeshLayerのリファレンスを参照
参照:【Harmoware-VIS】OBJフォーマットのデータをアイコンに設定
| Defaultアイコン |
|---|
|
- scenegraph(any)
- ・Default :※下記参照
移動体アイコンを使用するレイヤーがScenegraphLayerの場合に表示するアイコンのデータ
使用できるアイコンのデータの詳細はScenegraphLayerのリファレンスを参照
| Defaultアイコン |
|---|
|
- sizeScale(Number,option)
- ・Default : 20
移動体アイコンを使用するレイヤーがSimpleMeshLayer又はScenegraphLayerの場合のアイコンのスケール値
- getOrientation(Function,option)
- ・Default :
x => x.direction ? [0,(x.direction * -1),90] : [0,0,90]
移動体アイコンを使用するレイヤーがSimpleMeshLayer又はScenegraphLayerの場合のアイコンの回転情報アクセサ
戻り値のフォーマット:[pitch, yaw, roll]
- getScale(Function,option)
- ・Default :
x => x.scale || [1,1,1]
移動体アイコンを使用するレイヤーがSimpleMeshLayer又はScenegraphLayerの場合のアイコンの各軸に沿ったスケール値
戻り値のフォーマット:[x, y, z]
- getTranslation(Function,option)
- ・Default :
[0,0,0]
移動体アイコンを使用するレイヤーがSimpleMeshLayer又はScenegraphLayerの場合のアイコンの中心位置からのオフセット値(メートル)
戻り値のフォーマット:[x, y, z]
## DepotsLayer
DepotsLayer は駅やバス停などの移動しない位置固定オブジェクトをアイコンとしてレンダリングします。
DepotsLayer は`HarmoVisLayers`のためのレイヤーです。
`HarmoVisLayers`の詳細は
リンク先を参照
Examples.js
<HarmoVisLayers ...
  layers={[
    new DepotsLayer( { depotsData: this.props.depotsData } )
  ]}
/>
- depotsData(Array,required)
- 非移動体アイコン表示用のデータ(必須)
通常はHarmoware-VISのPropertiesのdepotsDataを設定
- iconChange(Boolean,option)※非推奨
- ・Default : true
false : deck,glのScatterplotLayerを使用
true : deck,glのSimpleMeshLayerを使用
※ 但しiconlayerの表示レイヤー設定値があればそちらを優先
※ 更にiconDesignationsの表示レイヤー定義があればそちらを優先
- iconlayer(String,option)
- ・Default : undefined
アイコン表示に使用するレイヤを次の2つより選択して設定します。
"Scatterplot" : deck,glのScatterplotLayerを使用
"SimpleMesh" : deck,glのSimpleMeshLayerを使用
※ 但しiconDesignationsの表示レイヤー定義があればそちらを優先
Harmoware-VISで提供するレイヤーの組込アイコン
| ScatterplotLayer |
SimpleMeshLayer |
 |
 |
- iconDesignations(Array,option)
- ・Default : undefined
depotsDataのtype別のアイコン表示設定
詳細はMovesLayerのiconDesignationsの解説を参照
- layerRadiusScale(Number,option)
- ・Default : 1
ScatterplotLayerのアイコンの半径スケール値
- layerOpacity(Number,option)
- ・Default : 0.5
アイコンの不透明度値
- getColor(Function,option)
- ・Default :
(x)=>x.color || "DARKMAGENTA"
非移動体アイコンの色をコントロールする設定
- getRadius(Function,option)
- ・Default :
x => x.radius || 30
ScatterplotLayerのアイコンの半径指定アクセサ(メートル)
- optionVisible(Boolean,option)
- ・Default : true
falseでオプションデータ(3Ⅾグラフ)を非表示
trueでもオプション表示するためのデータが無い場合は非表示
参照:【Harmoware-VIS】オプションのグラフ表示(停留所)
- optionChange(Boolean,option)
- ・Default : false
オプションデータ(3Ⅾグラフ)の表示パターンを指定
false:パターン1(平面配置)
true:パターン2(垂直配置)
参照:【Harmoware-VIS】オプションのグラフ表示(停留所)
| パターン1 |
パターン2 |
 |
 |
- optionOpacity(Number,option)
- ・Default : 0.25
オプションデータ(3Ⅾグラフ)不透明度値
参照:【Harmoware-VIS】オプションのグラフ表示(停留所)
- optionCellSize(Number,option)
- ・Default : 20
オプションデータ(3Ⅾグラフ)セルサイズ(メートル)
参照:【Harmoware-VIS】オプションのグラフ表示(停留所)
- optionElevationScale(Number,option)
- ・Default : 1
オプションデータ(3Ⅾグラフ)高さのスケール値
参照:【Harmoware-VIS】オプションのグラフ表示(停留所)
- optionCentering(Boolean,option)
- ・Default : false
trueでオプションデータ(3Ⅾグラフ)パターン1で表示時に4本のグラフをアイコンの中心に位置付ける
参照:【Harmoware-VIS】オプションのグラフ表示(停留所)
| 表示イメージ |
|---|
 |
- optionDisplayPosition(Number,option)
- ・Default : 30
アイコンレイヤーをSimpleMeshLayerを指定時で
オプションデータ(3Ⅾグラフ)をパターン1で表示する場合の
4本のグラフのアイコンの中心位置から距離(メートル)
参照:【Harmoware-VIS】オプションのグラフ表示(停留所)
| 表示イメージ |
|---|
 |
- getCubeColor(Function,option)
- ・Default :
x => x.optColor || [x.color] || [DARKMAGENTA]
オプションデータ(3Ⅾグラフ)配色情報アクセサ
戻り値のフォーマット:[ グラフ1の色指定(RGB[A]) , [ グラフ2の色指定 ] , [ グラフ3の色指定 ] , [ グラフ4の色指定 ] ]
参照:【Harmoware-VIS】オプションのグラフ表示(停留所)
- getCubeElevation(Function,option)
- ・Default :
x => x.optElevation || [0]
オプションデータ(3Ⅾグラフ)高さ情報アクセサ(メートル)
戻り値のフォーマット:[ グラフ1の高さ指定 , [ グラフ2の高さ指定 ] , [ グラフ3の高さ指定 ] , [ グラフ4の高さ指定 ] ]
参照:【Harmoware-VIS】オプションのグラフ表示(停留所)
- mesh(any,option)
- ・Default :※下記参照
非移動体アイコンを使用するレイヤーがSimpleMeshLayerの場合に表示するアイコンのデータ
使用できるアイコンのデータの詳細はSimpleMeshLayerのリファレンスを参照
| Defaultアイコン |
|---|
|
- meshSizeScale(Number,option)
- ・Default : 40
非移動体アイコンを使用するレイヤーがSimpleMeshLayerの場合のアイコンのスケール値
- getOrientation(Function,option)
- ・Default :
[0,0,0]
非移動体アイコンを使用するレイヤーがSimpleMeshLayerの場合のアイコンの回転情報アクセサ
戻り値のフォーマット:[pitch, yaw, roll]
- getScale(Function,option)
- ・Default :
[1,1,1]
非移動体アイコンを使用するレイヤーがSimpleMeshLayerの場合のアイコンの各軸に沿ったスケール値
戻り値のフォーマット:[x, y, z]
- getTranslation(Function,option)
- ・Default :
[0,0,0]
非移動体アイコンを使用するレイヤーがSimpleMeshLayerの場合のアイコンの中心位置からのオフセット値(メートル)
戻り値のフォーマット:[x, y, z]
## LineMapLayer
LineMapLayer は道路や線路、建築物や範囲などの非移動体を「線」「面」「立体」でレンダリングします。
内部でdeck.glの
LineLayerと
PathLayerと
PolygonLayerを使用しています。
LineMapLayer は`HarmoVisLayers`のためのレイヤーです。
`HarmoVisLayers`の詳細は
リンク先を参照
Examples.js
<HarmoVisLayers ...
    layers={[
        new LineMapLayer( { data: this.props.linemapData } )
    ]}
/>
- data(Array,required)
- 非移動体オブジェクト表示用のデータ(必須)
通常はHarmoware-VISのPropertiesのlinemapDataを設定
linemapDataのフォーマットはAPI解説を参照
- lineOpacity(Number,option)
- ・Default : 1.0
LineLayerとPathLayerのオブジェクト不透明度値(opacity)
- polygonOpacity(Number,option)
- ・Default : 0.5
PolygonLayerのオブジェクト不透明度値(opacity)
- getWidth(Function,option)
- ・Default :
x => x.strokeWidth || 1
LineLayerとPathLayerのオブジェクト線幅情報アクセサ(メートル)
- getColor(Function,option)
- ・Default :
x => x.color || WHITE
LineLayerとPathLayerのオブジェクト線色情報アクセサ(getColor)
PolygonLayerのオブジェクト線色情報アクセサ(getFillColor / getLineColor)
- getSourcePosition(Function,option)
- ・Default :
x => x.sourcePosition
LineLayerのオブジェクト線始端情報アクセサ(getSourcePosition)
- getTargetPosition(Function,option)
- ・Default :
x => x.targetPosition
LineLayerのオブジェクト線終端情報アクセサ(getTargetPosition)
- getPath(Function,option)
- ・Default :
x => x.path || []
PathLayerのオブジェクト線経路情報アクセサ(getPath)
- getPolygon(Function,option)
- ・Default :
x => x.polygon || []
PolygonLayerのオブジェクト3D構成情報アクセサ(getPath)
- getCoordinates(Function,option)
- ・Default :
x => x.coordinates || []
PolygonLayerのオブジェクト2D構成情報アクセサ(getPath)
- getElevation(Function,option)
- ・Default :
x => x.elevation || 3
PolygonLayerのオブジェクト高さ情報アクセサ(getPath)
- getDashArray(Function,option)
- ・Default :
x => x.dash || [0,0]
PathLayerのオブジェクト点線情報アクセサ(getPath)
戻り値のフォーマット:[dashSize, gapSize]
# Control component リファレンス
Harmoware-VIS の Control component リファレンスについては別記事「[Harmoware-VIS Control component リファレンス](https://qiita.com/ucl_Harmoware_VIS/items/7315ccff187ca608c0db)」をご覧ください。