概要
Kaggleの血液検査データセットを使ってデータ分析をしてみた。
いろいろ試してみた結果、量が多くなったので分割します。
今回はその④ (全5回)
他の回はこちらから
①~モデルの性能比較をしてみた~
②~特徴選択をして、重要度を可視化してみた~
③~アンサンブル学習をしてみた~
⑤~不均衡データの取り扱い~
使用したデータセット:Patient Treatment Classification (Electronic Health Record Dataset)
インドネシアの病院で集められた血液検査の結果から、患者に治療が必要かどうかを判定する
モデル
今回はXGBoostで外れ値の影響を確認する
- XGBoost
データ確認
データは血液検査の結果。
データの検査方法が分からなかったため、正常値は2016年度国立がん研究センターのデータをお借りしました。(※ 正常値は測定方法などにより若干のばらつきあり)
| 列No | 検査値 | 和訳 | 正常値 | 高いと | 低いと |
|---|---|---|---|---|---|
| 1 | HAEMATOCRIT | ヘマトクリット | 男性:40.7~50.1 %, 女性:35.1~44.4 % |
多血症など | 貧血など |
| 2 | HAEMOGLOBINS | ヘモグロビン | 男性:13.7~16.8 g/dl, 女性:11.6~14.8 g/dl |
多血症など | 貧血など |
| 3 | ERYTHROCYTE | 赤血球 | 男性:4.35~5.55 x 10⁶ /μL, 女性:3.86~4.92 x 10⁶ /μL |
多血症など | 貧血など |
| 4 | LEUCOCYTE | 白血球 | 3.3~8.6 x 10³/μL | 感染症・白血病など | 一部感染症・膠原病・貧血など |
| 5 | THROMBOCYTE | 血小板 | 158~348 x 103/μL | 血小板血症・白血病・多血症など | 貧血・紫斑病など |
| 6 | MCH | 平均赤血球ヘモグロビン量 | 27.5~33.2 pg | 巨赤芽球性貧血など | 鉄欠乏性貧血など |
| 7 | MCHC | 平均赤血球ヘモグロビン濃度 | 31.7~35.3 g/dL | 脱水・多血症など | 貧血など |
| 8 | MCV | 平均赤血球容積 | 83.6~98.2 fL | 巨赤芽球性貧血など | 鉄欠乏性貧血など |
| 9 | AGE | 年齢 | ― | ― | ― |
| 10 | SEX | 性別 | ― | ― | ― |
| 11 | SOURCE | 治療が必要か | out: 治療不要, in: 治療が必要 | ― | ― |
前処理は①と同じなので割愛
外れ値検索
from sklearn.neighbors import LocalOutlierFactor

outlier_LOF = []
clf = LocalOutlierFactor(n_neighbors=30)
predictions = clf.fit_predict(df_samp)
for index in df_samp[predictions == -1].index:
  outlier_LOF.append(df_samp.index.get_loc(index))

# 外れ値を除外
df_samp_LOF = df_samp.drop(df_samp.index[outlier_LOF])

# 除外後のデータ数を確認
print(f'{len(df_samp_LOF)}/{len(df_samp)}')

>>

print(f'{len(df_samp_LOF)}/{len(df_samp)}')
4348/4412
外れ値を除外
X_GBDT_LOF, y_GBDT_LOF, df_GBDT_LOF = dframe_copy(df_samp_LOF, "SOURCE")

train_X, test_X, train_y, test_y = train_test_split(X_GBDT_LOF, y_GBDT_LOF, test_size=0.2, random_state=42)
train_X, val_X, train_y, val_y = train_test_split(train_X, train_y, test_size=0.1, random_state=42)

# GBDTで学習
dtrain = xgb.DMatrix(train_X, label=train_y)
dval = xgb.DMatrix(val_X, label=val_y)
dtest = xgb.DMatrix(test_X)

params = {'objective': 'binary:logistic', 'silent':1, 'random_state': 71, 'eval_metric': 'auc'}
num_round = 25

watchlist = [(dtrain, 'train'), (dval, 'eval')]
GBDT_LOF_model = xgb.train(params, dtrain, num_round, evals=watchlist)

val_pred = GBDT_LOF_model.predict(dval)
val_y = val_y.tolist()
score_val = log_loss(val_y, val_pred)
print(f'logloss_val: {score_val: 4f}')

test_pred = GBDT_LOF_model.predict(dtest)

test_y = test_y.tolist()
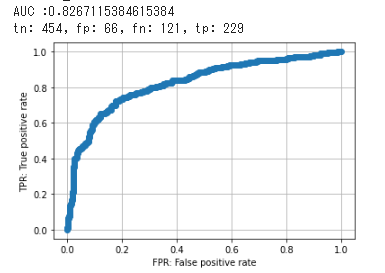
AUC_GBDT_LOF = create_ROCcurve(test_y, test_pred)
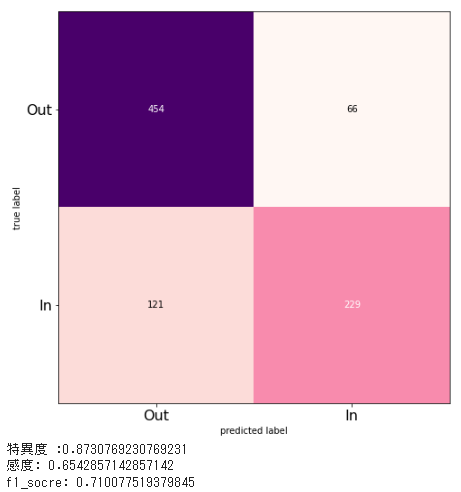
tn_GBDT_LOF, fp_GBDT_LOF, fn_GBDT_LOF, tp_GBDT_LOF, specificity_GBDT_LOF, recall_GBDT_LOF, f1_GBDT_LOF = create_cm(test_y, test_pred, True)
AUC_list.append(["AUC_GBDT_LOF", np.round(AUC_GBDT_LOF, 3)])
specificity_list.append(["specificity_GBDT_LOF", np.round(specificity_GBDT_LOF, 3)])
recall_list.append(["recall_GBDT_LOF", np.round(recall_GBDT_LOF, 3)])
f1_score_list.append(["f1_GBDT_LOF", np.round(f1_GBDT_LOF, 3)])
結果
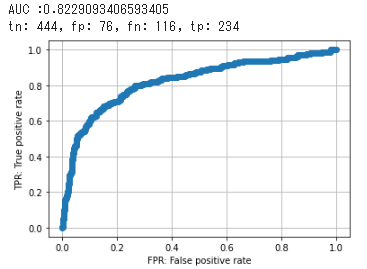
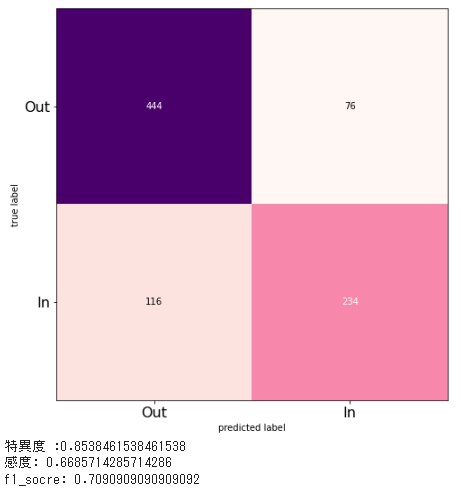
外れ値を除外し、特徴選択したパラメータ(②参照)で学習
# スコアが表示されないカラムを削除
X_GBDT_LOF, y_GBDT_LOF, df_GBDT_LOF = dframe_copy(df_samp_LOF, "SOURCE")
df_GBDT_LOF_dropzero = df_GBDT_LOF.drop(['HAEMATOCRIT_AB_1', 'HAEMOGLOBINS_AB_1', 'ERYTHROCYTE_AB_2',
       'LEUCOCYTE_AB_1', 'LEUCOCYTE_AB_2', 'THROMBOCYTE_AB_1',
       'THROMBOCYTE_AB_2', 'MCH_AB_1', 'MCH_AB_2', 'MCHC_AB_1', 'MCHC_AB_2'],axis=1)

X_GBDT_LOF_dropzero = df_GBDT_LOF_dropzero.values
# 変数を訓練用とテスト用に分割
train_X, test_X, train_y, test_y = train_test_split(X_GBDT_LOF_dropzero, y_GBDT_LOF, test_size=0.2, random_state=42)
train_X, val_X, train_y, val_y = train_test_split(train_X, train_y, test_size=0.1, random_state=42)

# GBDTで学習
dtrain = xgb.DMatrix(train_X, label=train_y)
dval = xgb.DMatrix(val_X, label=val_y)
dtest = xgb.DMatrix(test_X)

params = {'objective': 'binary:logistic', 'silent':1, 'random_state': 71, 'eval_metric': 'auc'}
num_round = 25

watchlist = [(dtrain, 'train'), (dval, 'eval')]
GBDT_LOF_dropzero_model = xgb.train(params, dtrain, num_round, evals=watchlist)

val_pred = GBDT_LOF_dropzero_model.predict(dval)
val_y = val_y.tolist()
score_val = log_loss(val_y, val_pred)
print(f'logloss_val: {score_val: 4f}')

pred_y = GBDT_LOF_dropzero_model.predict(dtest)

test_y = test_y.tolist()
AUC_GBDT_LOF_dropzero = create_ROCcurve(test_y, pred_y)
tn_GBDT_LOF_dropzero, fp_GBDT_LOF_dropzero, fn_GBDT_LOF_dropzero, tp_GBDT_LOF_dropzero, specificity_GBDT_LOF_dropzero, recall_GBDT_LOF_dropzero, f1_GBDT_LOF_dropzero = create_cm(test_y, pred_y, True)
AUC_list.append(["AUC_GBDT_LOF_IN", np.round(AUC_GBDT_LOF_dropzero, 3)])
specificity_list.append(["specificity_GBDT_LOF_IN", np.round(specificity_GBDT_LOF_dropzero, 3)])
recall_list.append(["recall_GBDT_LOF_IN", np.round(recall_GBDT_LOF_dropzero, 3)])
f1_score_list.append(["f1_GBDT_LOF_IN", np.round(f1_GBDT_LOF_dropzero, 3)])
結果
評価指標の比較
AUC_list = sorted(AUC_list, reverse=True, key=lambda x: x[1])
specificity_list = sorted(specificity_list, reverse=True, key=lambda x: x[1])
recall_list = sorted(recall_list, reverse=True, key=lambda x: x[1])
f1_score_list = sorted(f1_score_list, reverse=True, key=lambda x: x[1])

print("---ROC_AUC---")
for i in range(len(AUC_list)):
  print(AUC_list[i])
print("---特異度---")
for i in range(len(specificity_list)):
  print(specificity_list[i])
print("----感度----")
for i in range(len(recall_list)):
  print(recall_list[i])
print("----f1値----")
for i in range(len(f1_score_list)):
  print(f1_score_list[i])
結果
XGBoostの結果はこちらを参照
外れ値除外(_LOF), 重要度の低い特徴量を除外(_NI)
| ROC_AUC | 特異度 | 感度 | f1値 |
|---|---|---|---|
| ['AUC_GBDT_LOF', 0.827] | ['specificity_GBDT_LOF', 0.873] | ['recall_GBDT_LOF_IN', 0.669] | ['f1_GBDT_LOF', 0.71] |
| ['AUC_GBDT_LOF_IN', 0.823] | ['specificity_GBDT:', 0.855] | ['recall_GBDT_LOF', 0.654] | ['f1_GBDT_LOF_IN', 0.709] |
| ['AUC_GBDT:', 0.816] | ['specificity_GBDT_NI:', 0.855] | ['recall_GBDT:', 0.634] | ['f1_GBDT:', 0.692] |
| ['AUC_GBDT_NI:', 0.816] | ['specificity_GBDT_LOF_IN', 0.854] | ['recall_GBDT_NI:', 0.634] | ['f1_GBDT_NI:', 0.692] |
考察
外れ値を除くだけでも全体的に改善が見られた。
外れ値除外と特徴選択を組みあせた場合は、外れ値除外のみと比較して感度は若干改善したが、全体として大きな改善は見られなかった。
参考資料
機械学習における前処理3 欠損値・外れ値・不均衡データ
【外れ値,python】Local outlier Factor(LoF)の紹介【scikit-learn】
Local Outlier Factor


