はじめに
前回Chainerの新機能、trainerを使ってCIFAR-10の画像分類に挑戦しようとしたのですが、マシンパワーの都合上、動作を確認できずに終わってしまいました。
そこで今回はMNISTを使ったAutoencoderの作成を通してtrainerの使い方を確認していこうと思います。
Autoencoderに関してはこちらの記事を参考にしました。
実装
MNISTの手書き文字1000個を入力とし、隠れ層を1層通して入力と等しくなるような出力を得るネットワークを作成します。
コード全体はこちらにあげています。
ネットワーク部分
隠れ層のユニット数は64まで絞っています。
また、_hidden=True_で呼び出すと隠れ層を出力できるようにしています。
class Autoencoder(chainer.Chain):
    def __init__(self):
        super(Autoencoder, self).__init__(
                encoder = L.Linear(784, 64),
                decoder = L.Linear(64, 784))

    def __call__(self, x, hidden=False):
        h = F.relu(self.encoder(x))
        if hidden:
            return h
        else:
            return F.relu(self.decoder(h))
データ作成部分
MNISTのデータを読み込んで、教師データとテストデータを作成します。
教師データのラベルは必要なく、出力は入力と同じものになるので、少しデータの形をいじっています。
# MNISTのデータの読み込み
train, test = chainer.datasets.get_mnist()

# 教師データ
train = train[0:1000]
train = [i[0] for i in train]
train = tuple_dataset.TupleDataset(train, train)
train_iter = chainer.iterators.SerialIterator(train, 100)

# テスト用データ
test = test[0:25]
モデル作成
model = L.Classifier(Autoencoder(), lossfun=F.mean_squared_error)
model.compute_accuracy = False
optimizer = chainer.optimizers.Adam()
optimizer.setup(model)
ここで注意することが2点
-
loss関数の定義
L.Classifierでモデルを定義した際、デフォルトではloss関数はsoftmax_cross_entropyとなるようですが、今回はmean_squared_errorを使いたいので、lossfunで定義しなければなりません。 -
accuracyを計算しない
今回は教師データにラベルを使わないのでaccuracyの計算は必要ありません。なのでcompute_accuracyをFalseにしておく必要があります。
学習部分
特に説明の必要はないと思います。
trainerが使えるようになってから、この部分が簡単に書けるようになって助かっています^^
updater = training.StandardUpdater(train_iter, optimizer, device=-1)
trainer = training.Trainer(updater, (N_EPOCH, 'epoch'), out="result")
trainer.extend(extensions.LogReport())
trainer.extend(extensions.PrintReport( ['epoch', 'main/loss']))
trainer.extend(extensions.ProgressBar())

trainer.run()
結果確認
関数を作ってmatplotlibで結果をプロットします。
画像上部に赤文字で元のラベルをプリントしています。座標の調整をきちんとしていないので若干かぶっている部分もありますが...
ちなみにこの関数にtest用データをそのまま入力すると、元のデータの画像が出力されます。
def plot_mnist_data(samples):
    for index, (data, label) in enumerate(samples):
        plt.subplot(5, 5, index + 1)
        plt.axis('off')
        plt.imshow(data.reshape(28, 28), cmap=cm.gray_r, interpolation='nearest')
        n = int(label)
        plt.title(n, color='red')
    plt.show()

pred_list = []
for (data, label) in test:
    pred_data = model.predictor(np.array([data]).astype(np.float32)).data
    pred_list.append((pred_data, label))
plot_mnist_data(pred_list)
結果
epochを増やしていくとどのように変化していくのかを見ていきます。
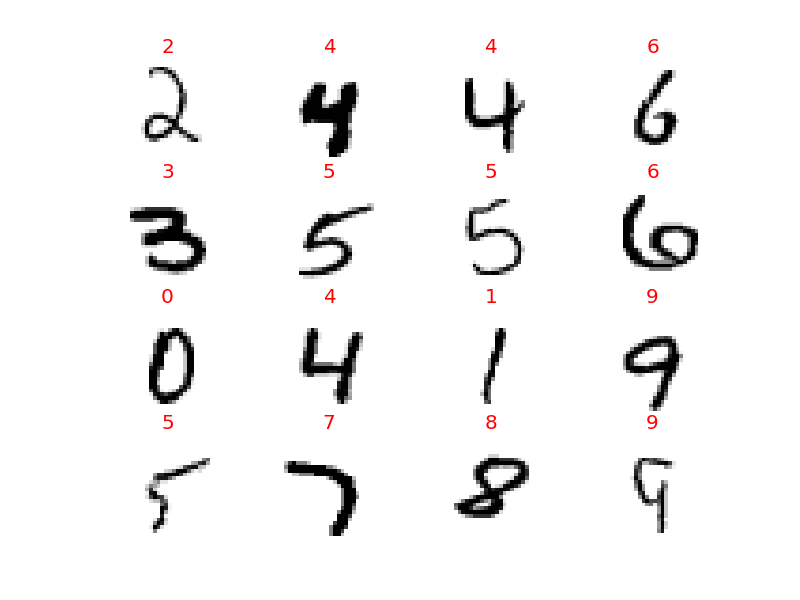
元の画像
0〜9まですべて含んだ16個の画像です。この16種類の変化を見ていきます。
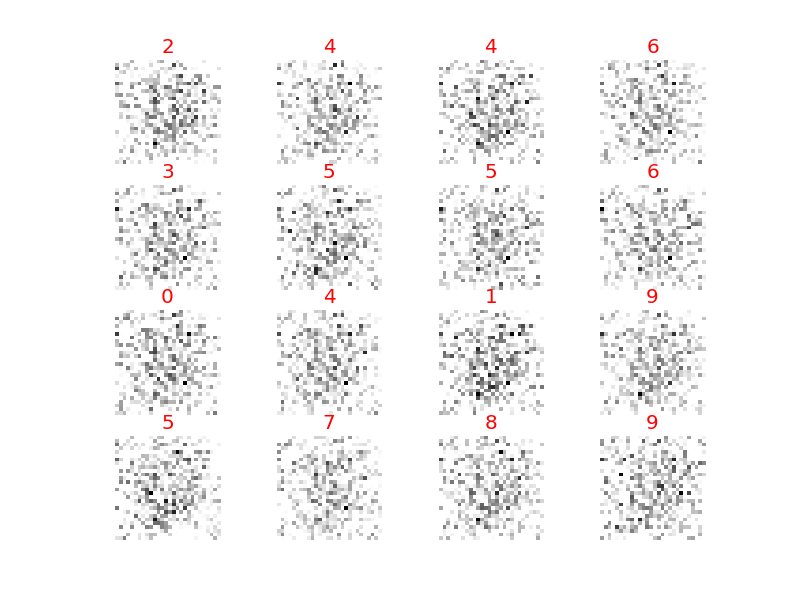
epoch = 1
テレビの砂嵐のようになってこの時点では何ななんだかわかりません。
epoch = 5
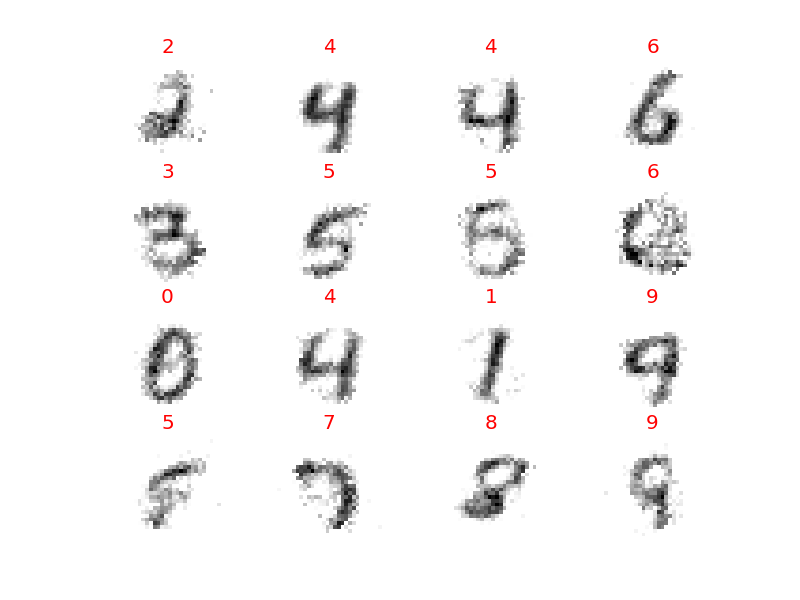
ようやく数字のようなものが見えてきましたが、まだまだ数字とはわかりません。
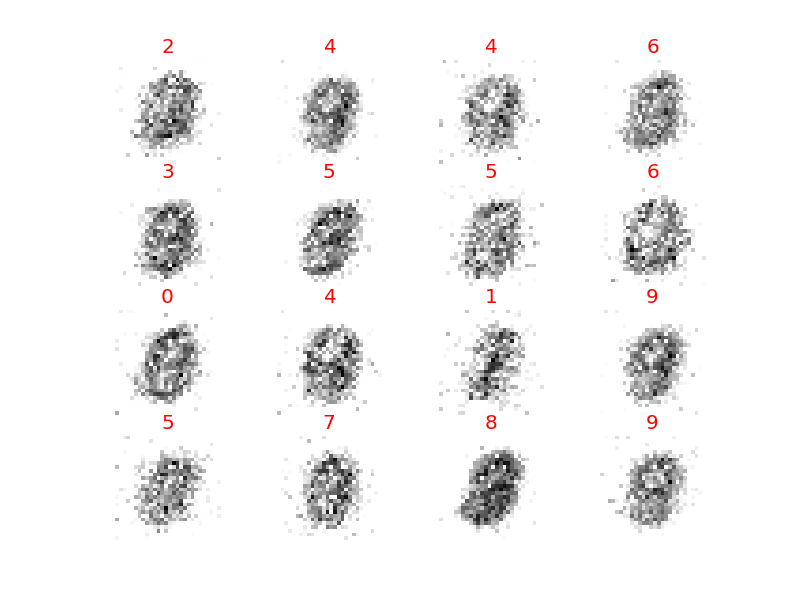
epoch = 10
0, 1, 3などはだんだん形が見えてきました。二段目の6はまだつぶれててよくわかりません。
epoch = 20
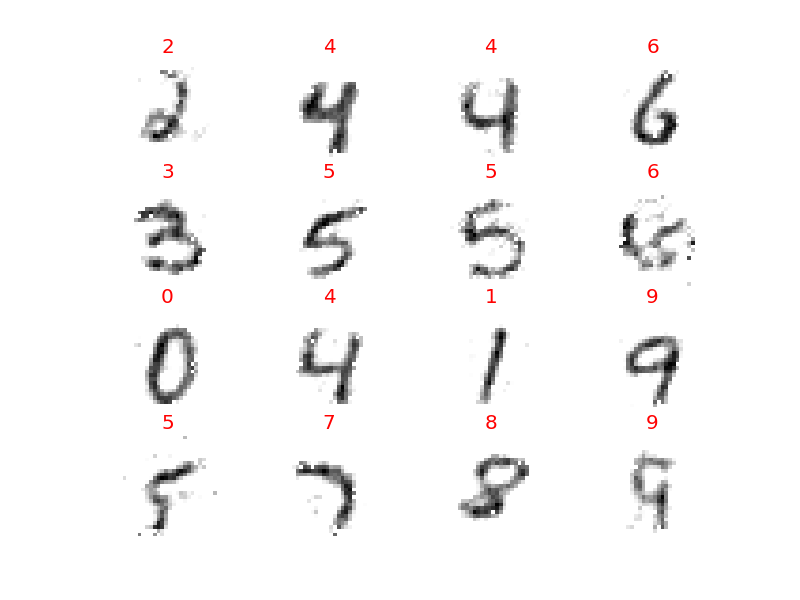
ほぼ数字が見えてきました。
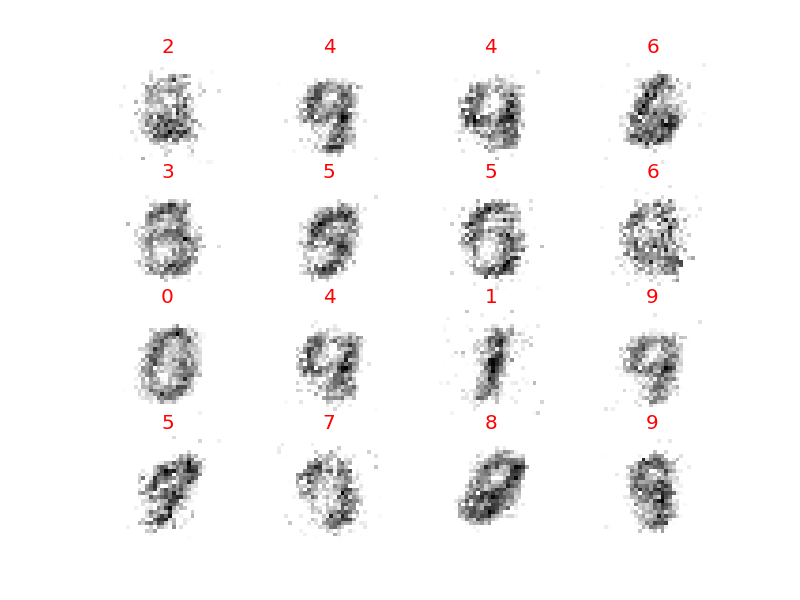
epoch = 100
一気に100まで進めてみました。ほとんど潰れていた2段目の6も形が見えてきました。
もっとepochを増やせばはっきりと見えてくるのでしょうが、今回はここまで。
おわりに
ネットワークが数字を数字と認識していく過程をみるのは楽しかったです。
trainerは便利ですが、loss関数などいろいろな部分が自動で決まってしまうので注意が必要ですね。
(2016.08.10 修正)
loss関数がデフォルトでsoft_max_cross_entropyに設定されるのはtrainerではなくClassiferの仕様でした。trainerで使用するupdaterの定義の際にloss関数を指定することになるのですが、通常はoptimizerにセットしたものがリンクされるようです。
