こちらを書いてから、腕試し的に分析しようと思いましたがルール上Databricks社員は応募不可でした。
提出する体でNetflixデータを分析してみます。CSVファイルを事前にダウンロードしてボリュームにアップロードしておきます。実際に応募する場合以下の追加ステップが必要です。
- 英語ノートブックの方がいいと思います。
- 5分以内のデモ動画を録画します。
- LinkedInかRedditに投稿してリンクをコピーします。
- Hackathon登録後に表示される応募フォームにリンクと説明文を添えてアップロードします。
Netflix データセット EDA (探索的データ解析)
このノートブックでは、Netflixで利用可能なテレビ番組と映画のデータセットを探索します。
データセット概要
- 出典: Kaggle - Netflix Data
- 内容: Netflix TVショーと映画の情報
- カラム数: 10個のカラム
1. データの読み込み
# Databricks VolumesからNetflixデータセットを読み込み
file_path = "/Volumes/workspace/hackathon/data/Netflix Dataset.csv"

df = spark.read.format("csv") \
    .option("header", "true") \
    .option("inferSchema", "true") \
    .load(file_path)

print(f"データセットの行数: {df.count()}")
print(f"データセットの列数: {len(df.columns)}")
データセットの行数: 7791
データセットの列数: 11
2. データの基本情報
# スキーマの確認
df.printSchema()
root
 |-- Show_Id: string (nullable = true)
 |-- Category: string (nullable = true)
 |-- Title: string (nullable = true)
 |-- Director: string (nullable = true)
 |-- Cast: string (nullable = true)
 |-- Country: string (nullable = true)
 |-- Release_Date: string (nullable = true)
 |-- Rating: string (nullable = true)
 |-- Duration: string (nullable = true)
 |-- Type: string (nullable = true)
 |-- Description: string (nullable = true)
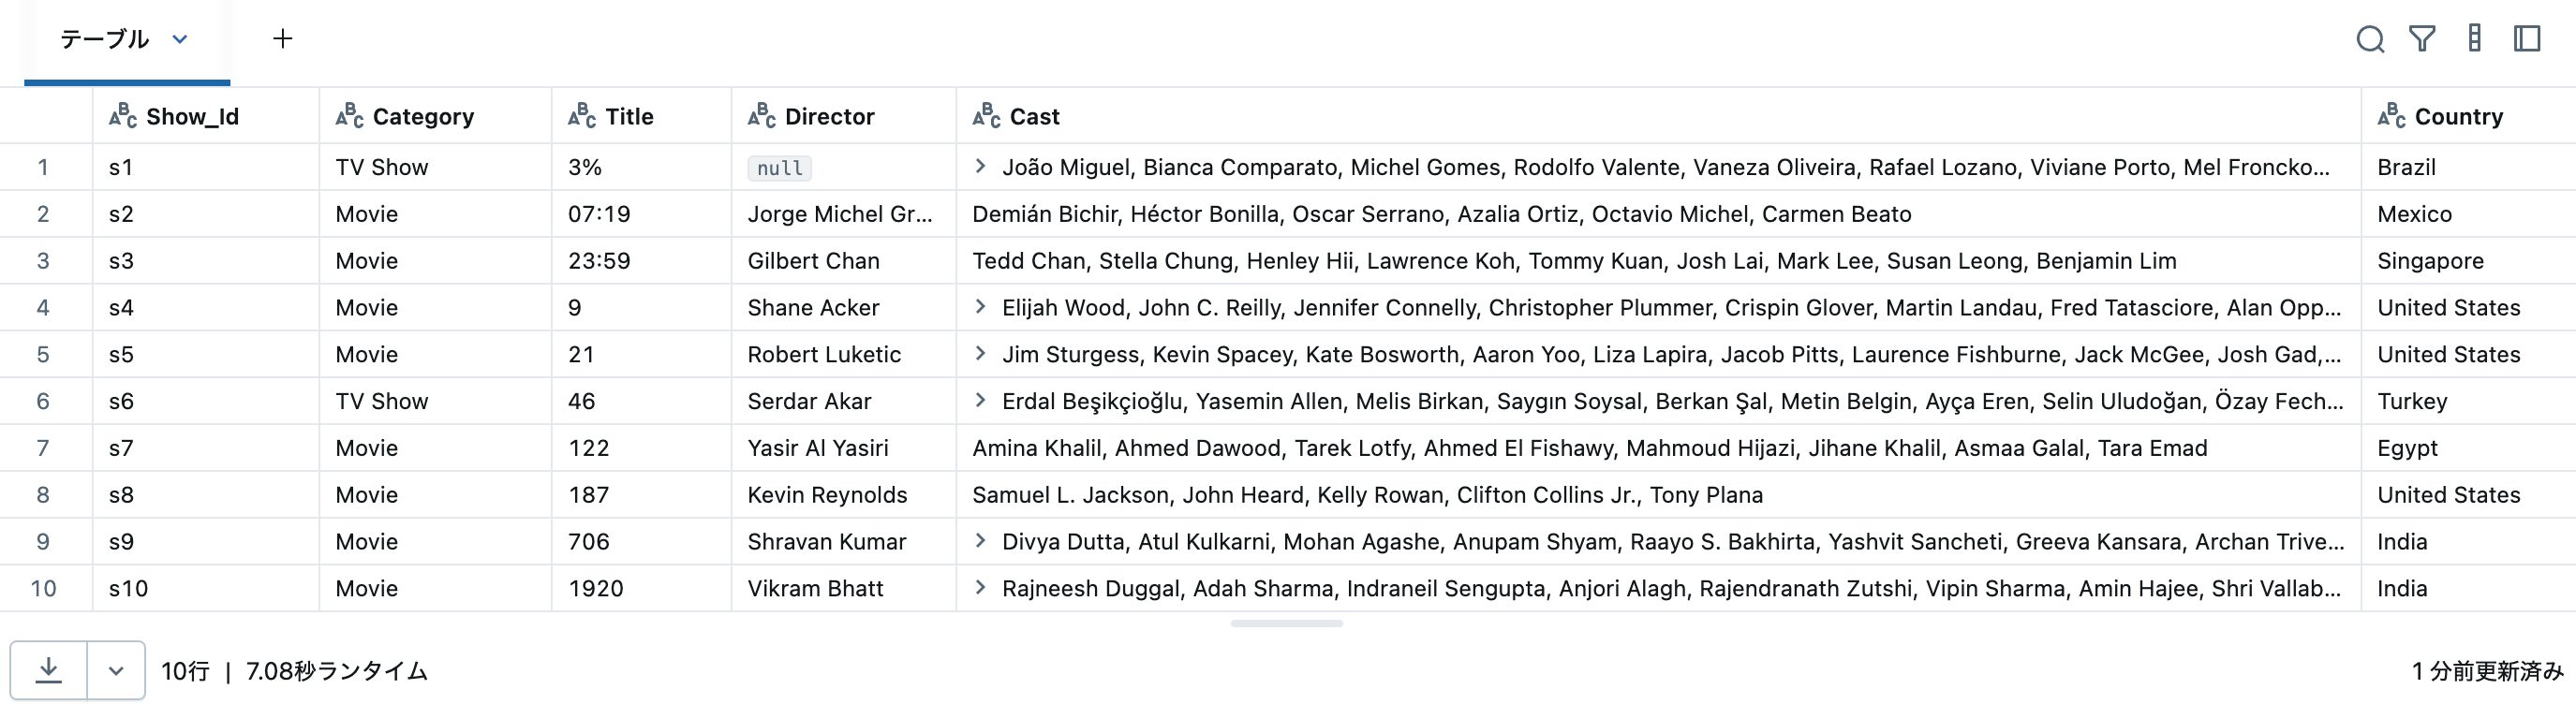
# 最初の10行を表示
display(df.limit(10))
# カラム名の一覧
print("カラム名:")
for col in df.columns:
    print(f"  - {col}")
カラム名:
  - Show_Id
  - Category
  - Title
  - Director
  - Cast
  - Country
  - Release_Date
  - Rating
  - Duration
  - Type
  - Description
3. 欠損値の確認
from pyspark.sql.functions import col, count, when, isnan
from pyspark.sql.types import NumericType

# 各カラムの欠損値数を計算
# 数値型カラムのみisnan()を使用してキャストエラーを回避
null_count_exprs = []
for c in df.columns:
    col_type = df.schema[c].dataType
    if isinstance(col_type, NumericType):
        # 数値型カラムはnullとNaNの両方をチェック
        null_count_exprs.append(count(when(col(c).isNull() | isnan(c), c)).alias(c))
    else:
        # 非数値型カラムはnullのみをチェック
        null_count_exprs.append(count(when(col(c).isNull(), c)).alias(c))

null_counts = df.select(null_count_exprs)

print("欠損値の数:")
display(null_counts)
欠損値の数:
| Show_Id | Category | Title | Director | Cast | Country | Release_Date | Rating | Duration | Type | Description |
|---|---|---|---|---|---|---|---|---|---|---|
| 0 | 1 | 2 | 2390 | 719 | 509 | 12 | 9 | 2 | 3 | 3 |
# 欠損値の割合
total_rows = df.count()

null_percentages = []
for c in df.columns:
    null_count = df.filter(col(c).isNull()).count()
    percentage = (null_count / total_rows) * 100
    null_percentages.append((c, null_count, f"{percentage:.2f}%"))

null_df = spark.createDataFrame(null_percentages, ["Column", "Null_Count", "Percentage"])
display(null_df.orderBy(col("Null_Count").desc()))
| Column | Null_Count | Percentage |
|---|---|---|
| Director | 2390 | 30.68% |
| Cast | 719 | 9.23% |
| Country | 509 | 6.53% |
| Release_Date | 12 | 0.15% |
| Rating | 9 | 0.12% |
| Type | 3 | 0.04% |
| Description | 3 | 0.04% |
| Title | 2 | 0.03% |
| Duration | 2 | 0.03% |
| Category | 1 | 0.01% |
| Show_Id | 0 | 0.00% |
4. カテゴリ別の分析 (映画 vs TVショー)
# Categoryカラム(または類似のカラム)の分布
# カラム名がCategory、Type、またはshow_typeなどの場合に対応

# まずカラム名を確認
category_col = None
for c in df.columns:
    if c.lower() in ['category', 'type', 'show_type', 'listed_in']:
        category_col = c
        break

if category_col:
    category_counts = df.groupBy(category_col).count().orderBy("count", ascending=False)
    display(category_counts)
else:
    print("カテゴリを表すカラムが見つかりませんでした。")
| Category | count |
|---|---|
| Movie | 5379 |
| TV Show | 2410 |
| null | 1 |
| William Wyler | 1 |
円グラフ。

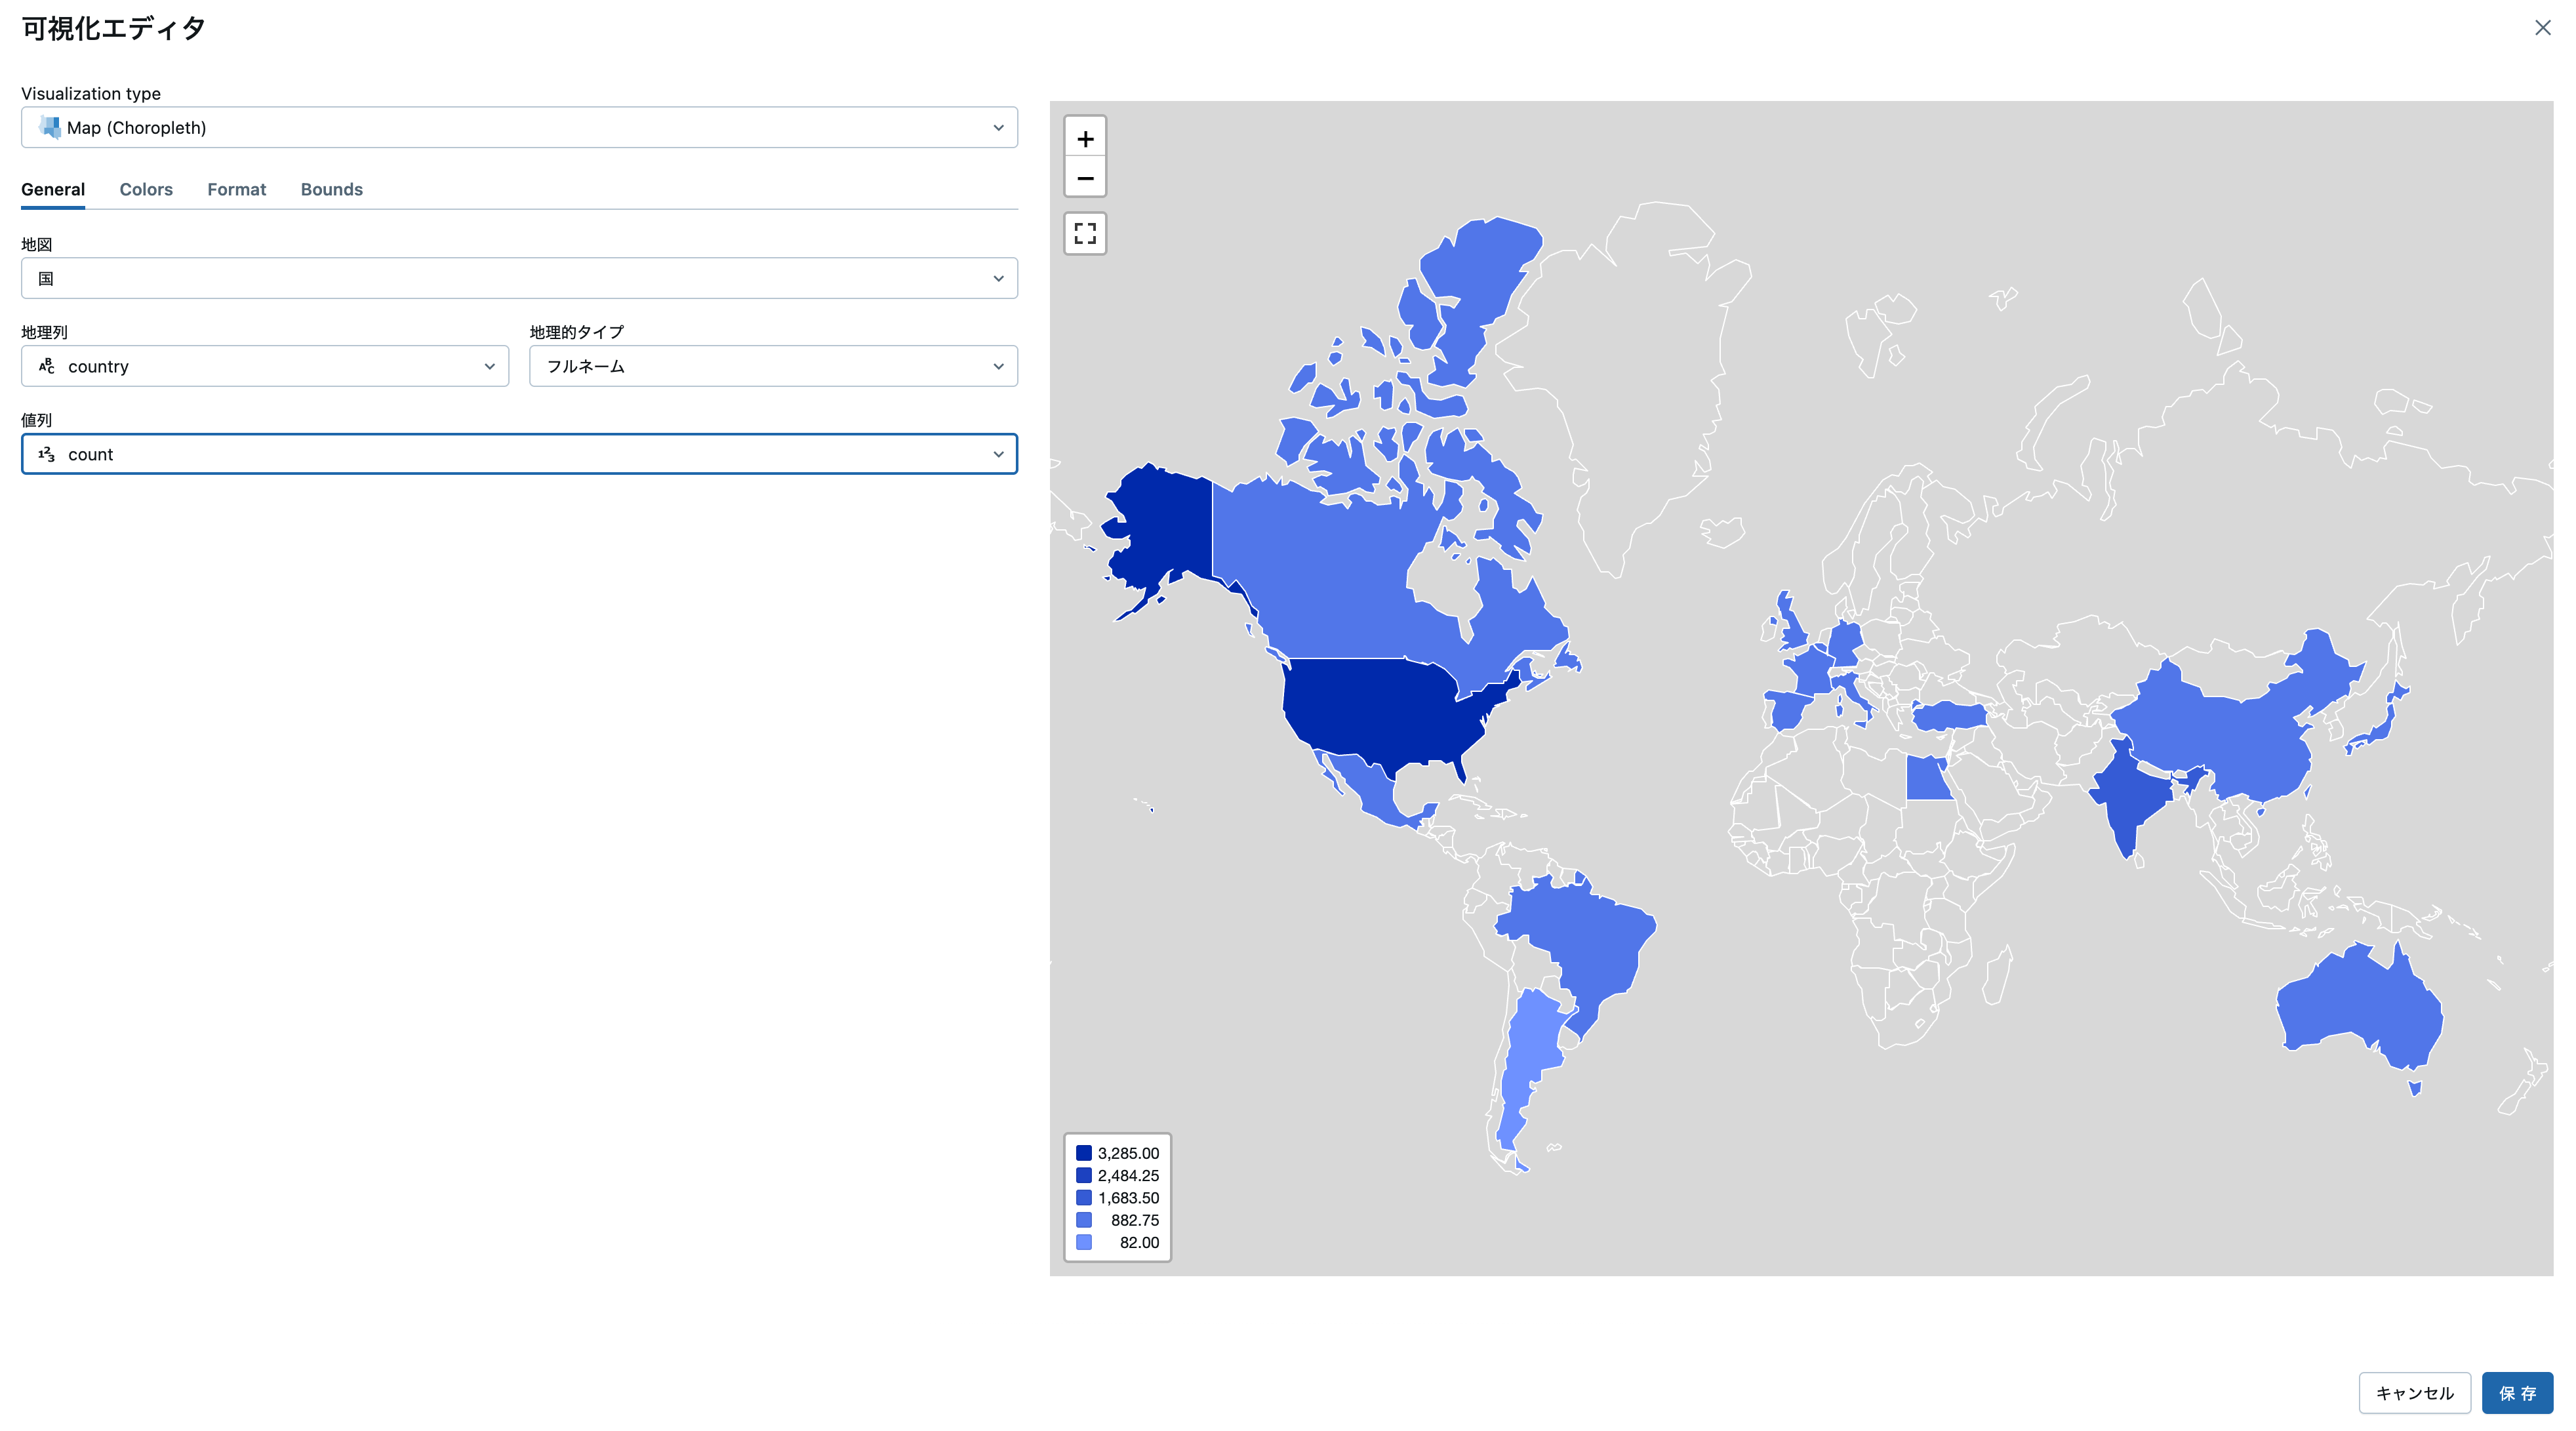
5. 国別の分析
from pyspark.sql.functions import explode, split, trim

# Countryカラムの確認(複数国がカンマ区切りの場合を考慮)
country_col = None
for c in df.columns:
    if c.lower() in ['country', 'countries']:
        country_col = c
        break

if country_col:
    # 国を分割して個別にカウント
    df_countries = df.select(explode(split(col(country_col), ",")).alias("country"))
    df_countries = df_countries.withColumn("country", trim(col("country")))

    country_counts = df_countries.groupBy("country").count().orderBy("count", ascending=False)

    print("トップ20の制作国:")
    display(country_counts.limit(20))
else:
    print("国を表すカラムが見つかりませんでした。")
| country | count |
|---|---|
| United States | 3285 |
| India | 990 |
| United Kingdom | 723 |
| Canada | 412 |
| France | 348 |
| Japan | 287 |
| Spain | 213 |
| South Korea | 212 |
| Germany | 197 |
| Mexico | 154 |
| China | 147 |
| Australia | 144 |
| Egypt | 110 |
| Turkey | 108 |
| Hong Kong | 102 |
| Italy | 90 |
| Brazil | 88 |
| Taiwan | 85 |
| Belgium | 85 |
| Argentina | 82 |
地図(コロプレス)、いつの間にか使えるようになってました。
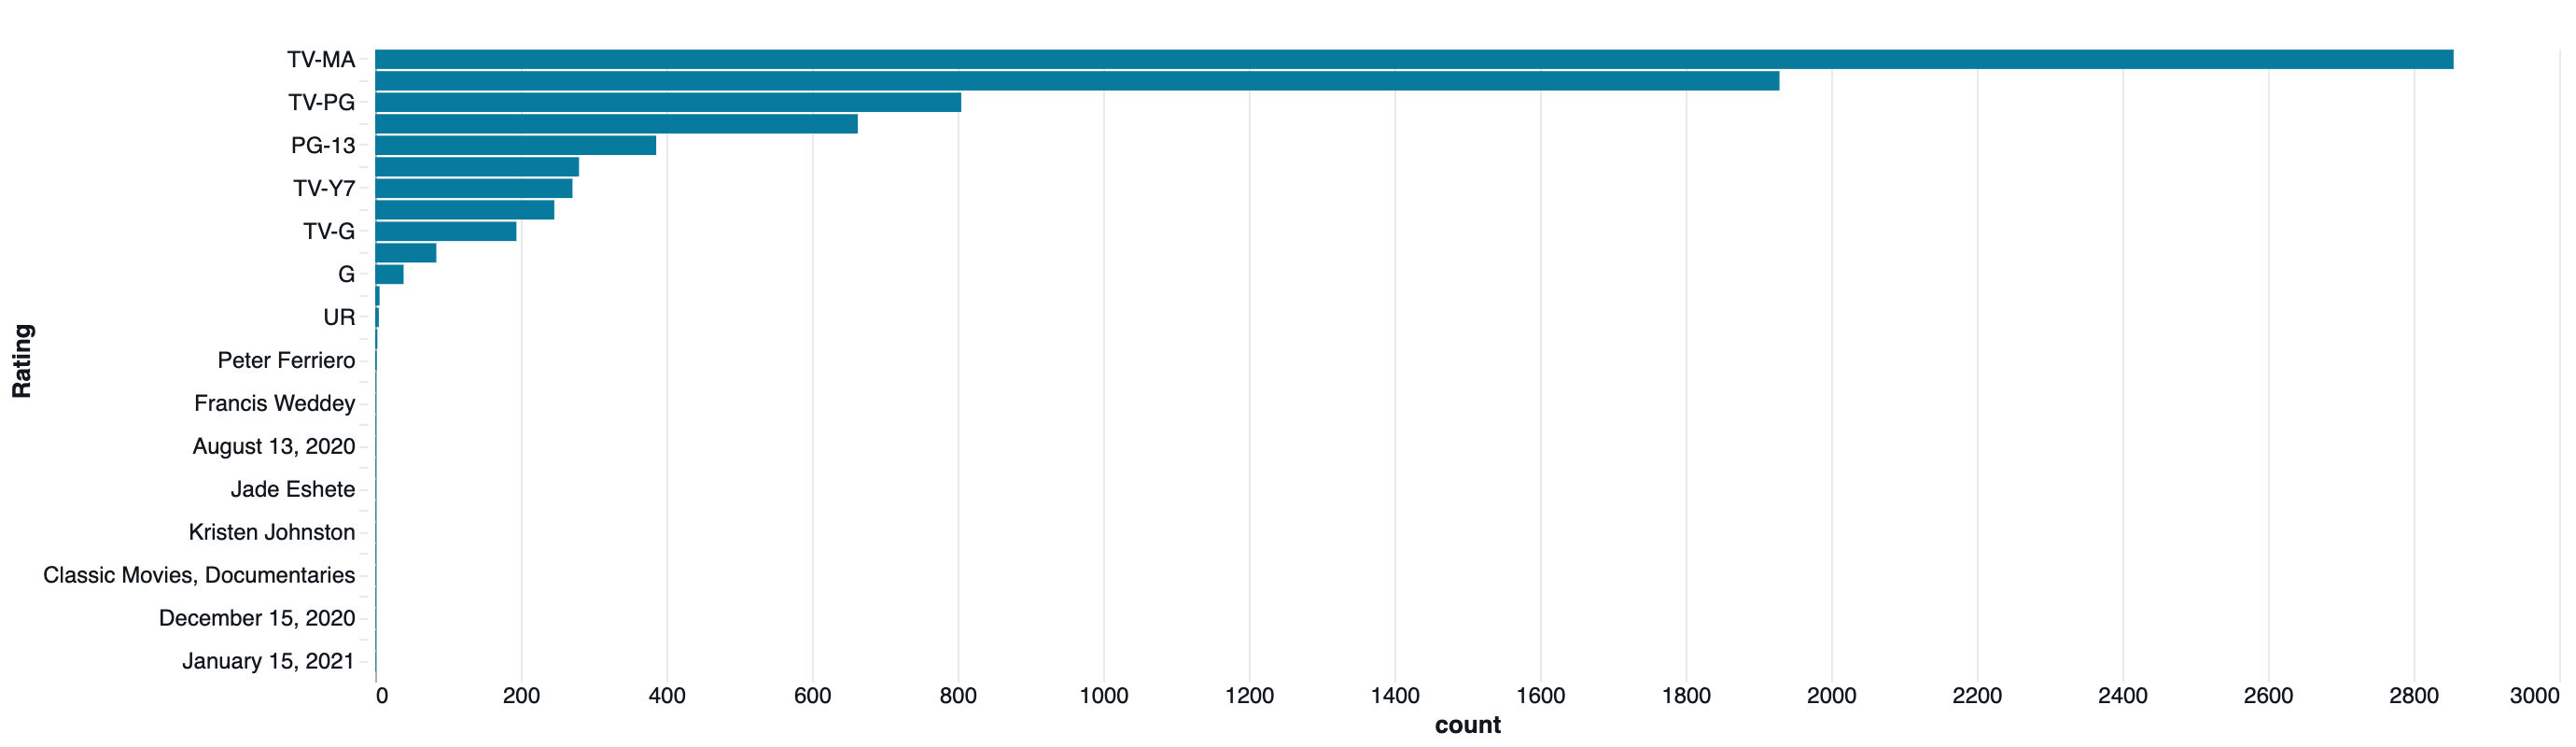
6. レーティングの分布
# Ratingカラムの分布
rating_col = None
for c in df.columns:
    if c.lower() in ['rating', 'maturity_rating']:
        rating_col = c
        break

if rating_col:
    rating_counts = df.groupBy(rating_col).count().orderBy("count", ascending=False)
    display(rating_counts)
else:
    print("レーティングを表すカラムが見つかりませんでした。")
| Rating | count |
|---|---|
| TV-MA | 2855 |
| TV-14 | 1929 |
| TV-PG | 805 |
| R | 663 |
| PG-13 | 386 |
| TV-Y | 280 |
| TV-Y7 | 271 |
| PG | 246 |
| TV-G | 194 |
| NR | 84 |
| G | 39 |
| null | 9 |
| TV-Y7-FV | 6 |
| UR | 5 |
| NC-17 | 3 |
| Peter Ferriero | 2 |
| Nick Kroll | 1 |
| Francis Weddey | 1 |
| January 13, 2021 | 1 |
| August 13, 2020 | 1 |
| Marquell Manning | 1 |
| Jade Eshete | 1 |
| Álvaro Cervantes | 1 |
| Kristen Johnston | 1 |
| Ted Ferguson | 1 |
| Classic Movies, Documentaries | 1 |
| United States | 1 |
| December 15, 2020 | 1 |
| Imanol Arias | 1 |
| January 15, 2021 | 1 |
棒グラフ
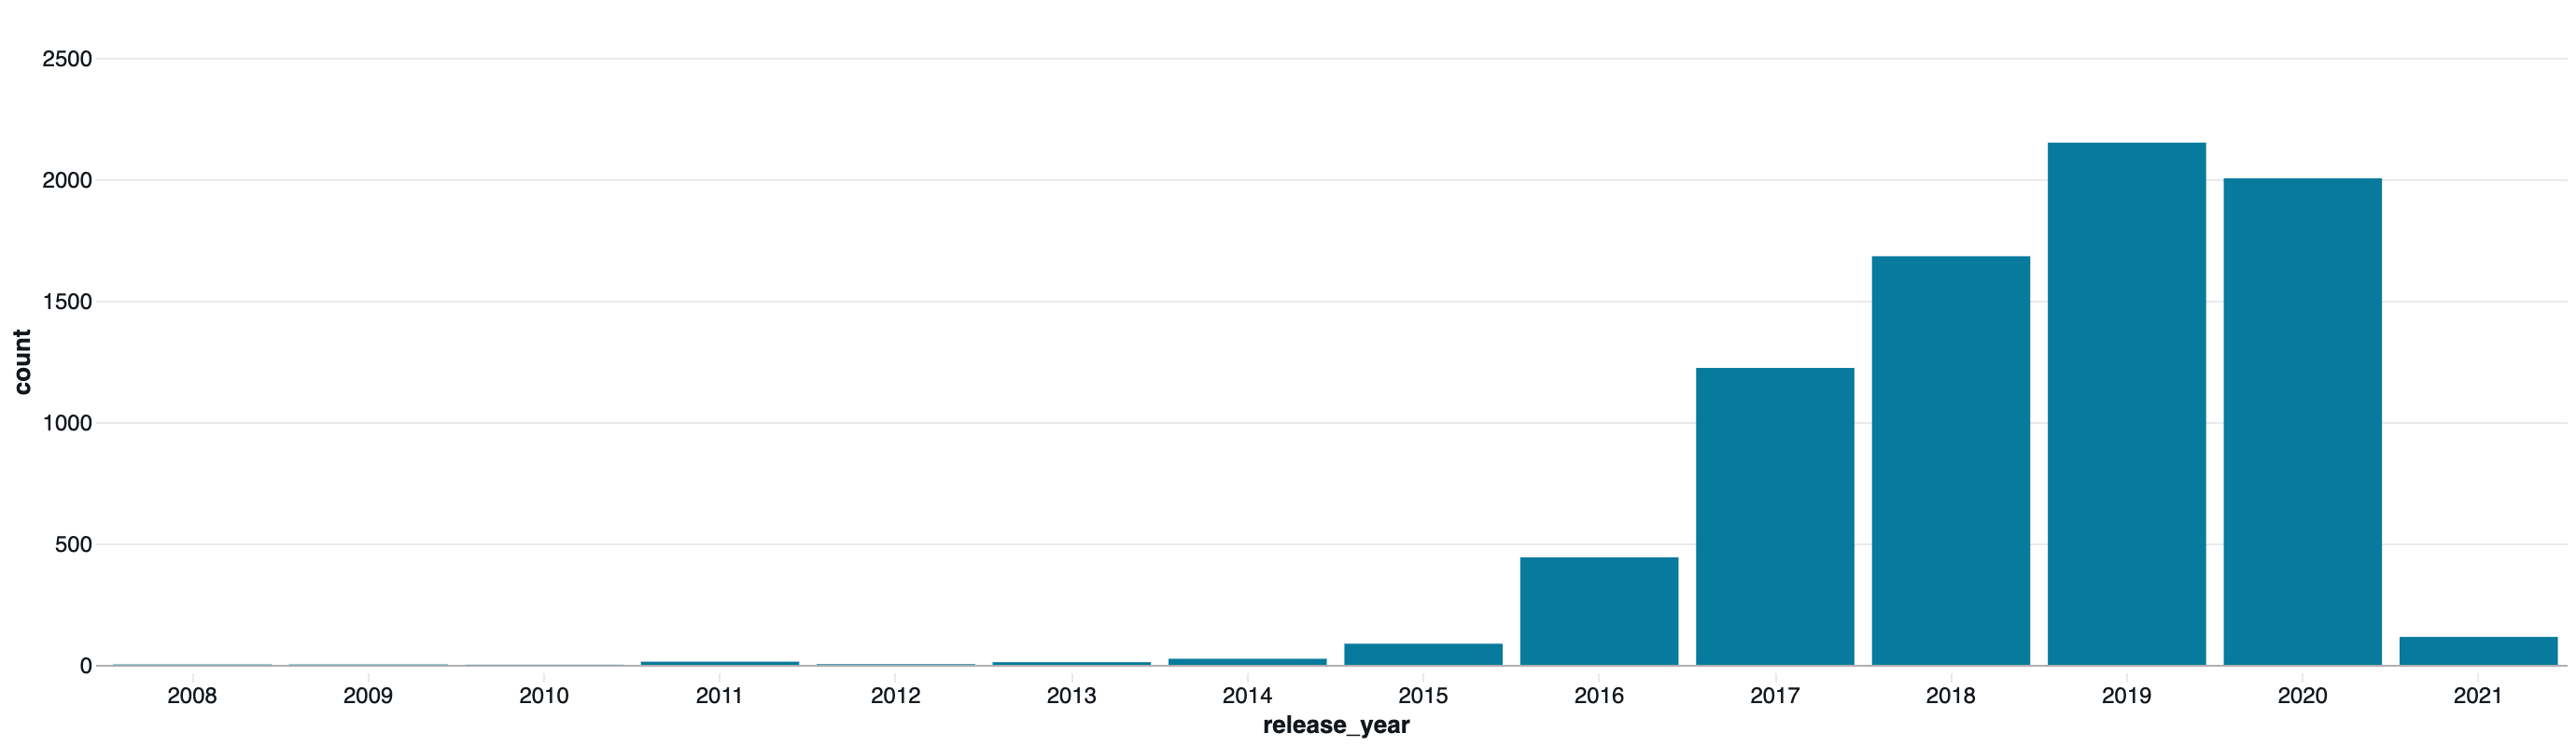
7. リリース年の傾向分析
from pyspark.sql.functions import year, to_date, regexp_extract

# Release_DateまたはRelease Yearカラムから年を抽出
date_col = None
for c in df.columns:
    if 'release' in c.lower() or 'date' in c.lower() or 'year' in c.lower():
        date_col = c
        break

if date_col:
    # 年を抽出 (文字列から4桁の数字を抽出)
    df_with_year = df.withColumn("release_year", regexp_extract(col(date_col), r"(\d{4})", 1))

    # 年ごとのコンテンツ数
    year_counts = df_with_year.groupBy("release_year").count().orderBy("release_year", ascending=False)

    print("リリース年別のコンテンツ数:")
    display(year_counts.filter(col("release_year") != "").limit(30))
else:
    print("リリース日を表すカラムが見つかりませんでした。")
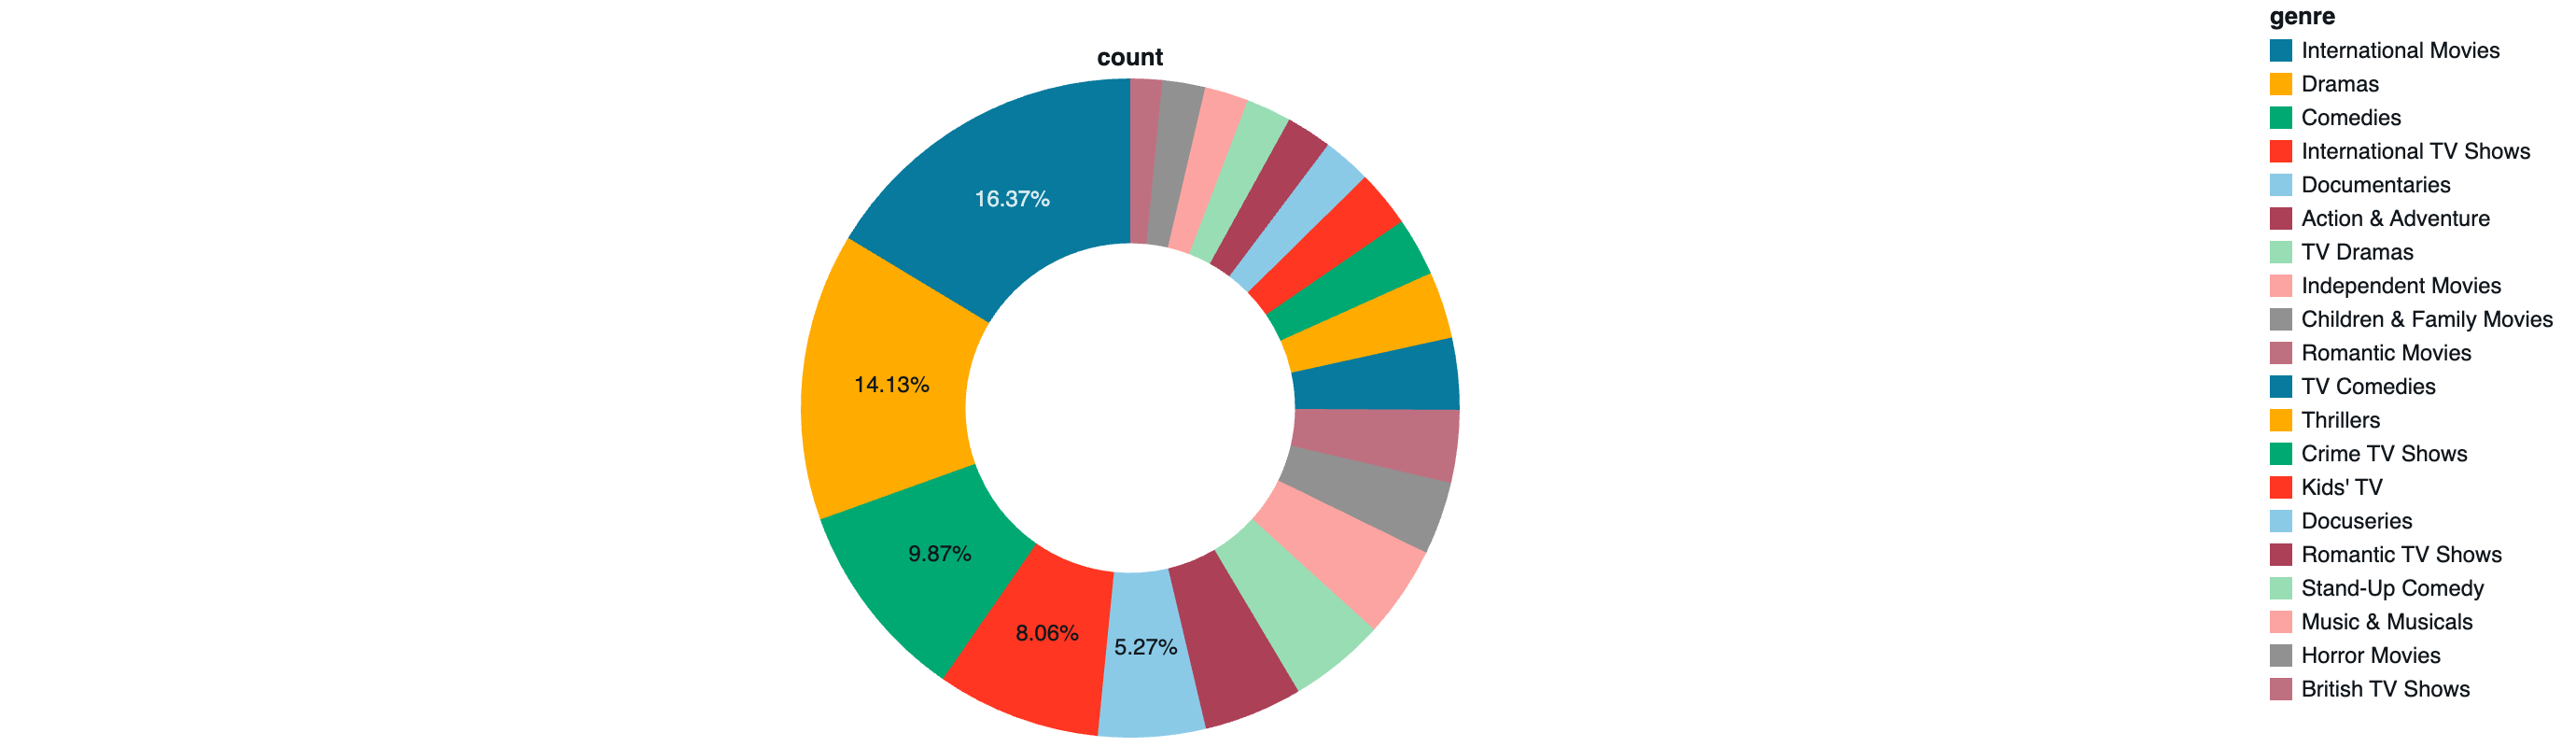
8. ジャンル/タイプの分析
# Type/Listed_in カラムの分析
genre_col = None
for c in df.columns:
    if c.lower() in ['type', 'listed_in', 'genre', 'genres']:
        if c.lower() != 'type' or category_col != c:  # categoryで使われていない場合
            genre_col = c
            break

if genre_col:
    # ジャンルを分割して個別にカウント(カンマ区切りの場合)
    df_genres = df.select(explode(split(col(genre_col), ",")).alias("genre"))
    df_genres = df_genres.withColumn("genre", trim(col("genre")))

    genre_counts = df_genres.groupBy("genre").count().orderBy("count", ascending=False)

    print("トップ20のジャンル:")
    display(genre_counts.limit(20))
else:
    print("ジャンルを表すカラムが見つかりませんでした。")
円グラフ
9. 出演者・監督の分析
# 監督の分析
director_col = None
for c in df.columns:
    if c.lower() in ['director', 'directors']:
        director_col = c
        break

if director_col:
    # 監督を分割して個別にカウント
    df_directors = df.filter(col(director_col).isNotNull()).select(
        explode(split(col(director_col), ",")).alias("director")
    )
    df_directors = df_directors.withColumn("director", trim(col("director")))

    director_counts = df_directors.groupBy("director").count().orderBy("count", ascending=False)

    print("トップ20の監督:")
    display(director_counts.limit(20))
else:
    print("監督を表すカラムが見つかりませんでした。")
| director | count |
|---|---|
| Jan Suter | 21 |
| Raúl Campos | 19 |
| Marcus Raboy | 16 |
| Jay Karas | 15 |
| Cathy Garcia-Molina | 13 |
| Youssef Chahine | 12 |
| Martin Scorsese | 12 |
| Jay Chapman | 12 |
| Steven Spielberg | 10 |
| David Dhawan | 9 |
| Shannon Hartman | 9 |
| Anurag Kashyap | 9 |
| Kunle Afolayan | 8 |
| Justin G. Dyck | 8 |
| Johnnie To | 8 |
| Yılmaz Erdoğan | 8 |
| Lance Bangs | 8 |
| Umesh Mehra | 8 |
| Ryan Polito | 8 |
| Hakan Algül | 8 |
# 出演者の分析
cast_col = None
for c in df.columns:
    if c.lower() in ['cast', 'actors']:
        cast_col = c
        break

if cast_col:
    # キャストを分割して個別にカウント
    df_cast = df.filter(col(cast_col).isNotNull()).select(
        explode(split(col(cast_col), ",")).alias("actor")
    )
    df_cast = df_cast.withColumn("actor", trim(col("actor")))

    cast_counts = df_cast.groupBy("actor").count().orderBy("count", ascending=False)

    print("トップ20の出演者:")
    display(cast_counts.limit(20))
else:
    print("出演者を表すカラムが見つかりませんでした。")
| actor | count |
|---|---|
| Anupam Kher | 42 |
| Shah Rukh Khan | 35 |
| Naseeruddin Shah | 30 |
| Om Puri | 30 |
| Takahiro Sakurai | 29 |
| Akshay Kumar | 29 |
| Yuki Kaji | 27 |
| Amitabh Bachchan | 27 |
| Boman Irani | 27 |
| Paresh Rawal | 27 |
| Kareena Kapoor | 25 |
| Andrea Libman | 24 |
| John Cleese | 24 |
| Vincent Tong | 24 |
| Ashleigh Ball | 22 |
| Tara Strong | 22 |
| Nawazuddin Siddiqui | 21 |
| Ajay Devgn | 21 |
| Kay Kay Menon | 20 |
| Salman Khan | 20 |
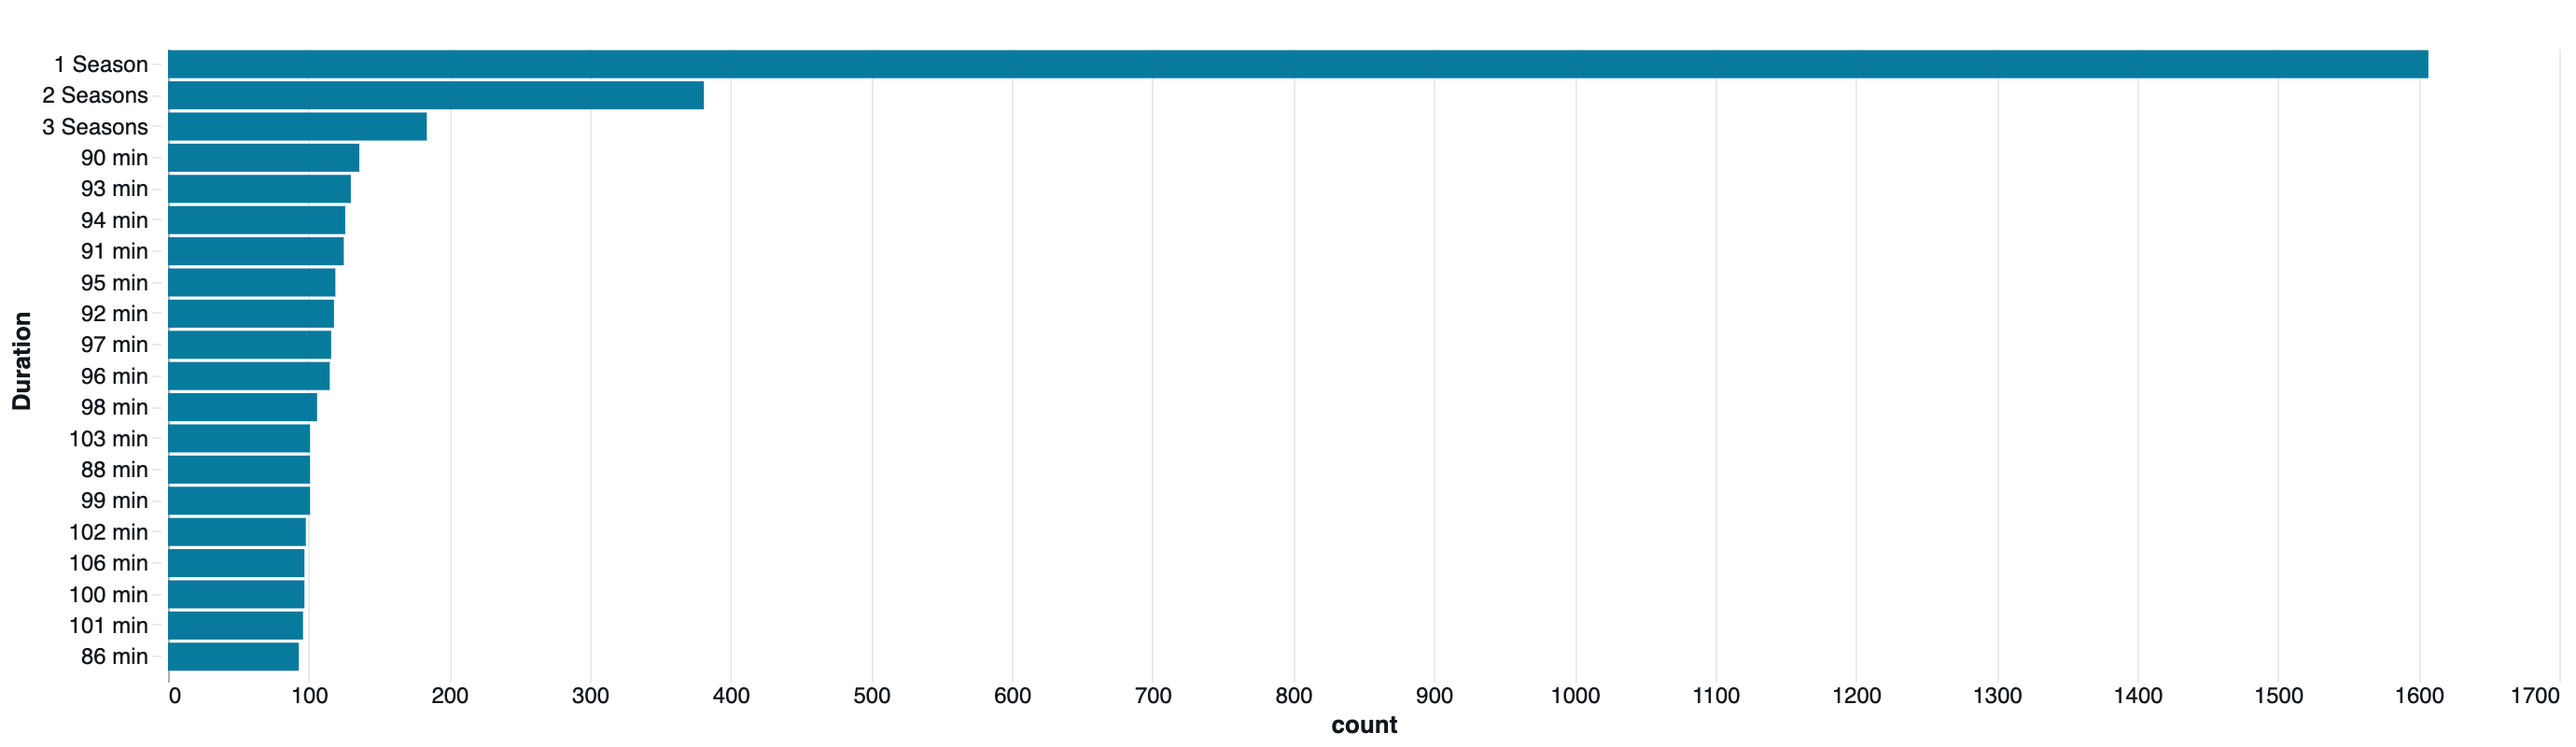
10. 期間(Duration)の分析
# Duration(映画の分数、TVショーのシーズン数)の分析
duration_col = None
for c in df.columns:
    if c.lower() in ['duration', 'runtime']:
        duration_col = c
        break

if duration_col:
    print("期間の分布:")
    display(df.groupBy(duration_col).count().orderBy("count", ascending=False).limit(20))
else:
    print("期間を表すカラムが見つかりませんでした。")
| Duration | count |
|---|---|
| 1 Season | 1607 |
| 2 Seasons | 381 |
| 3 Seasons | 184 |
| 90 min | 136 |
| 93 min | 130 |
| 94 min | 126 |
| 91 min | 125 |
| 95 min | 119 |
| 92 min | 118 |
| 97 min | 116 |
| 96 min | 115 |
| 98 min | 106 |
| 103 min | 101 |
| 88 min | 101 |
| 99 min | 101 |
| 102 min | 98 |
| 106 min | 97 |
| 100 min | 97 |
| 101 min | 96 |
| 86 min | 93 |
11. データの統計サマリー
# 基本統計量
display(df.describe())
| summary | Show_Id | Category | Title | Director | Cast | Country | Release_Date | Rating | Duration | Type | Description |
|---|---|---|---|---|---|---|---|---|---|---|---|
| count | 7791 | 7790 | 7789 | 5401 | 7072 | 7282 | 7779 | 7782 | 7789 | 7788 | 7788 |
| mean | null | null | 1084.7272727272727 | null | null | null | null | null | null | null | null |
| stddev | null | null | 1096.7795668145072 | null | null | null | null | null | null | null | null |
| min | and probably will." | Movie | "Behind ""The Cove"": The Quiet Japanese Speak Out" | "Sam ""Blitz"" Bazawule" | "Black Deniro, Byron ""Squally"" Vinson | Ama K. Abebrese | April 15, 2018 | Francis Weddey | Adriane Lenox | Alan Cumming | Eden Marryshow |
| max | s999 | William Wyler | 최강전사 미니특공대 : 영웅의 탄생 | Şenol Sönmez | Ṣọpẹ́ Dìrísù, Wunmi Mosaku, Matt Smith, Malaika Wakoli-Abigaba | Zimbabwe | United States | United States | This documentary centers on the crew of the B-17 Flying Fortress Memphis Belle as it prepares to execute a strategic bombing mission over Germany. | United States | Zoe Walker leaves her quiet life behind to investigate her brother's disappearance in Ibiza, where she quickly heads down a decadent and dangerous path. |
12. まとめと次のステップ
このEDAから以下のような分析が可能です:
- コンテンツの傾向: 映画とTVショーの比率
- 地域別分析: 主要な制作国とその傾向
- 時系列分析: 年代別のコンテンツ増加傾向
- ジャンル分析: 人気のあるジャンル
- クリエイター分析: 頻出する監督や出演者
次のステップ(案)
- 機械学習モデルの構築(推薦システム、分類など)
- より詳細な時系列分析
- テキスト分析(Description/あらすじの分析)
- ネットワーク分析(出演者・監督の関係性)